

Discover typical solar payback in 2019 for each of Australia’s state capitals.
One year and one month ago I wrote about the simple payback time of rooftop solar, which is how long it takes the savings from solar power to equal the cost of a system. In most Australian capitals it took around 5 years or less, which meant rooftop PV was one of the best investments households could make.
I have done the same thing again — except differently — and looked at the simple payback time of a 30% larger 6.5 kilowatt solar system. The good news is, thanks to the falling cost of quality solar installations, payback times are now even faster. They’re under 6 years in every capital and under 5 in most.
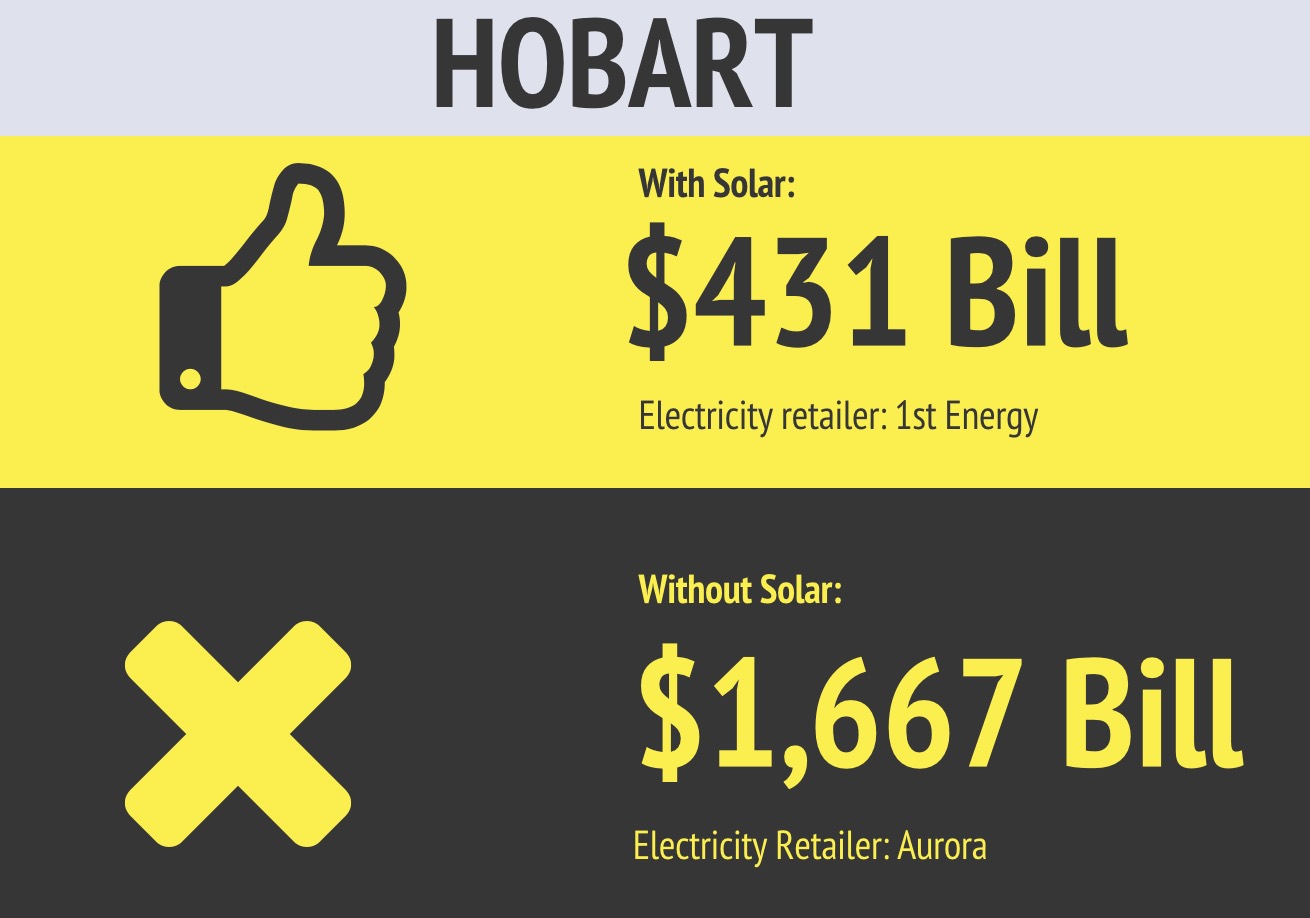
Update 1:57pm 13 June: I originally overlooked that Tasmanians can now get a 13.5 cent feed-in tariff from 1st Energy. I have updated the article to include it.
Simple Payback Is A Simple Measurement
Simple payback is just how long it takes for savings on electricity bills to equal the cost of having a solar power system installed. It doesn’t take into account the cost of:
- Capital
- Maintenance, or…
- Inspections
But this isn’t a big deal because its shortcomings aren’t bad enough to detract from its big advantage of being very simple to understand. Also, its drawbacks aren’t a major problem because:
- Short payback periods help keep capital costs low.
- Warranties means owners shouldn’t be out pocket for repairs within at least the first 5 years.
- A system inspection once every 5 years is adequate.
So when the simple payback period is around 5 years or less it should be very close to the result a more comprehensive examination of payback time would give.
Assumptions Make The Model
To determine simple payback times I’ve needed to make assumptions about:
- The size of the solar power system
- Its cost.
- Household electricity consumption.
- Solar energy system annual output.
- Self consumption of solar electricity.
- Electricity prices and solar feed-in tariffs.
Solar Power System Size
Last year I looked at the simple payback time for a 5 kilowatt solar system, but now I’m investigating 6.5 kilowatts. The reason for going up in size is not because I’ve put on weight and I’m now trying to hide it by associating with larger solar systems.1 It’s because most homes have single phase power and the maximum capacity they can conveniently install is often 6.66 kilowatts. Because rooftop solar power is a good investment I think people who have 6.66 kilowatts as an effective limit should try to get as close to it as reasonably possible. But if you can install more without difficulty I heartily recommend going for it.
A $6,500 System
I have assumed a 6.5 kilowatt system can be installed for $6,500. This is 30% less per kilowatt than the figure I used last year. While buying a larger system can be more cost effective, the main reason I decreased the price to $1,000 a kilowatt is because I am now confident that — with a sensible amount of research — people in populated areas can find good quality installers at that price. While this won’t buy the best solar energy hardware available, it will pay for a reliable system and fair and reasonable after-sales service if required.2
The cost of solar energy isn’t uniform across the country but I will use the same price for all the capitals to let their payback times be easily compared. The highest cost capitals are Hobart and Darwin due to distance, small market size, and — in the case of Darwin — the need to batten everything down so a cyclone doesn’t pick up your solar power system and drop it in the Arafura Sea.
Victoria’s Solar Homes Rebate
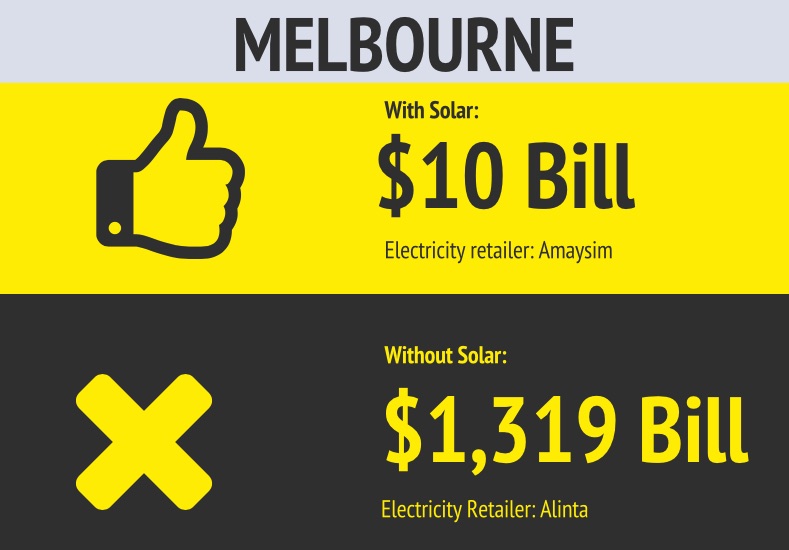
Melbourne is a special case because Victoria had a rebate that reduced the cost of solar by up to $2,225 for eligible households. This will start up again on the 1st of July and the word on the street is that it will be for the same amount. I will give the simple payback time for Melbourne with and without a $2,250 rebate.3
Household Electricity Consumption Assumption
To work out the simple payback time of solar power for a typical Australian household we’ll to decide how much electricity the typical household uses. It varies from capital to capital, but I’ll use a figure of 5,000 kilowatt-hours a year for all locations. This is close to the average used by Australian households without gas.
Solar System Annual Output
For the annual output of 6.5 kilowatts of solar in each capital I used 95% of the figure the PVWatts site gave me for north facing panels:
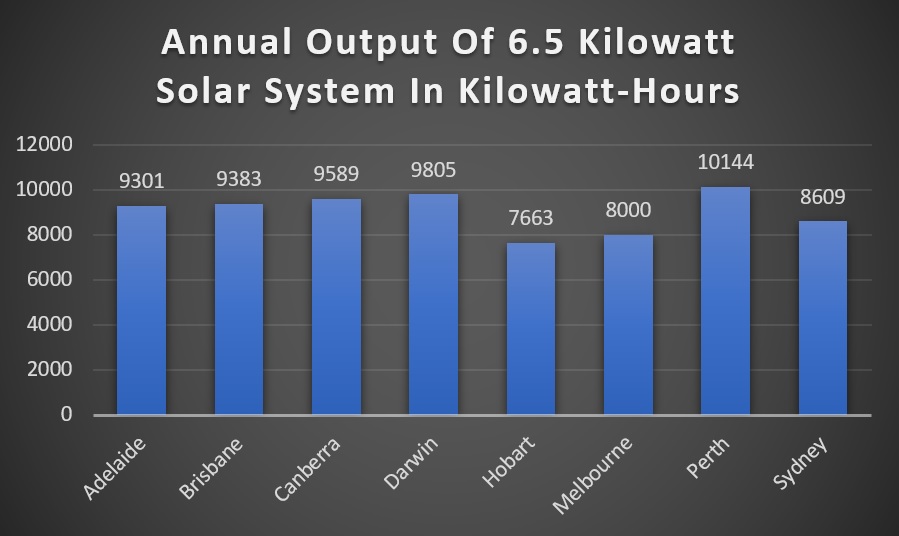
I only used 95% of the PVWatts figure because most households won’t be able to face their solar panels in the optimal direction and it allows for a minor decline in output over time.
Solar Electricity Self Consumption
Households normally consume a portion of the solar electricity they generate and send the rest into the grid for a feed-in tariff. Because the cost of grid electricity is more than the feed-in tariff, higher rates of self consumption result in faster payback times.
A smaller solar power system can result in higher self consumption and a faster payback time, but will result in smaller total savings on electricity bills. Because of this, chasing a shorter payback time by reducing a system’s size is often a false economy that can leave you wishing you installed a larger system from the start.
Households vary in self consumption, but on average those with 6.5 kilowatt solar systems self consume around 20% of the solar electricity generated, so I’ll use that figure.
Electricity Prices And Feed-In Tariffs
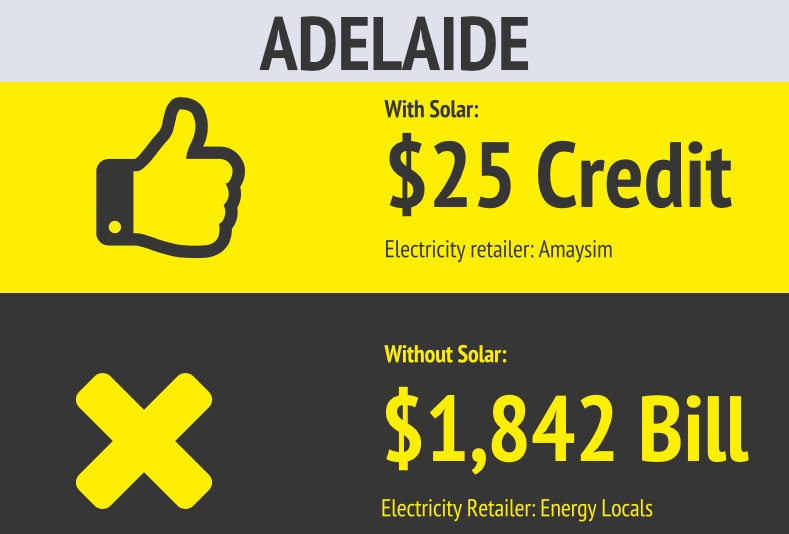
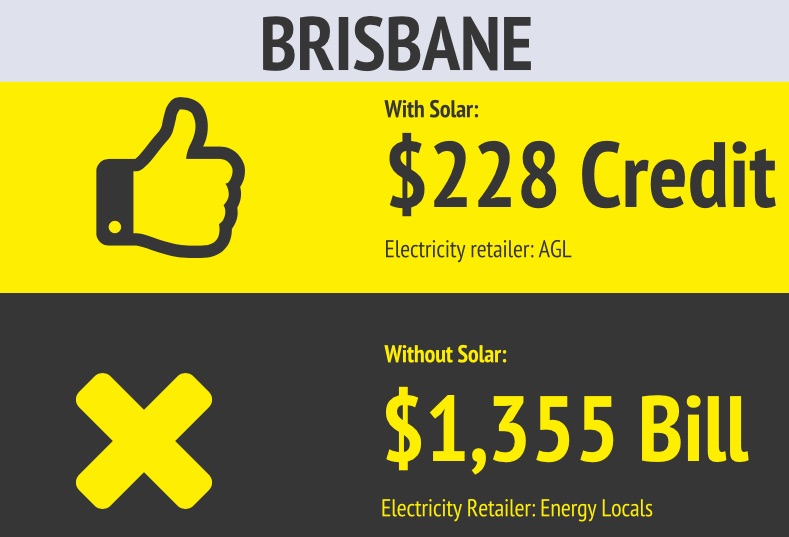
Working out how much 6.5 kilowatts of solar PV reduces annual electricity bills requires subtracting what electricity bills would be with solar panels from what they would be without panels installed. I did a search and used the most cost effective standard tariff4 plans for both situations in each capital and put them in the table below along with the annual savings from installing solar panels:
Or if your eyesight is failing:
In Darwin, Hobart, and Perth electricity prices are set, but in other capitals there is retailer choice and a wide range of electricity plans to choose from. It’s possible there are better plans out there than the ones I’ve used, but they’re not likely to make a large difference. It’s also possible to bargain with electricity retailers, so you may be able to get a better deal that way, but the closer they are to being the best option available the less likely they are to budge on price.
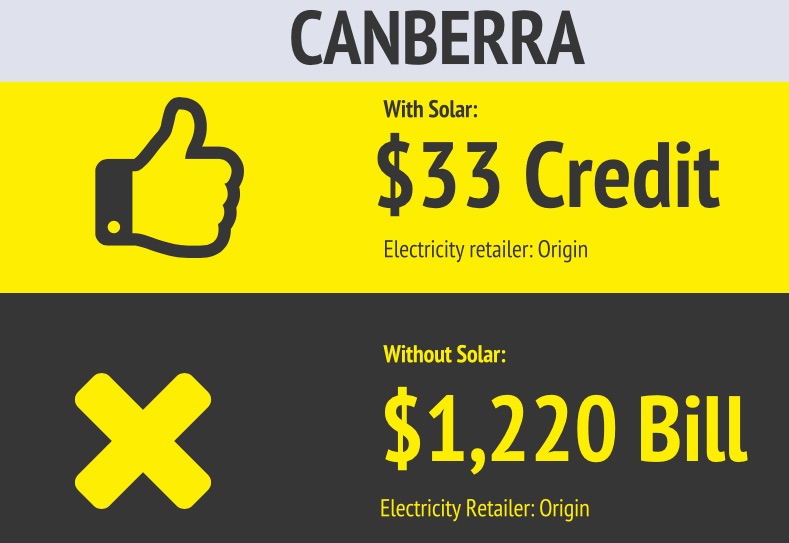
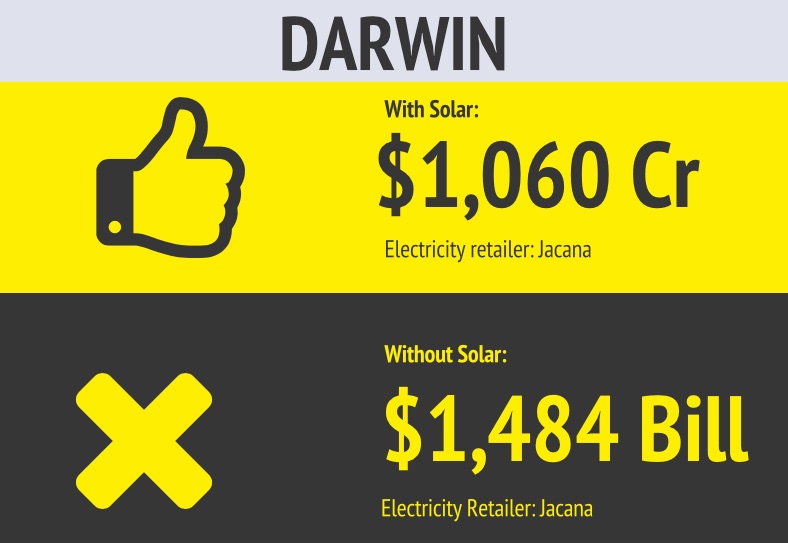
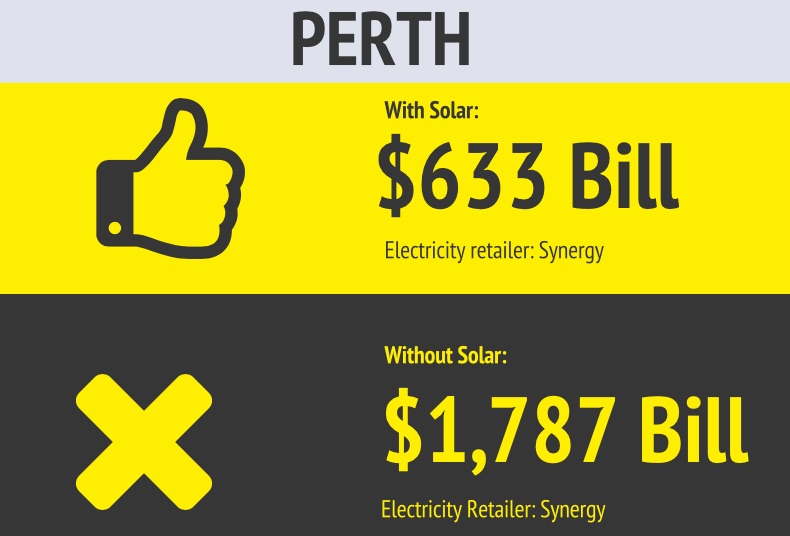
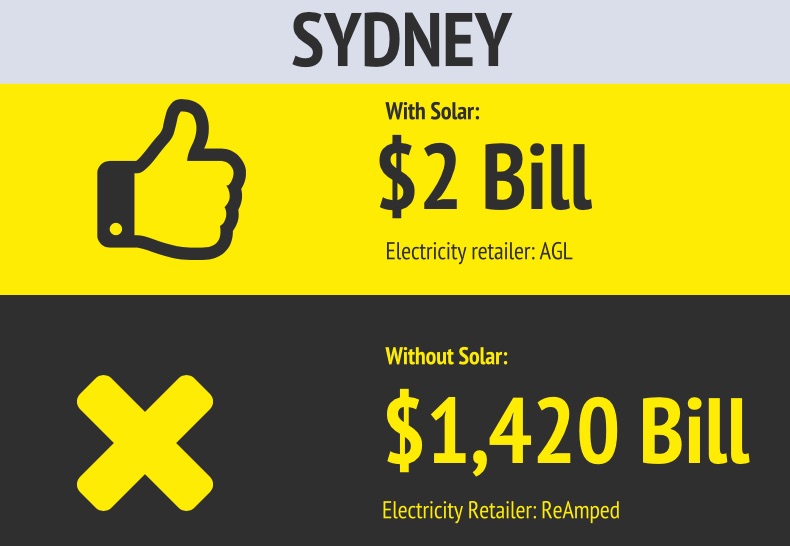
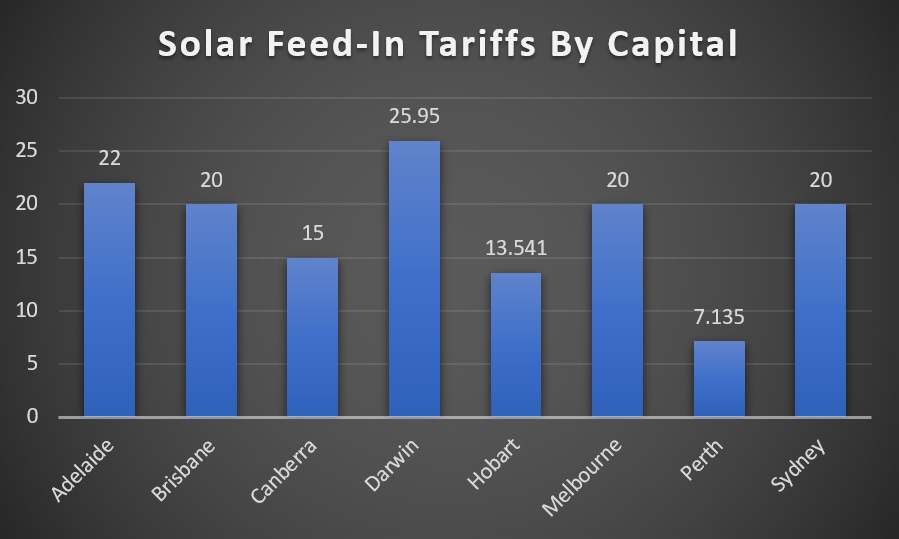
As you can see on the table above, in Adelaide, Brisbane, Canberra, and Darwin annual electricity bills with solar panels are in credit. This means over a year the household will receive more money from their electricity retailer than they pay. Darwin does especially well because their feed-in tariff is the highest in Australia and equal to the cost of grid electricity. While electricity bills in Melbourne in Sydney aren’t in credit they are close to nothing. This means in most capitals a 6.5 kilowatt solar system can reduce a typical household’s annual electricity bill close to or below zero.
This graph shows the feed-in tariff received in each capital in cents per kilowatt-hour:
Payback Times
The simple payback times for 6.5 kilowatts of solar in Australian capitals are shown in the graph below:
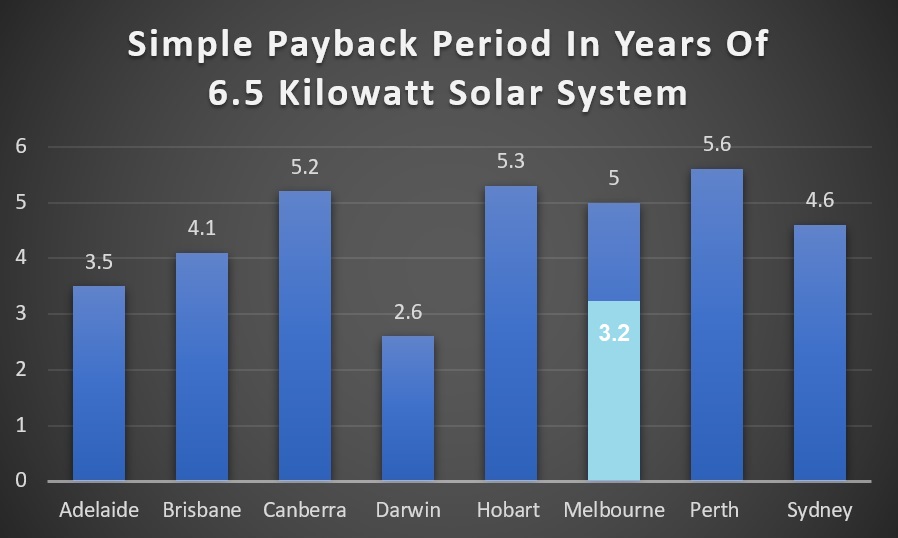
Darwin has the fastest payback time thanks to Australia’s highest solar feed-in tariff. Second fastest is in Melbourne at 3.2 years. This is indicated by the light blue section and assumes the Victorian Solar Homes Package lowers the cost of solar power by $2,225. If this isn’t included the simple payback time in Melbourne is 5 years. Adelaide comes third thanks to a high feed-in tariff and high electricity prices.
Perth has the longest payback time on the mainland5 , despite being the sunniest capital, because it has the lowest feed-in tariff. Hobart is the least sunny capital but manages to do considerably better than Perth thanks to a higher feed-in tariff being available.
Bonus Graph — Zero Solar Self Consumption!
I used a figure of 20% for solar energy self consumption. While people such as retirees who are usually at home during the day generally use more than this, some people who are normally out of the house all day may be wondering if solar energy is a good investment for them. Well, it’s no problem, I’ve got you covered and I’ve made a graph showing the simple payback time for every capital if you somehow manage to use no solar electricity at all yourself.
This should almost be impossible because even if there is no one at home for every hour of daylight every day of the week, appliances such as refrigerators and freezers should still be drawing power. But in the interest of showing a worst-case scenario, here are the results:
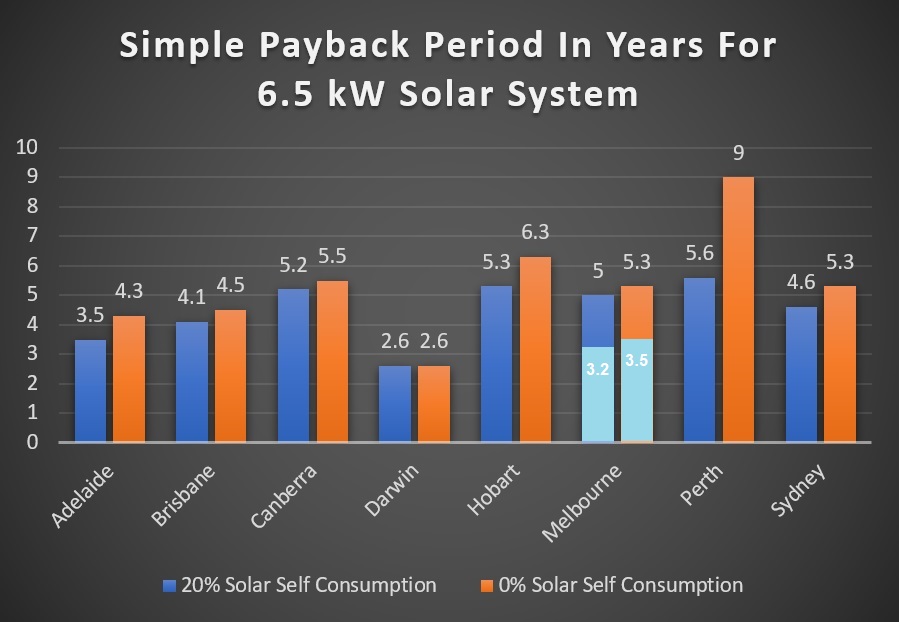
As you can see, zero self consumption doesn’t make a huge difference in most capitals and solar power still pays for itself very quickly everywhere with the exception of Perth. Because their feed-in tariff is so low having zero self consumption makes a large difference. If you want a good payback time there I recommend making sure you have a reasonable self consumption rate. But everywhere else I would definitely say solar energy is still a good deal even with zero self consumption.
Solar Power Pays
Electricity prices and feed-in tariffs may decline in the future and stretch out the simple payback time of solar systems installed today. But it’s unlikely to be enough to make rooftop solar power a bad investment.
Simple payback periods will improve further as the cost of solar drops even lower. But I’m certain you won’t save more money by waiting than you will by getting solar panels now and immediately reducing your electricity bills.
Footnotes
- That benefit is just pure luck. ↩
- I would be wary of going too far below this price point — unless you are certain the installer does good work — as very cheap solar can mean an installation where corners have been cut and little or no assistance if there’s a problem. ↩
- When this scheme starts up again it will actually be a subsidy rather than a rebate, but I may be the only person alive who cares about this. ↩
- With a standard tariff a home pays a flat rate for each kilowatt-hour of grid electricity used. I am also not considering controlled loads that can lower for cost of electricity for tasks such as heating water. ↩
- Although for some reason Perth also has the cheapest solar power system pricing in Australia so you are likely to do better than this analysis suggests ↩
 RSS - Posts


We now have a second retailer here in Hobart Ronald (1st Energy). As far as I know the difference is negligible but could you please include them in your calculations in future so we can see what the alternative is.
I completely overlooked that Tasmanian now has a second retailer with a higher feed-in tariff. That was forgetful of me. I have updated the article to include it. Thanks for pointing it out.
Thanks for that – I have made the switch as a result !
Hi Ronald,
With your Sydney 20c FIT is very hard to find. I have it through AGL but the only way In found it was through you doing an article on it last year.
The other area of confusion is different retailers giving different FITS.
AGL have a simple no discount plan which gives a lower supply cost for electricity but only pays 11.1c FIT. Honestly it is so hard to work out which plan is the best.
100% agree which is why we have this tool on our site:
https://www.solarquotes.com.au/energy/
This works it out for you! With the caveat that you should double check your eligibility with the retailer before signing up – as they can have small print re: max kWh or max system size which the tool does not take into account.
(Also it is flat rate tariffs only)
Hi Finn AGL in NSW limit it to 10Kw inverters. I have 3phase and 3 separate systems equaling 9.5 Kw.
Hi Ronald,
Very informative article as usual – many thanks for doing this.
For payback period to be useful, surely you have to take the capital cost into account? Assuming a counterfactual of regular payments to the electricity supplier, a reasonable estimate would be the interest (or opportunity cost) on half the capital over the entire period. Given the cost of money is effectively about 5% at the moment, then about 2.5% of the capital cost should really be included in payback period calculations.
Phil
For payback period to be precise it would need to take into account the capital cost. But I’ve just done the simple payback time because it’s so easy to understand. Every one gets it and can use it to help decide for themselves if solar is a good deal for them. Working out the complex payback time is something I can do if people are interested, but it would be a more complex article.
Great article, and even better payback than I thought. I didnt realise that so many would be in credit over the year.
BUT, you stated “self consume around 20% of the solar electricity generated”. This is extremely pessimistic. From our data of over 11,000 systems around this size the self consumption average is 37% (does vary from under 10% to over 80%).
So paybacks are even better for most people.
Almost makes you think putting solar on your roof is a damn fine idea, especially if you want to avoid your kids hating you for allowing the planet to descend into climate chaos
Stefan
Is that for systems of around 6.5 kilowatts? My figures are around 20% self consumption for that size system for a typical household.
Hi Ronald,
Does your modelling assume a nominal system with:
– 6.5 kW solar-PV panel array;
– with the array facing true North unobstructed;
– with the array at an optimum elevation to suit the specific site latitude;
– coupled to a single-phase grid-tied 5.0 kW inverter;
– with net-metered grid connection;
– with STC rebate included?
Are you using the figures in your STC calculator in your modelling?
https://www.solarquotes.com.au/tools/stc_calculator/
Is there such a thing as a 6.5 kW rated inverter, or are 6.5 kW solar-PV array systems usually coupled with 5.0 kW rated inverters?
Would there be much difference to payback times if the inverter had the same output capacity as the solar-PV array capacity? Worse or better?
You say:
“Simple payback periods will improve further as the cost of solar drops even lower. But I’m certain you won’t save more money by waiting than you will by getting solar panels now and immediately reducing your electricity bills.”
I agree. IMO, anyone who is an owner-occupier of a freestanding home with a suitable, unobstructed roof-space that doesn’t have a solar-PV system is missing out on substantially reducing their energy bills.
I used PVWatts defaults just to make it easier for anyone to copy me. The losses they already account for are:
2% panel mismatch loss
2% dirt loss
3% shading loss (this represents minor shading)
2% wiring loss
0.5% connections loss
1.5% LID loss
1% lies losses (discrepancies between what equipment is rated for and what you get.)
3% availability losses (eg. grid over voltage events.)
They also assume 20 degree tilt, which is a round number between Australia’s most common roof tilts.
I didn’t adjust the inverter to PV ratio. This would have cut output by 1-2% but PVWatts still uses 96% for inverter efficiency which is 1% or so less than what is being put in today. I used a figure of 95% of what PVWatts gave me for north facing panels to account for other losses such as sub-optimal panel positioning. etc.
A normal grid connection is assumed and the price I used includes STCs reducing the cost of solar.
The 6.5 kilowatt system in my example has 6.5 kilowatts of solar panels and a 5 kilowatt inverter. A 5 kilowatt inverter is the maximum many homes with single phase power are permitted to install.
I don’t know of any inverters that are exactly 6.5 kilowatts, but if one of them was used the benefit would be small and might reduce payback times by 1%.
5kW is not a maximum limit on single phase. I got 10.1kW inverter capability with 11.3kW panels allowed with the provision that I have a 5kW export limiter installed. But big deal…. I would never get to export 5kW most of the time anyway.
Inverter 1: 1.5kW (8 years old)
Inverter 2: 3.6kW (6 years old)
Inverter 3: 5kW (6 months old)
45 panels
+
Powerwall 2 5kW
So, total inverter capability = 15.1kW on a single phase.
Fortunately not everyone is faced with a 5 kilowatt solar inverter limit, but a considerable number of people are. There are ways around it, but these can depend on location.
would the logical consequence of low feed in tariff for people not at home all day (in Perth) be to install a battery, so they can use part of their solar power after sunset?
Also can you do something about off grid systems ( not including the $30000+ cost to connect to the grid)
Thanks
Regina
It shouldn’t be that complicated to work out…..
Just forget for the moment of putting that money in a bank.. it’s a useless exercise given that interest is less than 2% for most people. Secondly, you can’t do anything with the money while it’s in the bank. So, it’s a sitting duck not doing anything useful for anyone except for the banks.
Using the PVWatts site for one’s location, you can get a estimated annual solar output.
There can only be three outcomes:-
1. Worse case scenario, one exports all their solar output for FiT. Multiply the estimated annual output by FiT to work out maximum possible FiT credit received.
2. Best case scenario, one consumes all their solar output for self consumption. Multiply that by one’s “normal” energy rate for maximum self use value.
3. For most people, it’s somewhere between 1 and 2.
So, for a 5kW north facing 20 deg tilt system in Sydney on a 11.1c FiT and 28c energy rate charge, estimated annual solar generated about 6900kWh.
So, it will be either:-
1. $765 FiT credit possible for 100% export.
2. $1932 worth of self consumed electricity for 100% solar self consumption
3. Somewhere between $765 and $1932 benefit that one could possibly get in value if they didn’t export 100% or self-consumed 100%
(So you can see immediately, it is imperative to self-consume as much as possible as it’s worth more than 2.5x in value).
It will take about:-
1. For 100% export only = 4.57 years payback time for a $3500 5kW system
2. For 100% selfconsume only = 1.81 years for payback for a $3500 5kW system
3. Somewhere between 1.81 and 4.57 years for a mixture of self-use and FiT credit for a lot of people.
Not overly hard to work out. Don’t know why people are complicating this process. There are only really two numbers to work out – either 100% full export or 100% self consumption. It will be a number in between to work out worse and best case scenarios for most people. Most likely it will be 50% FiT – 50% self-use – so payback will be about 3.2 years 50/50 on a 5kW solar system in Sydney.
Granted, some complications come in play for those on ToU like myself. But since solar rarely plays a factor in off-peak periods. I just average out the Peak/shoulder periods, since most of the solar production occurs in peak periods. So, even if I just use the shoulder rates, at least that will cover both shoulder and peak periods at worse.
But regardless, most people would not be on ToU without Solar. Endeavour Energy reports that only .01% of residential customers are on ToU (approx 1000 residential customers). So, using a standard retail anytime rates would be a safe figure to use to work out potential value of self-use.
The good thing about ToU is that most of the shoulder/peak usage is eliminated while gaining access to off-peak rates for the whole house at night and weekends/public holidays. So, it’s a win-win. The off-peak is not to be confused with controlled loads – two very different things.
We paid a low tier retailer 4k to put nearly 6kw on our roof working on a 2 year payback in Melbourne with the rebate. Then our electricity retailer went and put us on a pfit tariff of 66.6 per kwh and the system payoff dropped to about 7 months. I kinda wish id paid for a better system now. I could have easily afforded LG panels and microinverters at those payback rates.
All very well and good provided you don’t move house hor 6 years or you will have to start all over again.
The solar system will add to your home’s sale price. Even if it only adds half of what you paid for it you’ll still come out well ahead.
A 6500W system in Darwin costs $10k, not $6500.
Where did you get the 22 cent feed in tarrif for Adelaide.? Shopping around best feed in tarrif is 16.3 cents!
Go to our electricity plan comparison tool:
https://www.solarquotes.com.au/energy/
Type in your postcode and hit “Compare Electricity Plans” and then hit “Sort by FiT (highest first)”. Amaysim will appear at the top with a 22 cent feed-in tariff. Other retailers with high feed-in tariffs include Click Energy (22 cents) and AGL (20 cents).
Hi Ron,
Can I make a suggestion for this tool that could enhance its end user appeal!
Given every household consumption is unique, and most is us visiting SolarQuotes has a good understanding of our berate daily consumption.
Maybe adding the the daily average usage in 5kwh (is 5 up to 50kw) increments and the. Adding the size of the PV system (1.5 up to 15) and closest city. If you have time the. Even add the percentage of self consumption (usually defaulted to 20%)
This would be kick ass then!!!
Yes, I have 6 people in my house hold
Yes but Amaysims price for usage is high. The energy locals figure you used for billing only offers 6c fit. They all seem to be reducing fit to the minimum allowed for new customers. I am with Origin who’s prices are good for consumption but are offering 6c fit. Still waiting for my installation but shopping around pay back for Adelaide is going to be longer than you estimate.
Your estimates should be based on using the same supplier for both figures as you can’t use different ones for supply and feedback.
Hi Melanie
Don’t worry, I used the same supplier for supply and feedback. I just used different retail plans for a household without solar and a household with solar, since a home without solar obviously doesn’t need a good feed-in tariff.
They are dropping fit fast. When I got quotes for installation it was 20c, then 11c and now 6c. That is with Origin SA but you can safely assume they will all start to drop or charge more for consumption/supply.
Still think it is worth it for us and we are installing a bigger system, albeit with a choked feed in to comply, to ensure decent generation in winter.
We are in most days and do not have gas. Will be interesting to see our first bill after installation.
Sydney’s high-rise apartment dwellers ? – rooftop solar panel installation is understandably impossible.
Considering solar parks near the neighbourhoods ? – mini-centralised power transmission.
Vijay
Hop over to any German Solar site. Most of them have Solar Units you can hang off your balcony rails and they plug straight into your Unit power.
I don’t know if they are available here in Australia.
I had a look at them some 8 or so years ago.
Cheers
Denis
1st energy’s FIT is 5c a kWh more than Aurora, and they do a time of use tariff too. I switched as soon as they came into Tassie, and glad I did! Let’s hope more retailers come to Tassie, too!
You have as far as I can tell said nothing the ageing degradation of solar panel efficiency. Niether did you specify lifetime test cycles for different brand and types of solar panel. Nothing retains 100% efficiency indefinitely and neither does anything last forever. IMHO if you are going to do a true ROI calculation as with a TV or Washing Machine or any other electrical hardware initial cost, maintenance, efficiency losses due to ageing and overall life cycle must all be taken into account when making a cash investment. Also if a household’s usage is below a certain annual dollar value….mine is around $1200 pa then a 6.5Kw installation costing $18000 as was quoted to me then taking into account even the subsidy means the ROI is not that attractive in my estimation. So solar is not for everyone unless it is free I would say.
This topic – which is excellent – and solar 101 “#3 How many panels should you buy?” assumes that the best sized system is one with 6.6 kW of panels combined with a 5 kW inverter for earliest recoupment of the investment.
Another option for those with larger, less complex roofs is to choose a larger system, say one with 36 275W panels being 9.9 kWs combined with an 8.1 kW inverter, still on a single phase electricity connection but with the feed in (FI) limited to 5 kW per hour. This is possible in Queensland.
The extra cost of the larger system to the purchaser may be only $1,750 above the $6,500 cost assumed above.
For a 6.6 kW solar household with a 12 kW daily consumption, half being in daylight hours this equates to 2190 kW being consumed annually. This quantum needs to be offset from the 9,383 kWhs generated annually leaving 7,193kW for the feed in tariff (FIT). Assuming an average 8 hour generating day, the FI would be 2.46kW hourly earning, at a FIT of 11c/kW, $791 annually to offset the 6kW overnight grid supplied at say 27c/kW being $591. This means the $791 income plus the reduction in half the electricity grid costs is a positive. But the FIT rate is still important so if you can get 22c/kW for even two years, the income becomes $1,582 annually. Ah…
I’ve got Fin’s 6.6kW panel/5 kW inverter, but only since last September. Assuming the FI is 7,193 kW annually and an 8 hour day the 5 kW inverter returns an average of 2.46 kW hourly FI to the grid.
For a 9.90 kW system, 1.5 times 9,383 kWhs would be generated or 14,075 kW annually. Taking off the personal consumption of 6kW daily or 2,190 kW annually leaves 11,885 kW for FI annually. Assuming an 8 hour day again, this equates to 4.07 kW hourly, still below the 5 kWh cut-off. At an 11c/kWh FIT the annual earning becomes $1,307 which is 1.65 times the former $791 with the standard system. And the extra benefit comes from an increased cost of $1,750 over the standard cost of $6,500. And if you can get 22c/kWh your are really chewing up your investment cost.
I appreciate a large, simple roof structure is needed and no doubt some of the peak generation will be curtailed by the 5 kW limit (by the way, what happens to the excess power?).
But on these assumptions and realistic forecasts, a 9.9 kW panel/8.1 kW inverter solar system would seem to be the way to go in Queensland.
Happy if greater minds show otherwise.
@John,
What happens to the excess power if the inverter is rated at 5kW fitted with 6.6kW panels (“33% overclocked”)?
Nothing, there is no excess power… the inverter shifts its MPPT algorithm to clip the panel’s efficiency to a lower point so that it only produces what the inverter will accept and will constantly adjust itself. So, when sun moves and the inverter’s MPPT tracks the power production of the panels, it will adjust accordingly. Sometimes this is referred to as clipping but technically incorrect. Clipping occurs on voltage regulators (and usually dissipates as heat which is a waste byproduct).
So, it’s not a case of excess power disappearing, it’s just the inverter alters the panel’s V/I curve to make the panel behave differently to match maximum power input to that of the inverter (on the DC side). The inverter doesn’t dump excess power somewhere nor does it dump excess AC power to keep the power rating within limits.
But this is a good thing because it means when there is low light/early morning/late afternoon solar, you have 33% more panels producing power under the rated inverter wattage, so you gain more energy production. The potential extra energy lost will mostly occur in high noon in summer. But that’s okay, it’s only for about 4 months in the middle of the day of the year, the rest of the year will compensate for that loss in summer by gaining more solar production in the other months.
E.g., 5kW inverter with 5kW Panels at midmorning might produce about 3kW
but 5kW inverter with 6.6kW at midmorning might produce about 4kW, so you gain an extra 1kW
But in summer, you will lose about 15-20% due to high temps, so the extra power rating of the panel offsets this loss.
Every 1C rise will reduce the panel’s output by 0.5%. So, by overrating the panel’s power, you can make up for the loss caused by heat in the summer high temperatures. So, effectively, you can max out the inverter’s rating without losing too much power production from the panels in hot summer conditions.
Overrating the panels simply “mimmicks” the effect of using solar trackers and more cost effective.
Solar trackers will achieve about 20% extra energy harvesting by single axis tracking and 25% if using dual axis tracking. But solar trackers are expensive. So, easier to overrate the panels by 33%. Their only advantage really is real estate by reducing the number of panels required. If you have a large roof space, just use more panels to offset the difference.
In my case, my panels face east and west, so I automatically lose about 16% of solar production. By using 33% larger panels, it overcomes this orientation loss and the inverter does less “clipping” and acts as if I have a full blown 5kW system facing north. It’s all about angles – lattitude, tilt and orientation, when it comes to determining the optimum size vs costs.
So, the “excess” power doesn’t disappear due to excess production, the inverter simply alters the panel’s V/I curve to change the power output by using MPPT to match its maximum input DC rating.
I am questioning your Melbourne results as firstly they do not seem to reflect the utilities growing use of fixed supply fees that have crept in over recent years. eg. half of my $150/qtr elec bill is fixed charges which I cant save on. Secondly you refer to Amaysim as the solar elec supplier at $10! pa, but their website today told me that they dont yet have solar plans. At least not in my area which is Rosebud in the metro area.
Were you assuming an old house with low star rating? Mine is 6 stars using leds etc and wood heating, with elec bill of only $700 pa, mostly on summer as i use wood heating.
Sorry to hear Amaysim isn’t available where you are. The figure I used for annual electricity consumption of 5,000 kilowatt-hours should be close to average household consumption. Average household size is 2.6 people and the government Energy Made Easy benchmark site gives a figure of 4,526 kilowatt-hours for a 2 person household in Melbourne and 5,262 kilowatt-hours for a 3 person household. Of course, it is possible to do much better than the average.
With the article referring to 6.5kW systems (panels capacity), and, with the limit on single phase connections (well, applicable here, anyway) of 5kW inverters, and, with inverters such as the Goodwe GW5000D-NS having specifications with a limit of 6.5kW DC power, I am wondering whether, when such an inverter has DC power input greater than the output capacity of the inverter (in this case, 5kW), however the inverter deals with the excess power (I am assuming that it does not simply process it, and, output the extra power), the excess power going into, or, being faced by, the inverter, is in any way, detrimental to the inverter, and, thence, causes the inverter any harm, or shortens its life, or, anything similar.
One thing this article (and every other payback calculator I’ve seen online) doesn’t seem take into account is the fact that most retailers give a “pay on time” discount for non-solar power. Mine is 25% with AGL. Solar plans don’t offer this discount, or even if they did it would be unhelpful when your bill is close to zero or a credit. So the assumption that your usage and daily charge is the same before and after installing solar is incorrect. For example, if I installed a 6.6kW system in Brisbane and have 50% self consumption, most calculators tell me my payback is around 3 years. I calculate it to be closer to 4 years. It’s still a worthwhile investment even on monetary terms, but something people should be aware of.
“A smaller solar power system can result in higher self consumption and a faster payback time, but will result in smaller total savings on electricity bills. Because of this, chasing a shorter payback time by reducing a system’s size is often a false economy that can leave you wishing you installed a larger system from the start.”
Does this mean that, even if it takes longer to amortize the installation, in the same time line with respect to a smaller installation, it will generate greater accumulated savings?
Thank you and sorry to google for his native English. Greetings from Spain
I’ll put it this way: A person has $10,000 and their investment choices are…
1. Put money in the bank at 1% interest.
2. Pay off a home loan at 3% interest.
3. Invest in a large $10,000 solar system that provides 7% return.
4. Invest in a small $3,000 solar system one quarter the size of the large one that provides 10% return.
While the small solar system has a higher return, 10% of $3,000 is only $300. But 7% of $10,000 is $700. So the household will be better off getting the large solar system. If they like, they can put the money it saves them towards paying off their home loan, which is their next best investment choice after solar.
So the system with the highest return is not necessarily the best investment. In addition to this, the larger system will provide greater environmental benefit, so it’s a win for the homeowner and a win for the world.
Hi,
Perth FIT are now for the hours 3pm – 9pm 10c, 2.5 cents the rest of the day. That said my 6.6/5kw system is on track to a 920 day pay back.
I currently have 10 x251 panels and an annual bill of around $1400. I have had an offer of a 6.6kw system installed (after rebate) of $4500 with a payback of 3 years. They have examined my power accounts and indicated that my power account will be in credit each quarter.
Does this seem correct as I am skeptical.
Hi Gary, if you send the quote to [email protected] the team can have a look at the details.