A comprehensive quote
← Site Inspection | The Good Solar Guide Contents | Terms & Conditions →
A sign of a professional installer or installation company is a comprehensive solar quote. Here is the information that you can expect to see on each of your quotes:
Item 1: An itemised list of the hardware to be supplied
At a minimum, this should include the following:
- Solar inverters: Quantity, brand, model, AC rating (kW), number of MPPTs and warranty, including warranty extension options.
- Solar panels: Quantity, brand, model number, panel size (W), total array size (kW), product warranty and performance warranty in years.
- Racking: Brand. (Good brands include Radiant, Grace, SunLock, Clenergy and Schletter.)
- Monitoring system (if needed): Brand and any ongoing subscription fees.
- Extra charges: split arrays, two-storey roof, switchboard upgrade, tilt frames etc.
Item 2: Installation warranty
The installation warranty covers defects in the installed system that are not specific to the solar panels or inverters, for example, if a cable becomes disconnected, an isolator fills with rain and fails, or the racking system comes loose.
- Don’t accept less than 5 years
- If the installation is subcontracted, don’t accept a clause that places responsibility for honouring this warranty with the subcontractor. That’s not allowed under Australian Consumer Law.
Item 3: Total price of all goods and services
This includes the following:
- The gross cost of the system including GST
- Discount from STCs (AKA the solar rebate)
- Any extra charges such as for two storeys, tiled roofs or split arrays
- Any state-based rebates
Here’s an example:
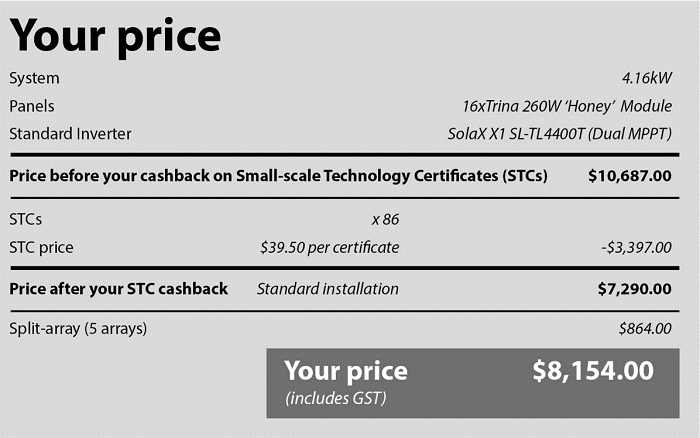
Figure 6.1 Price section of a quote.
Key point: STC prices change. We learned in Step 1 that STCs can change in value every day. Your quote must clearly state whether the quote has fixed the STC price or not. For example, if the market STC price drops between now and the day of the installation, that reduces the value of the rebate.
In the example above, a drop of $3 per STC would reduce the rebate value by 86 STCs x $3 = $258.
Will the installer wear that cost or increase your price?
This must be clearly disclosed – not hidden in the small print.
Item 4: A sketch or diagram of the proposed roof plan
This should include an itemised list of every solar panel array’s direction and tilt.
For example:
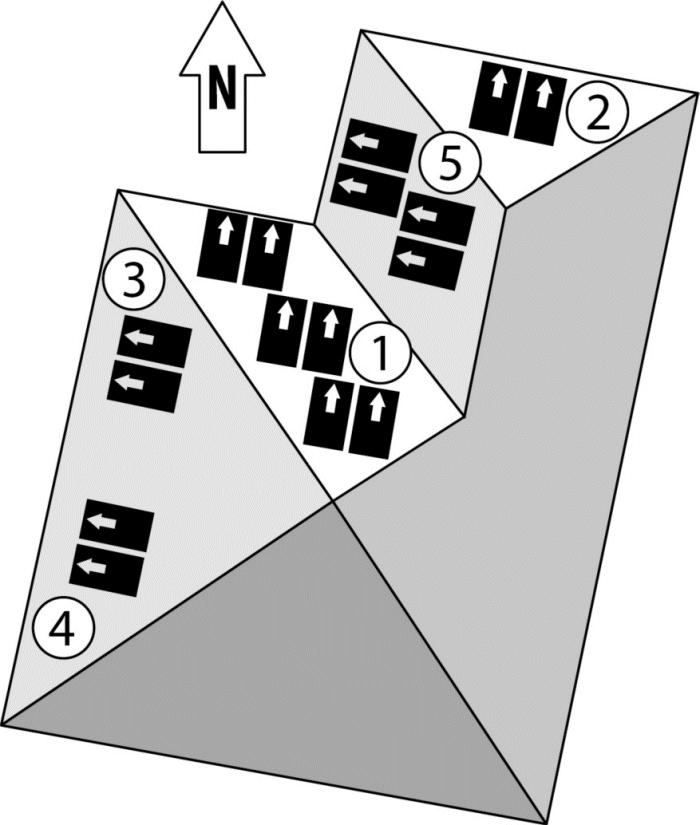
Figure 6.2 Roof plan showing five separate arrays to be installed and an existing solar water heater.
Panel arrays:
- Six panels: direction 10 degrees clockwise of north, tilt 30 degrees from horizontal
- Two panels: direction 10 degrees clockwise of north, tilt 30 degrees from horizontal
- Two panels: 10 degrees clockwise of west, tilt 30 degrees from horizontal
- Two panels: 10 degrees clockwise of west, tilt 30 degrees from horizontal
- Four panels: 10 degrees clockwise of west, tilt 30 degrees from horizontal
It is important to itemise each separate solar panel array because it shows that the installer has accounted for the expense of cable penetrations through the roof at every array. An install done on the cheap might only have one roof penetration, with the arrays connected with ugly electrical conduit going all over your roof like spaghetti.
Item 5: Your expected efficiency losses due to shading
If your roof has any shade at all, the solar quote should include how the installer has calculated these losses. This post explains how I believe it should be calculated: solarquotes.com.au/shade.
Item 6: Estimated energy yield for your roof
I like to see a chart or table with estimates of the system’s average daily performance (in kWh) for each month of the year.
Figure 6.3 is an example from a Queensland quote.
A chart like this on your quote serves two purposes. Firstly, it shows that the company quoting is a true pro, because they’ve invested in a system that accurately models system performance. Secondly, it lets you assess if you’ll have enough energy through winter. You can compare the worst months with your measured daytime usage, with extra kWh added on for water heating if that applies to you.
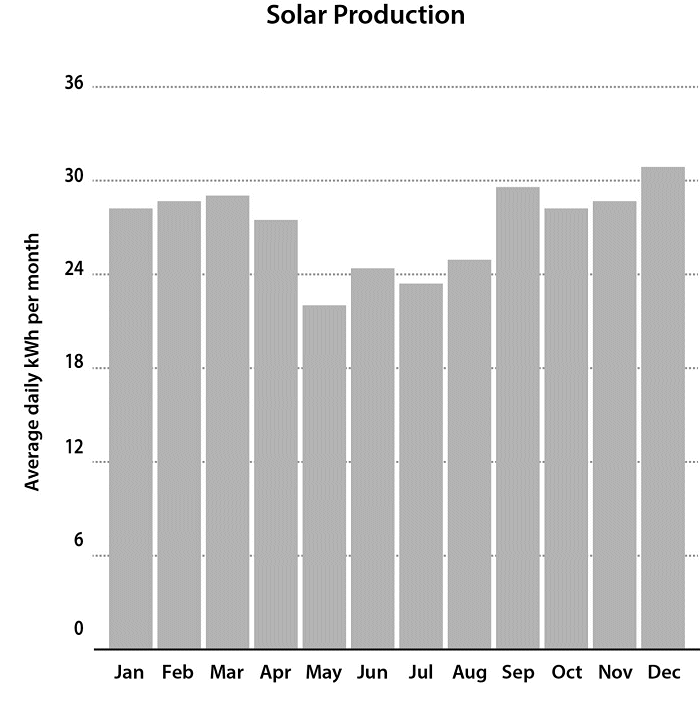
Figure 6.3 How a good quote presents expected solar electricity production for a Queensland system
Monthly variation isn’t a big deal for lucky Queenslanders. But if you live in South Australia, you really need to consider it.
Here’s a chart from an Adelaide quote:
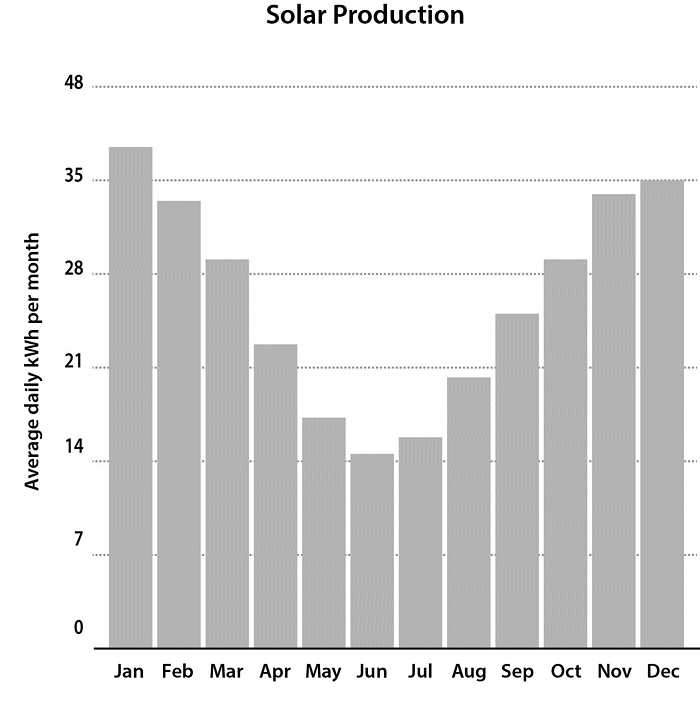
Figure 6.4 Variable monthly production in Adelaide.
Item 7: Savings projections and associated assumptions
Any solar seller who has confidence in the systems they’re selling should be happy to put your estimated savings in writing. Your actual post-solar electricity bills will depend on how much energy you use after the system is installed. If you throw caution to the wind and use twice the electricity after the install, your bill may not improve or may even get worse. If you keep your consumption the same, it’s easy for an installer to predict your savings.
Self-consumption ratio: As we’ve learned, the biggest thing affecting projected savings is your self-consumption ratio. That means it’s important for any projected savings to show the self-consumption ratio they’ve assumed. Check this is close to the one you calculated in Step 2. If the ratio is based on 100% self-consumption, that’s a red flag. I don’t know any household that consumes 100% of their solar electricity.
Figure 6.5 shows how a good quote may present your self-consumption ratio – so you can sanity-check it:
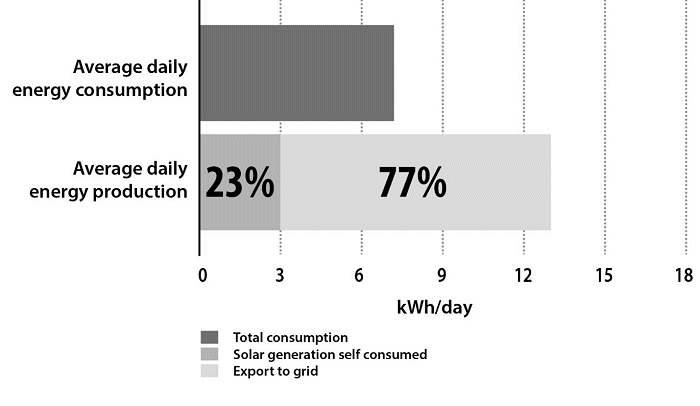
Figure 6.5 How a good solar quote presents the self-consumption used in savings estimates.
As you can see, this customer is predicted to self-consume 23% of their solar generation.
Internal rate of return: The quote may also calculate your internal rate of return based on a fixed timeframe. Twenty-five years is reasonable if the panels are warranted for that amount of time.
One thing to bear in mind is inverter replacement. No inverter is likely to last 25 years, so the internal rate of return should include the cost of one replacement inverter. Check the installer has included this.
Total savings: If a modest annual electricity price increase is assumed, the total savings over 25 years can be quite astonishing.
Figure 6.6 demonstrates a good way to present total savings. Be sure that the solar quote shows the inflation of electricity prices they have assumed and make sure you agree with it.
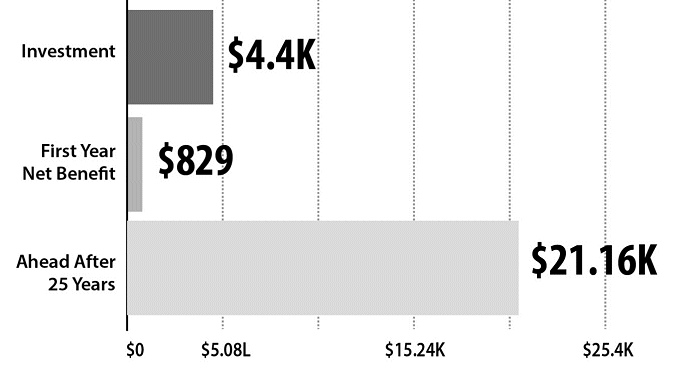
Figure 6.6 Return on investment over 25 years.
Bill before and after solar: This is the most important projection for most people. What can you expect your post-solar bills to be? After you get solar, you’re unlikely to maintain a spreadsheet and track your internal rates of return, but you will get an electricity bill every quarter – and if it’s low enough, you’ll be happy.
Figure 6.7 is an example of a good way to present the difference between your bills ‘before’ and ‘after’.
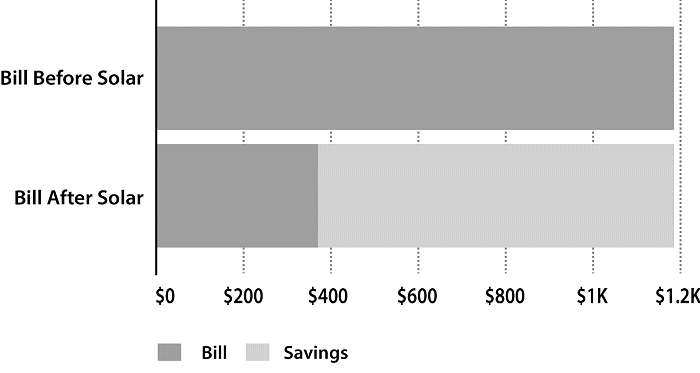
Figure 6.7 A good quote shows your projected bill reduction.
Energy graph: The final thing that’s nice to see on a well-presented solar quote is a graph of your solar production and usage. They’ll need to have estimated or measured your hourly energy-use profile to create this graph, and it gives you a good feel for how the solar power system will work with your usage.
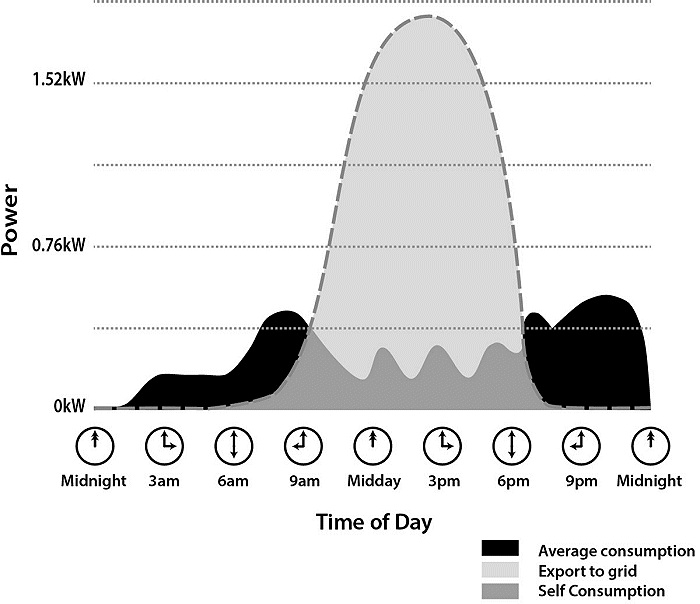
Figure 6.8 Projected solar production and household consumption over a winter’s day.
On this graph (for a winter’s day), we can see how the solar system easily covers the average load of the house. It will cope with small spikes in demand and have plenty of energy to charge a battery in the future.
The black area shows grid imports; the light-grey area shows grid exports. Because the light-grey area is bigger than the black area, you can be confident that this system will provide enough energy on a typical winter’s day to charge a battery that will cover your night-time consumption.
If you’re buying batteries, an energy graph like this is essential to show you how your batteries will work, so you can be confident that you are getting batteries of an appropriate size.
Figure 6.9 is an energy graph from a quote for solar and batteries.
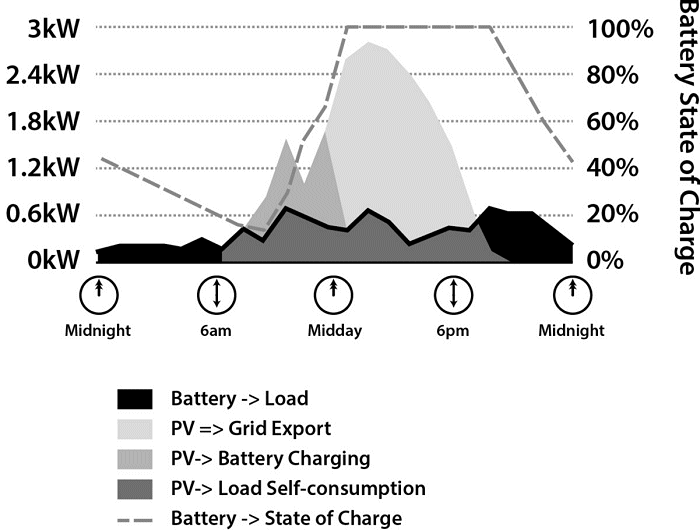
Figure 6.9 A day’s projected generation and consumption for solar and batteries.
This graph assumes a well-sized battery. It charges in the morning (pale grey) by midday in summer – which means it should charge fully through winter. The black sections show that the battery powers the home through the night. The dashed line shows that you use most of the battery capacity, as it discharges to about 10% in the morning. That means you haven’t wasted money on battery capacity you won’t use.
← Site Inspection | The Good Solar Guide Contents | Terms & Conditions →
Questions or feedback about the content on this page? Contact me.