“Before and after” electricity bills – see the real difference solar panels can make
By Finn Peacock – Chartered Electrical Engineer, Ex-CSIRO & Founder of SolarQuotes
Last Updated: 13th Dec 2023
You’ve probably seen a lot of ads online, on the telly, and in the paper spruiking solar.
Many of these ads promise the “electricity bill-busting” potential of solar panels for your home. The heavy-handed salesmanship in these ads probably triggers your BS-detector!
This is frustrating for me because well designed solar really can give you tiny electricity bills! As an example – my latest (autumn) bill came with a $38 credit.
I’ve even created a nifty solar calculator here that can estimate your bills after installing solar panels.
But – I know that even a tool like that will leave people sceptical.
So – I went and asked my website visitors to share the real impact solar energy had on their bills. Then I compared it with my calculator’s prediction of their electricity bills. The results that came back were amazing.
I want to use this real-world proof to refute two objections I hear over and over again:
1) “Solar isn’t worth it without batteries!”
2) “Solar isn’t worth it because I’m not home during the day!”
So read on, and see how much people have really saved with solar power – and how much you can too.
A note – the bills provided by my customers have had any personally identifiable information removed. I’ve also included my solar calculator’s prediction of their electricity bill vs what they got in reality – so you can judge its accuracy for yourself.
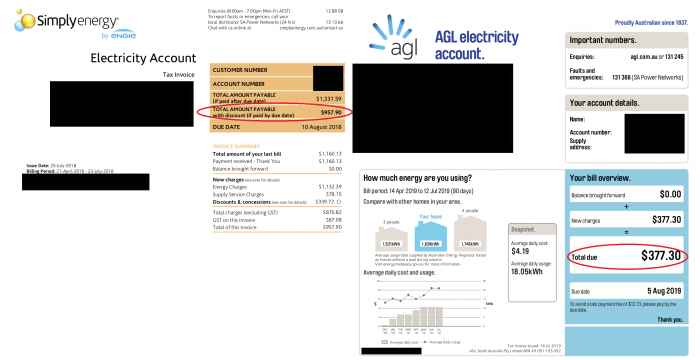
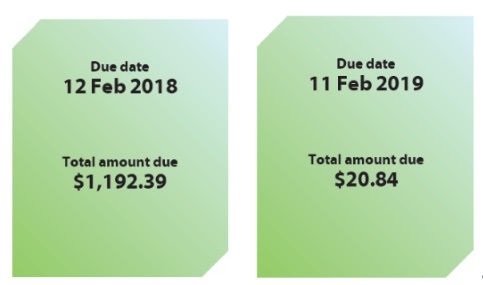
Example #1 – Phil in SA – Autumn/winter bills of $957 reduced to $377, using a 10.8 kW system with NO battery.
Winter 2018 bills (no solar) on left, winter 2019 bills (with solar) on right – a $580 reduction!
Located in: South Australia
System size: 10.8 kW
Battery: No
Feed in tariff: 10c/kWh with Simply Energy, 20c/kWh after switching to AGL
Year-on-year bill reduction for the quarter: $580
Phil has a 3 phase property in South Australia, and put on a 10.8 kW solar system – without batteries. This bill is a great example of why I tell people to put on as much solar panel capacity as they can.
I’ll point out that they switched from Simply Energy to AGL after installing a solar power system to take advantage of a better overall electricity plan (with higher feed in tariffs) offered by AGL.
Just by switching retailers, they went from a 10c/kWh feed in tariff with Simply Energy to a 20c/kWh feed in tariff – increasing their savings and accelerating their payback period.
You’ll always get the lowest savings from your system in winter. This is because you have less sunlight during the daytime overall, as well as many more cloudy/overcast days compared to summer.
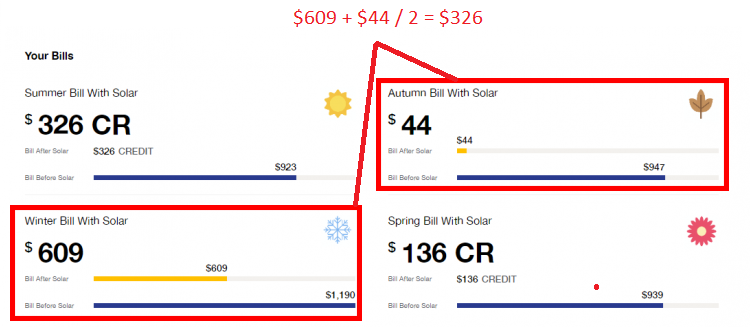
To compare the real result this homeowner had with my calculator. My calculator gives bills by season. Phil’s bill was half winter, half autumn – it predicted an average electricity bill for this period, post-solar, of ($609 + $44) divided by 2 = $326.50
His billing period was midway between autumn and winter – so the average of those two bills in the calculator is approx $326
So – his real result and my calculator’s predicted result were pretty damn close!
For the data nerds among you – let’s do a deep-dive into the details of his electricity bill – I’ll show you something interesting:
Click here for deep-dive >
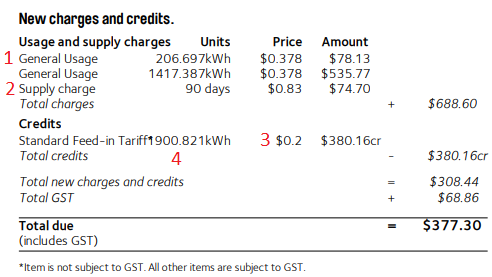
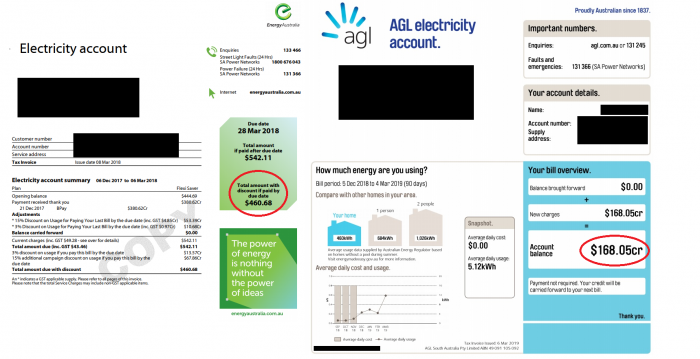
These are the hard numbers of his bill – showing his usage and solar exports
Don’t let your eyes glaze over with all these numbers – it’s quite simple to read.
“General usage” (1) refers to electricity that the homeowner needed to buy from the grid. $613.90 worth, to be precise.
“Supply charge” (2) is the daily charge from AGL for simply having his house connected to the grid. This cost him $0.83 per day, and $74.70 total for the billing period.
“Credits – standard Feed-In Tariff” (3) shows the amount of solar energy he exported to the grid, the amount he’s paid as a feed-in tariff ($0.20 per kWh) along with the money he made from this (which was added as a credit to his electricity bill) – $380.16.
Now – what we want to work out from this bill snapshot is – how much of the total solar energy generation was this homeowner self-consuming, and how much electricity was he exporting to the grid?
This is where it gets slightly more involved. If the homeowner had consumption monitoring, it would have been really easy to generate a report with this information.
But sit back – I’ll do the work for you.
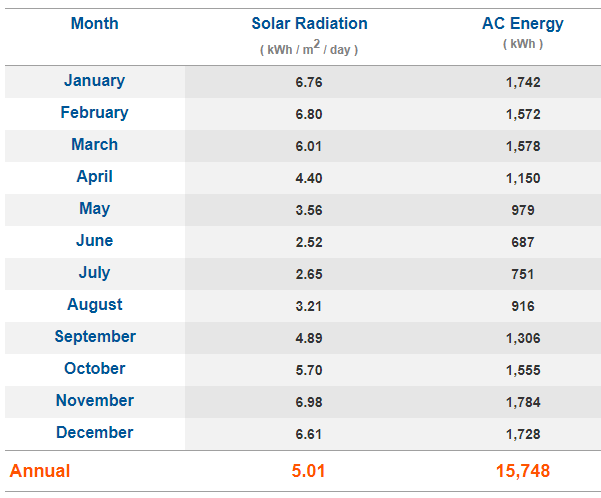
First – we know he has a 10.8 kW system. I know his exact location from his electricity bill – so I’ve input that into a solar energy calculator called PVWatts to estimate what his system should have given him in the billing period.
Then – I get this nifty result:
The PVWatts output for this homeowner
The billing period is between April and July. Adding the “AC energy” numbers together from the image above for those months – I get 2,616 kWh expected generation.
Let’s go back and compare that to the figures on his bill. It showed solar electricity exports of 1,900 kWh (4 on the image above) – that’s solar energy exported to the grid for a feed-in tariff.
Now – when a solar power system generates electricity, and you don’t have a battery, a decision is made by your home in real time:
1) If something in the home needs energy, the solar system will supply the energy to whatever needs it.
If not enough solar energy is being generated to cover this demand – the grid will top up the rest.
2) If more solar power is being produced than is needed in the home – the rest of the energy is exported to the grid.
So, if the homeowner generated around 2,616 kWh for the billing period, and exported 1,900 kWh to the grid – that means the remaining 700 kWh of electricity was self-consumed in the home.
In other words, he exported 73% of his solar electricity generation, with 27% self-consumed in the home.
That kind of self-consumption percentage suggests to me the homeowner doesn’t have people during the home on weekdays – in other words, they’re a ‘9-to-5’er.
Those numbers above also tell me that his electricity bill would have been $646 higher if he didn’t have solar panels installed. That’s a big chunk of change!
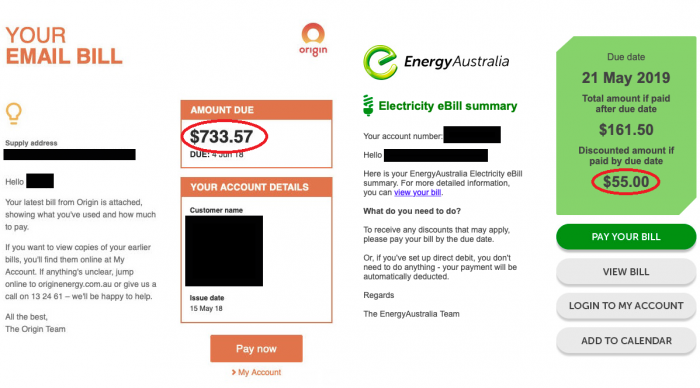
Example #2 – Shane from QLD – Late autumn/early winter bills of $733 reduced to $55
Autumn/winter 2018 bills on left, autumn/winter 2019 bills (after solar) on right.
Located in: Queensland
System size: 9.3 kW
Battery: No
Feed in tariff: 18c/kWh with Energy Australia
Year-on-year bill reduction for the quarter: $678
Click here for analysis >>
We’re starting to build a common theme here – larger solar power systems = big electricity bill reductions. Again – this is why I recommend installing as much solar as you can.
In this instance, we have a Queensland homeowner install a 9.3 kW system, switch to a retailer that offered a good feed-in tariff, and get a $678 quarterly bill reduction as a result.
Again – this is for an autumn/winter bill. This means $678 is the least this person will save per quarter.
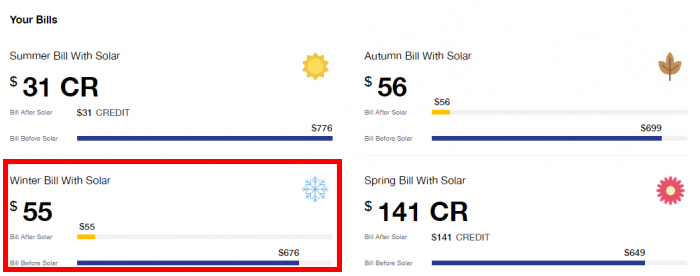
Popping the numbers from their electricity bill into my calculator gives the following prediction:
A predicted autumn/winter bill of $55 – compared to their real result of $55! Another win for my calculator!
As you can see – My solar calculator predicted his bill would be $55 for the autumn/winter period. Bang on what his electricity bill actually was – $55.
They should also be expecting a nice credit on their bill in the summer/spring quarters.
Now – let’s take a look at a ‘best-case’ (summer) quarterly savings example to contrast…
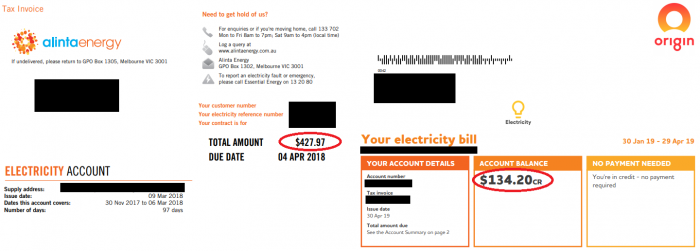
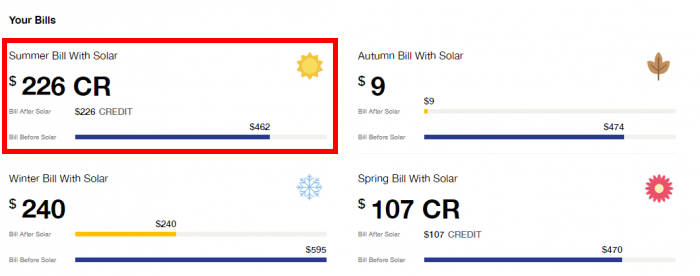
Example #3 – George from NSW – Late summer bills (hello aircon!) of $427, turned into a $134 credit!
Left – summer 2018 bill. Right – summer 2019 bill (after solar)
Located in: New South Wales
System size: 6.6 kW
Battery: No
Feed in tariff: 20c/kWh with Origin
Year-on-year bill reduction for the quarter: $571
Click here for analysis >>
To contrast with the two previous (winter-time) electricity bills, here’s a late summer/early autumn bill from a New South Wales homeowner.
They had a 6.6 kW solar system installed – which is smaller than the previous two examples – but this is a much more typical size for a system nowadays, especially for single-phase homes that are generally limited to 5 kW inverter capacity.
Even with this “smaller” system – they managed to take their summer electricity bills from $427 to a $134 credit. Not too shabby!
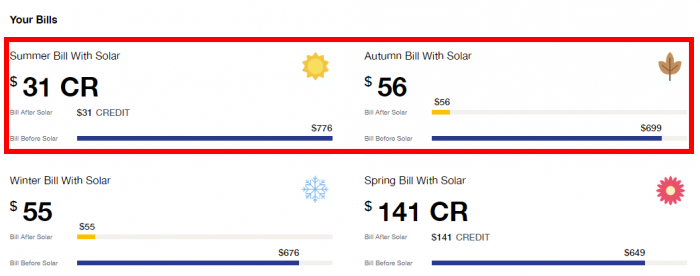
Let’s take a peek at what my calculator predicted their bills to be for the rest of the year:
The bill was between summer and autumn – the median of the two is around $180, so my calculator was off by around $50 in this instance
What a result! If their energy usage habits stay consistent, they may never actually need to pay an electricity bill again!
Example #4 – Henry from Adelaide turns a $460 summer bill into a $168 credit
Summer 2018 (left) compared to summer 2019 (right)
Located in: South Australia
System size: 6 kW
Battery: No
Feed in tariff: 16.3c/kWh with AGL
Year-on-year bill reduction for the quarter: $628
Click here for analysis >>
Another example of a summer electricity bill reduction with a “smaller” 6.6 kW system.
While summer is the period in which you’ll save the most with solar panels, it’s also the period that tends to be the most expensive for households as they blast the air-conditioning all day long.
Let’s plug their numbers into my calculator and see what kind of bills they can expect for other seasons…
Predicted vs actual bills are off a bit again – but this can easily be explained by variance in self-consumption figures
In this instance, their electricity bill will creep up to $240 in winter – but as the calculator shows, it would be double that without solar panels!
Finally – let’s take a look at a system that has solar panels AND a battery…
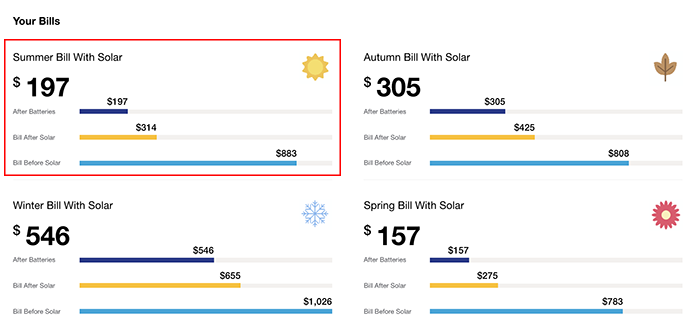
Example #5 – David from NSW saves $1,171 in a quarter after installing solar + battery. But how much did the battery contribute to the savings?
Located in: New South Wales
System size: 6.7 kW
Battery: Yes – 10kWh Sonnen battery
Feed in tariff: 12.5c/kWh with Energy Australia
Year-on-year bill reduction for the quarter: $1,171
Before and after summer bills, with a solar + battery system
Click here for analysis >>
I’m hoping the previous four examples of homeowners seeing awesome savings from solar power with no batteries would be enough to convince the battery fanatics that batteries, economically, just aren’t necessary if you want low bills.
To really drive the point home – I’ll use this electricity bill an example.
This home installed a 6.6 kW solar system with a 10kWh Sonnen battery. You can see above that their summer bills went down by a whopping $1,171.
A lot of the savings comes from their very high self-consumption ratio, meaning their house used a lot of energy during the daytime that their solar system offset.
But – digging into their data – I saw they were only cycling their battery 1.1 times per day, on average. Let’s do some simple maths to show how much the battery contributed to that $1,171 saving:
Cycling a 10kWh battery 1.1 times will get you 11kWh of energy per day. This home is paying 25c per kWh for grid electricity.
So – 11 kWh of battery energy used per day means that they haven’t had to buy 11 kWh from the grid. 11 X 25c = $2.75.
This means the battery saved them $2.75 per day, right?
Wrong! This is because when you have excess solar energy and store it in your battery, you’re choosing not to sell it to the grid for a feed-in tariff.
Meaning – you need to subtract the feed-in tariff from the cost of grid electricity to get the true savings from a battery.
So, the real saving is 25c (grid electricity cost) minus 12.5c (feed in tariff) multiplied by 11 (kWh) = $1.40. This is what the Sonnen battery actually saved this household per day – $1.40. Or – $123 for a 90-day period.
With a bill saving of $1,171, the Sonnen’s saving of $123 is only a measly 11% of this electricity bill. All the rest of the savings were from solar power!
My calculator shows the breakdown visually:
Note the “Bill after solar” and “After batteries” breakdown.
A 10kWh Sonnen battery will cost you approximately $16,000 fully installed. So with a saving of $123 a quarter – or $492 per year – you’re looking at a simple payback of over 20 years for the battery system!
In summary
All of the electricity bills listed on this page are for solar-only systems with NO batteries, except for example #5.
All of these households – except #5 – had a self-consumption ratio of 30% or below, which is what I’d expect the typical 9-to-5 household to have.
I hope this evidence from real homeowners has proven, once and for all, that solar power really is worth it – without batteries, and without needing you to be home during the week.
If you’re considering installing solar panels for your home or business, SolarQuotes can help you get quotes from high-quality installers quickly and easily:
I’m a Chartered Electrical Engineer, solar and energy efficiency nut, electric car and e-bike owner, dad, and founder of SolarQuotes.com.au. My last “real job” was working for the CSIRO in their renewable energy division. Since 2009 more than 785,000 Australians have used my site to get quotes for high quality PV systems from pre-vetted solar installers.