Which Direction Should My Solar Panels Face?
Last Updated: 20th Oct 2026 by Finn Peacock, Chartered Electrical Engineer, Fact-Checked by Ronald Brakels
In Australia, solar panels facing north generate the most electricity over a year. However, producing the most electricity does not always mean it’s the most useful for your needs.
If nobody’s home at lunchtime, a big midday peak mostly flows into the grid for a few cents. East and west-facing panels make more of their power in the morning and late afternoon, when you’re more likely to be home to use it.
So, which direction is best for your solar panels? The best direction for saving money depends on when your household uses electricity.
- Fill Your Roof First
- How Much Each Compass Direction Produces
- What Each Direction Is Good For
- Best Solar Panel Direction In Each City
- Your Roof Pitch Changes How Much Direction Matters
- Best Solar Panel Pitch In Each City
- Got A Flat Roof? Consider East-West Tilts
- Why The Time Of Day Matters More Than It Used To
- Batteries, EVs, And Panel Direction
- Shade Matters More Than Direction
- What To Do Next
Fill Your Roof First
Before worrying too much about direction, here is our usual advice: if your budget allows, cover every unshaded part of your roof that faces north, east, or west, and think about using the south side too.
Solar panels themselves are inexpensive compared to the cost of labour and scaffolding for installation, so adding extra panels often costs less than you might think. If your roof is tricky, adding more panels is usually a better solution than worrying about direction.
Your electricity use will probably increase over time. The federal battery rebate has made home batteries more common, and getting an electric vehicle or switching from gas to electric appliances can add a lot of demand. Filling your roof with panels helps you prepare for all of this.
If your budget, roof space, or local electricity network limits how many panels you can install, then the direction of your panels becomes more important.
How Much Each Compass Direction Produces
On average, each kilowatt (kW) of north-facing solar panels in Sydney produces about 3.9 kilowatt-hours (kWh) of electricity per day over a year. If you turn the panels away from north, the output drops, but not as much as you might think.
Here’s are some percentages for what a 10 kW system, an average size for Australian homes, produces in Sydney, depending on which way it faces:
| Which way the panels face | Yearly output compared with north |
| North | 100% |
| North-east or north-west | 96% |
| East or west | 85% |
| East-west split | 85% |
| South | 66% |
These are ballpark yearly averages for a typical roof pitched at 20-25°. Steeper roofs widen the gap.
A 10 kW north facing system in Sydney will generate a daily average of 41 kWh. But if all the panels faced south, the daily average would still be 27 kWh. As long as your panels are not shaded, every direction is still worthwhile.
Across most of Australia, the sun passes through the northern sky at midday all year, but the seasons change how high it climbs and how long it shines on your panels. Panels make the most power when sunlight hits them square-on, and the high summer sun lights up almost any roof face. The low winter sun favours north-facing panels.
In Sydney, the midsummer sun reaches about 80° above the horizon at midday and stays up for more than 14 hours. In midwinter, the sun peaks at just 33°, stays in the northern sky all day and sets after less than 10 hours. You will get more electricity on a summer day and less in winter.
Your location also matters in relation to the equator. A kilowatt of well-placed panels averages about 4.2 kWh per day in Brisbane, but only about 3.6 kWh in Melbourne because the sun is lower in the sky.
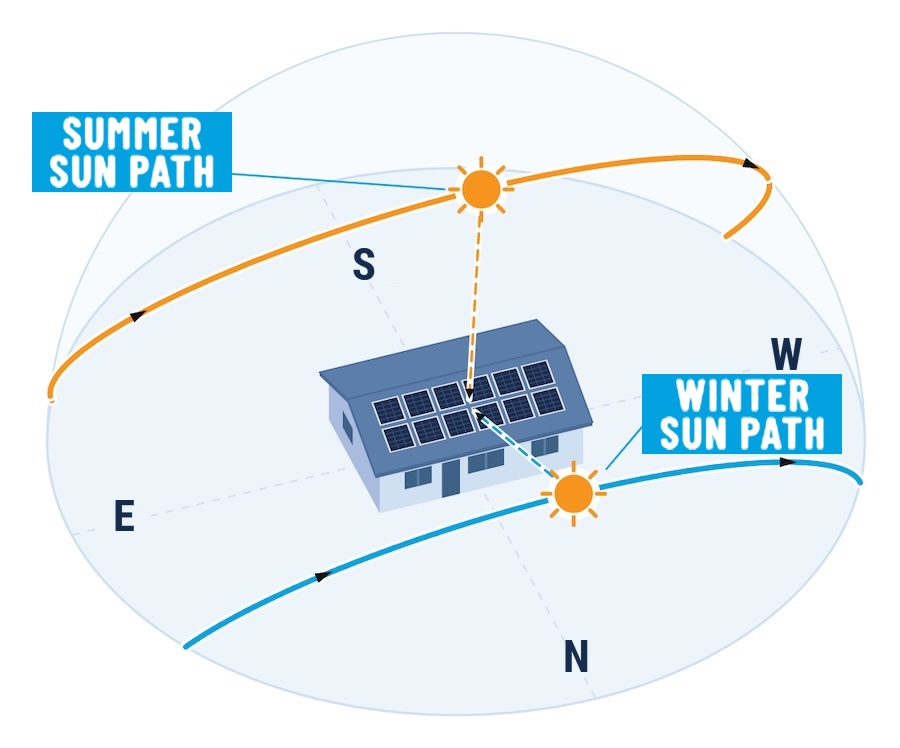
The summer sun shines more directly on the panels than in the winter.
To find out how much electricity panels on your roof could produce, enter your postcode, panel direction, and roof angle into our solar calculator.
Which Panel Direction Suits Your Household?
North: This direction produces the most electricity over a year, with a peak around midday. It is best for households where people are home during the day, or can run appliances like hot water systems, pool pumps, clothes dryers and dish washers during the middle of the day. It also suits those who can charge an EV during the day or who want to maximise generation to charge a home battery.
West: The output peaks an hour or so after noon and remains useful into the late afternoon. This suits households where people are out during the day, homes with high summer air conditioning use, and anyone who gets paid more for exporting electricity in the afternoon.
East: Produces more electricity in the morning and less in the afternoon. This is good for households with high morning use, like electric heating in winter, or for people who are out later in the day, shift workers for instance.
North-west and north-east: These are a good all-round option for many households.
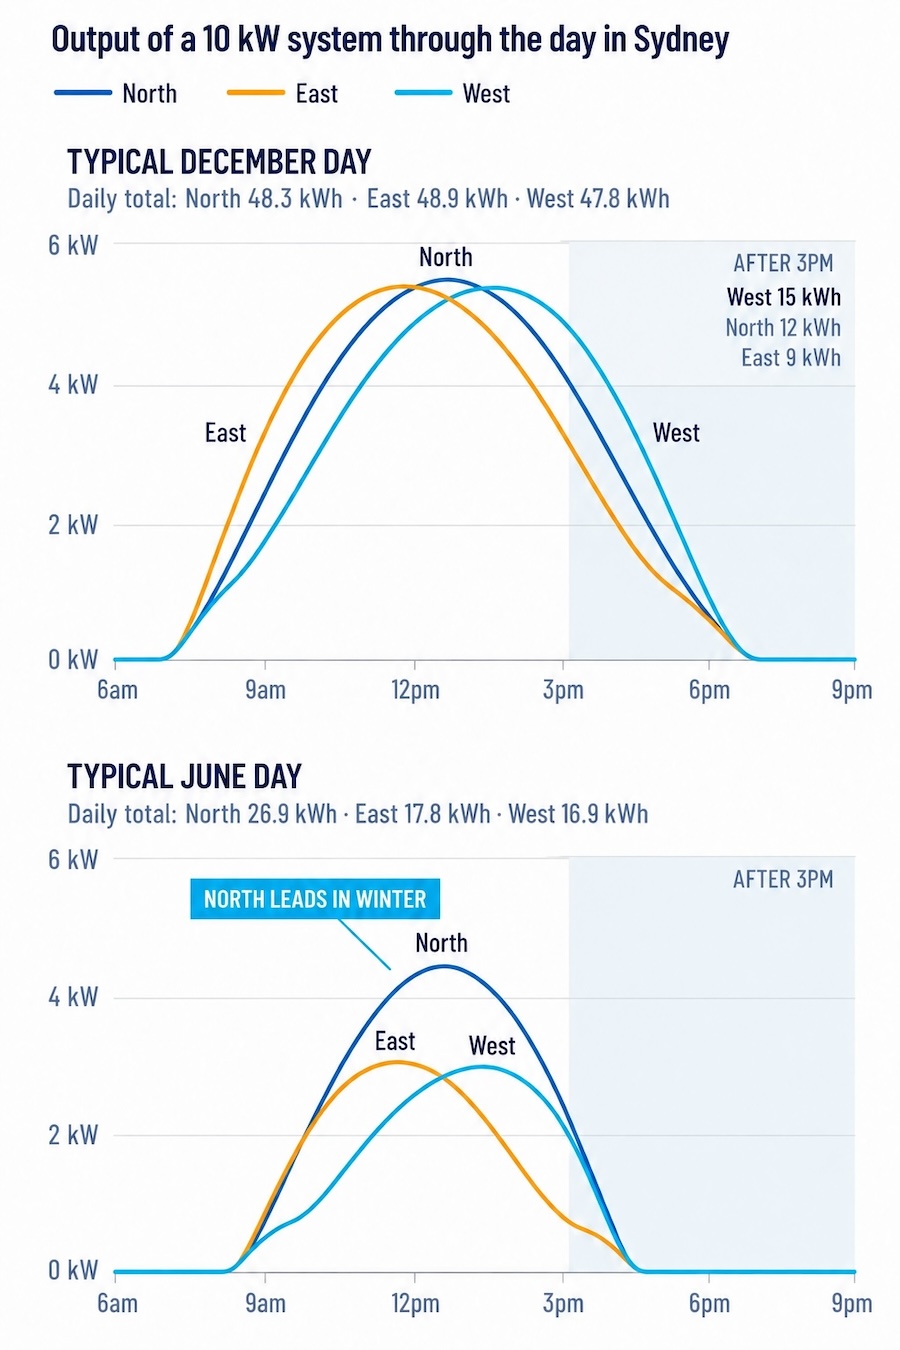
In summer, east and west compete with north. In winter, north pulls ahead.
East and West split: Placing panels on both sides spreads electricity generation throughout the day. This can increase self-consumption for households that are home in the morning and afternoon. The steeper your roof, the more separated the two peaks are, and the wider the combined output.
South: This is the least productive direction, but it is usually still worthwhile once you have filled the better roof faces. South-facing panels perform much better in summer than in winter. However, in most capital cities, their winter output is less than half of what north-facing panels produce.
Best Solar Panel Direction In Each City
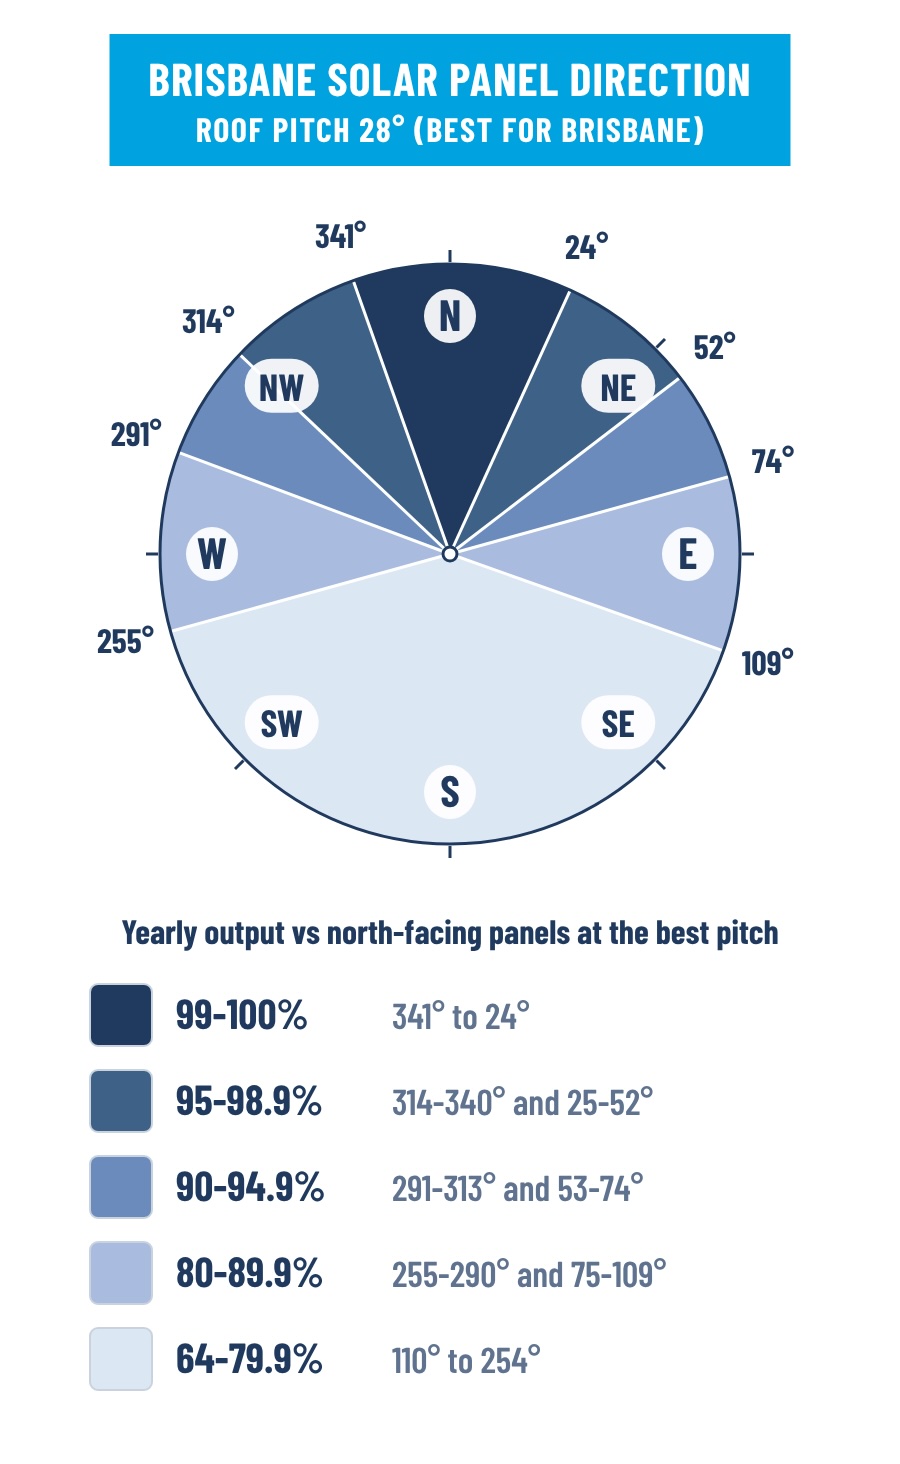
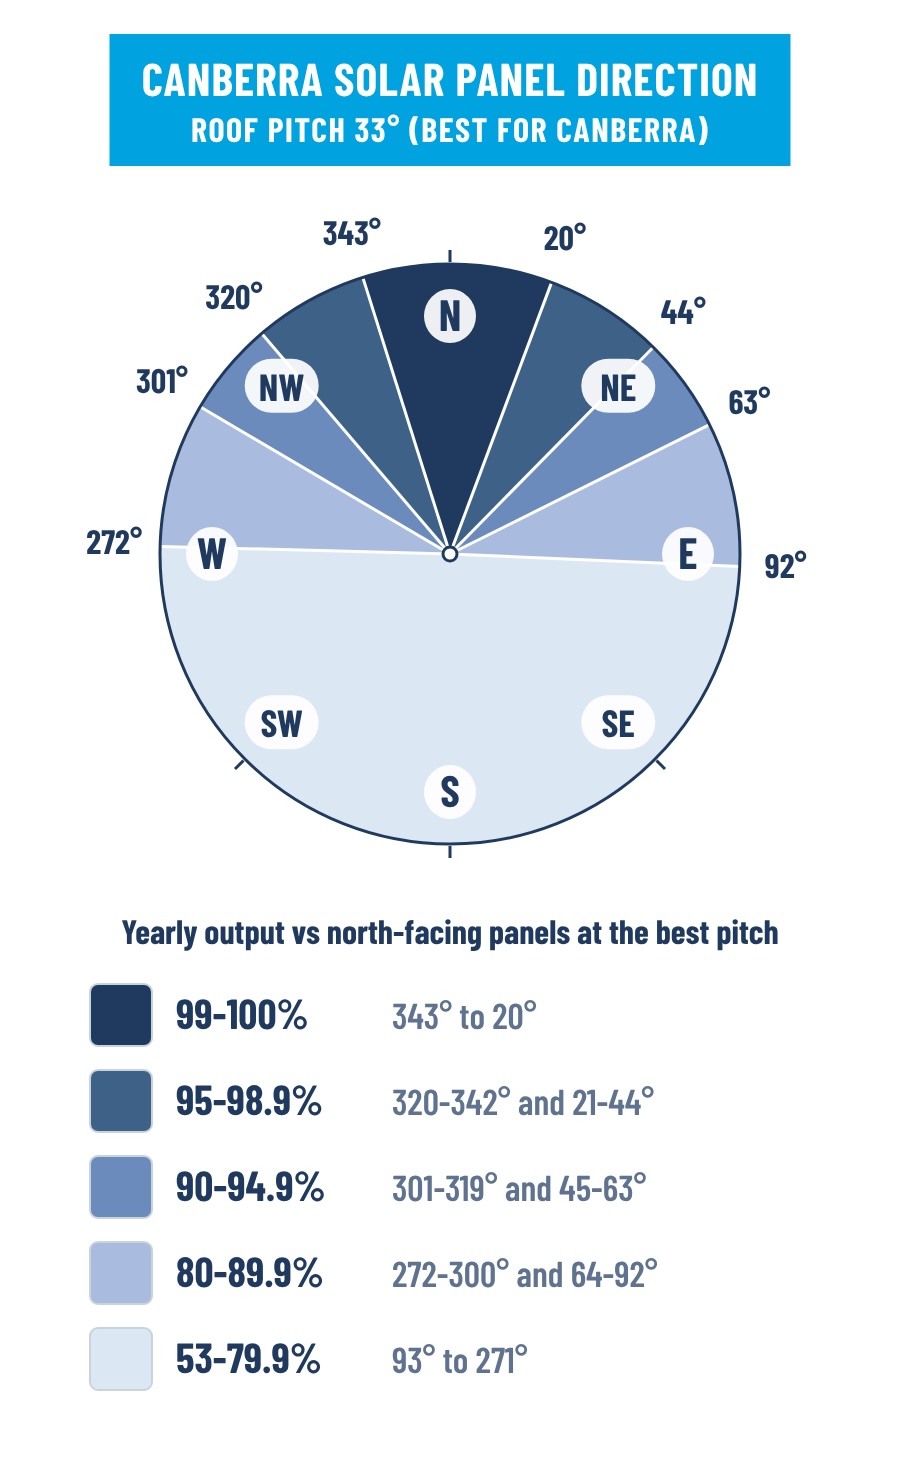
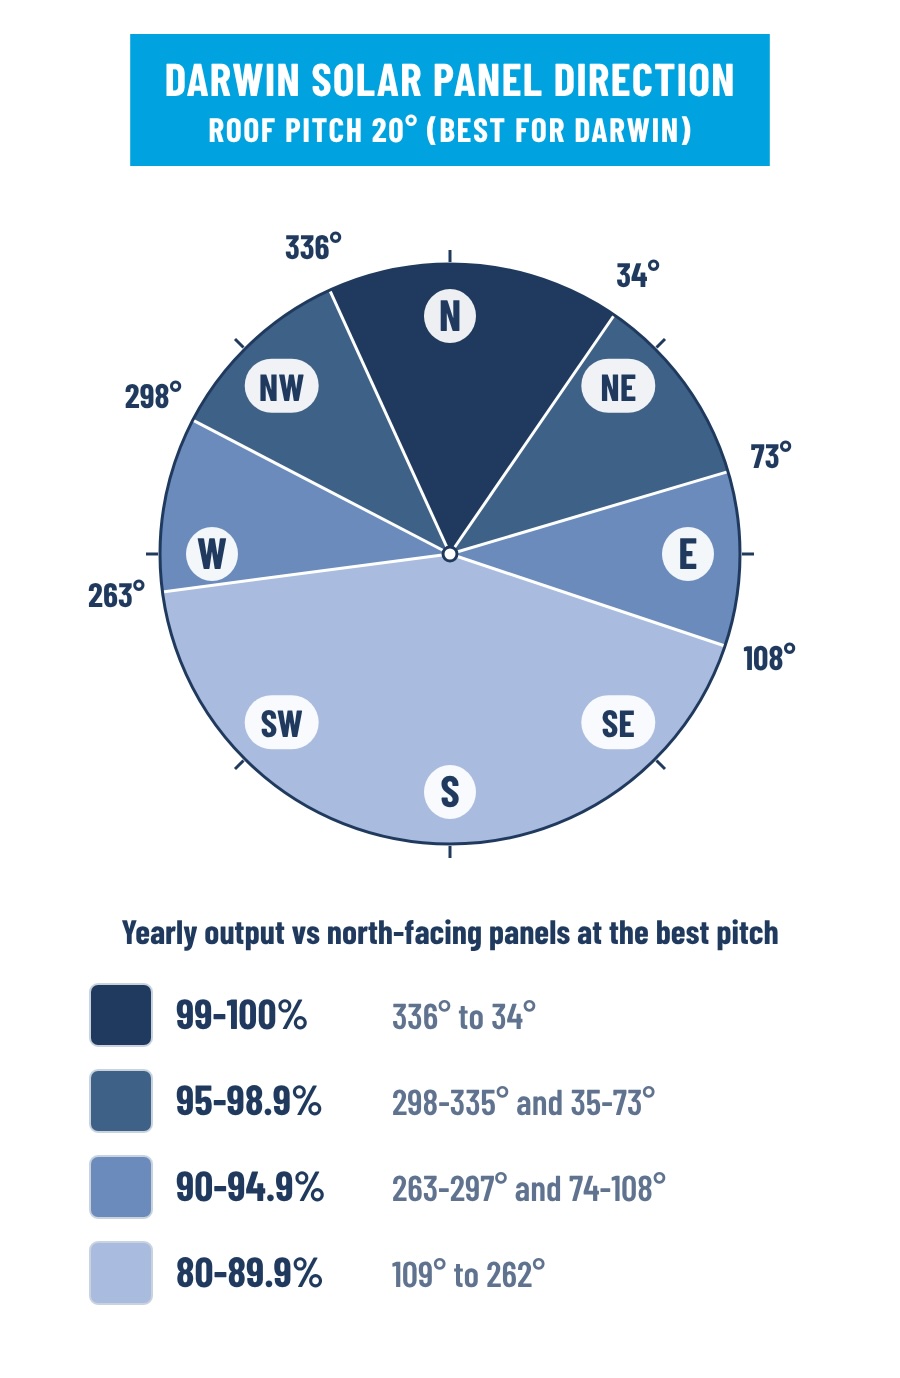
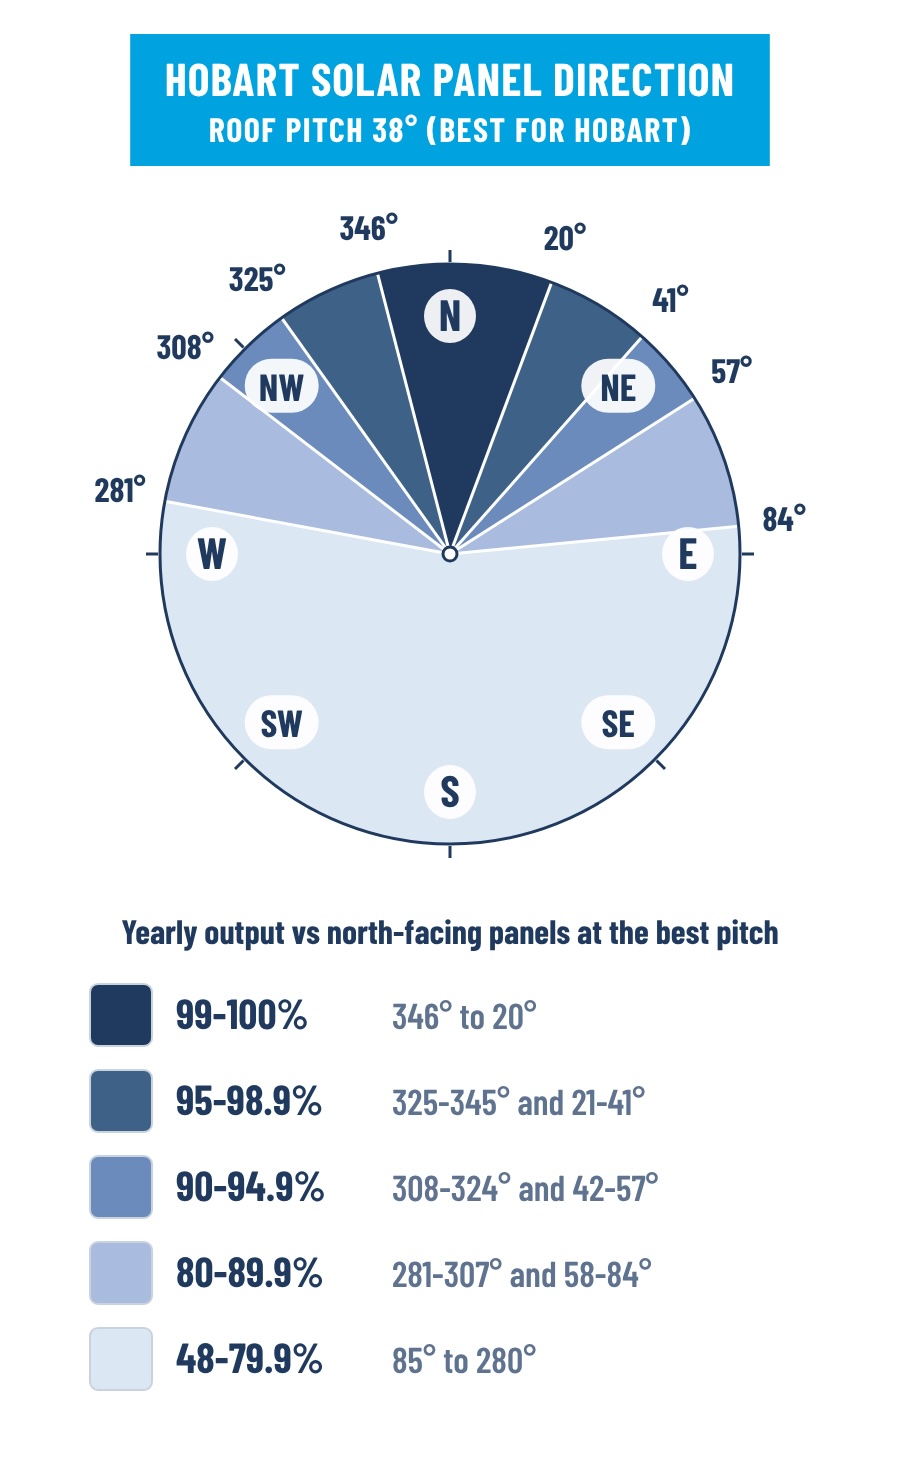
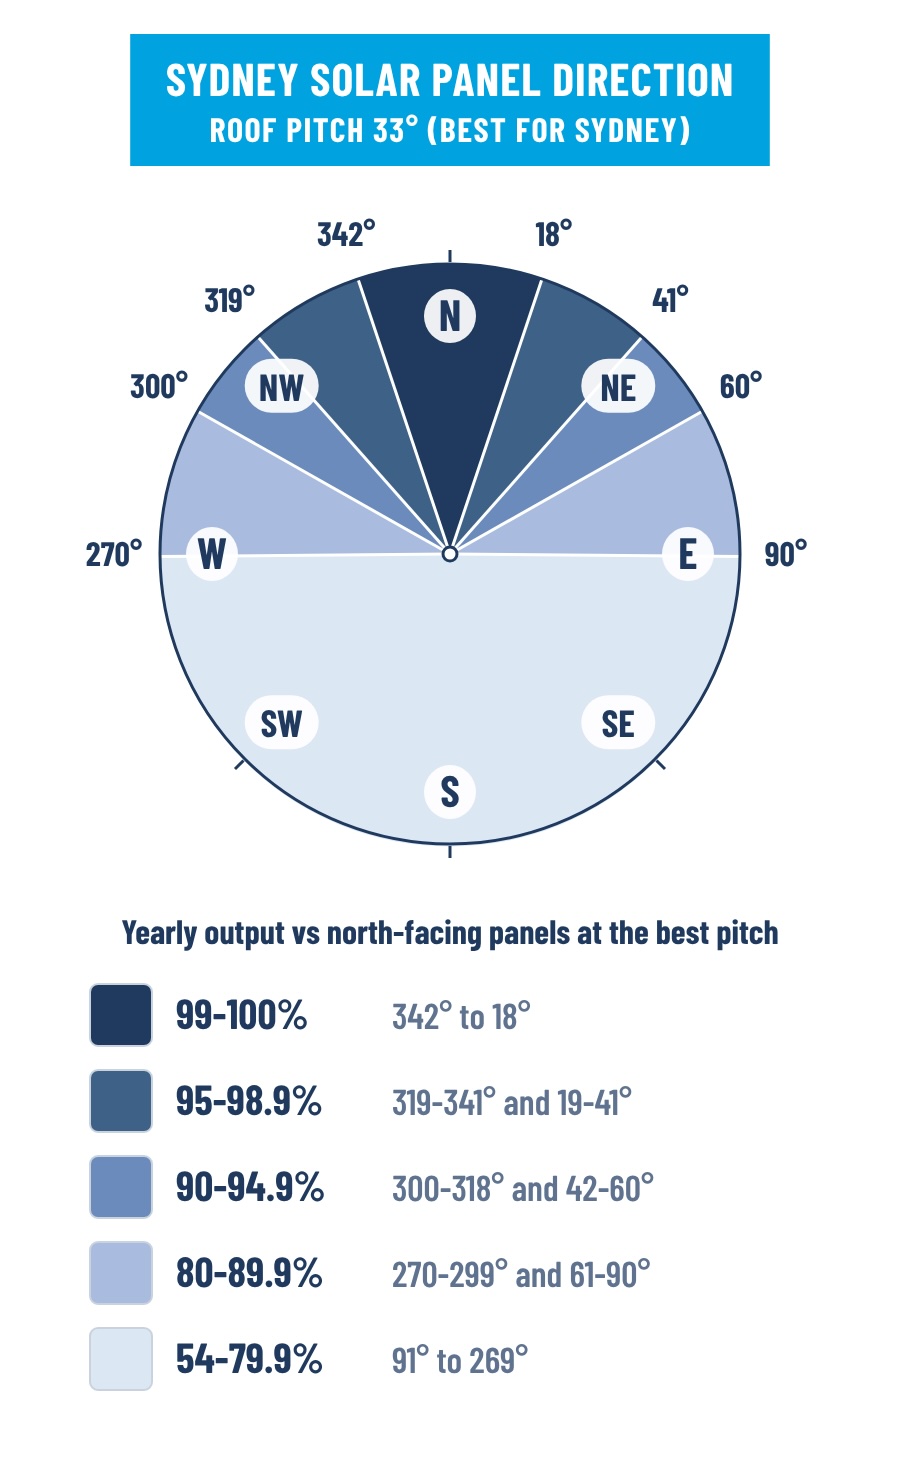
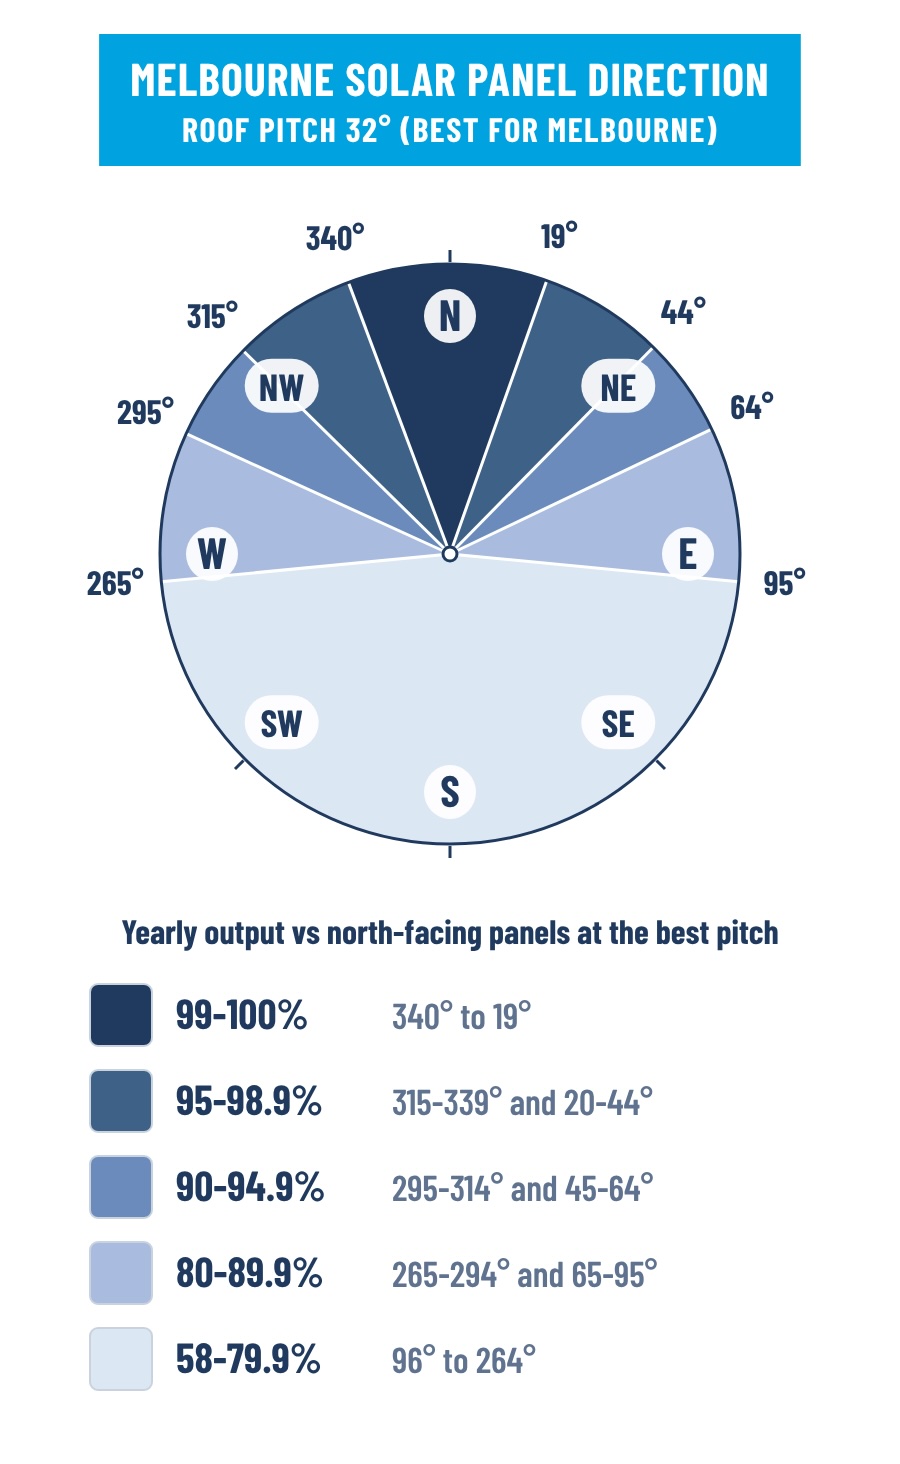
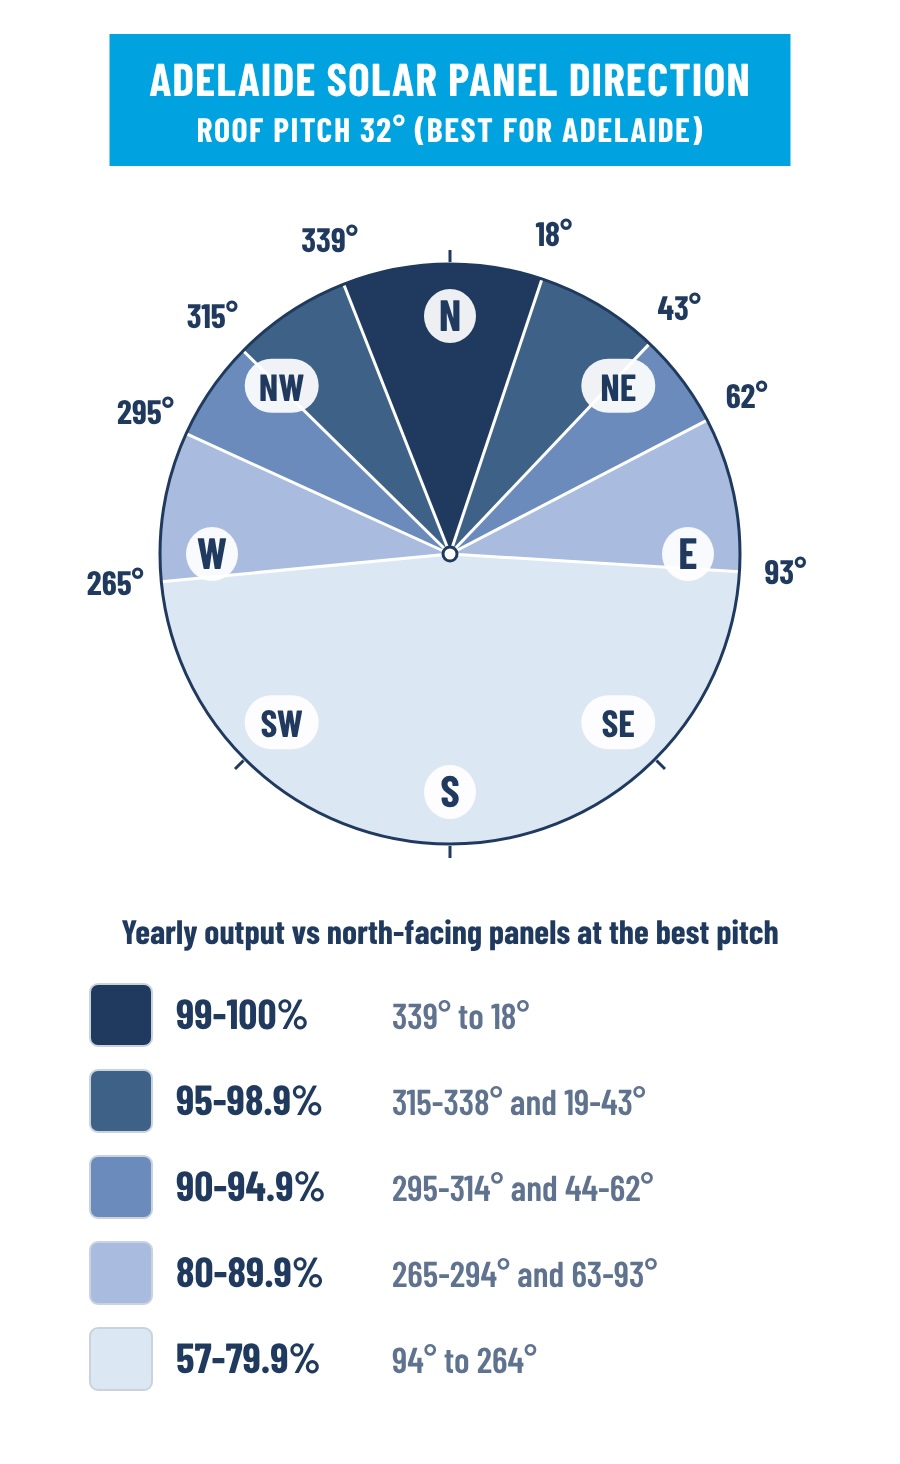
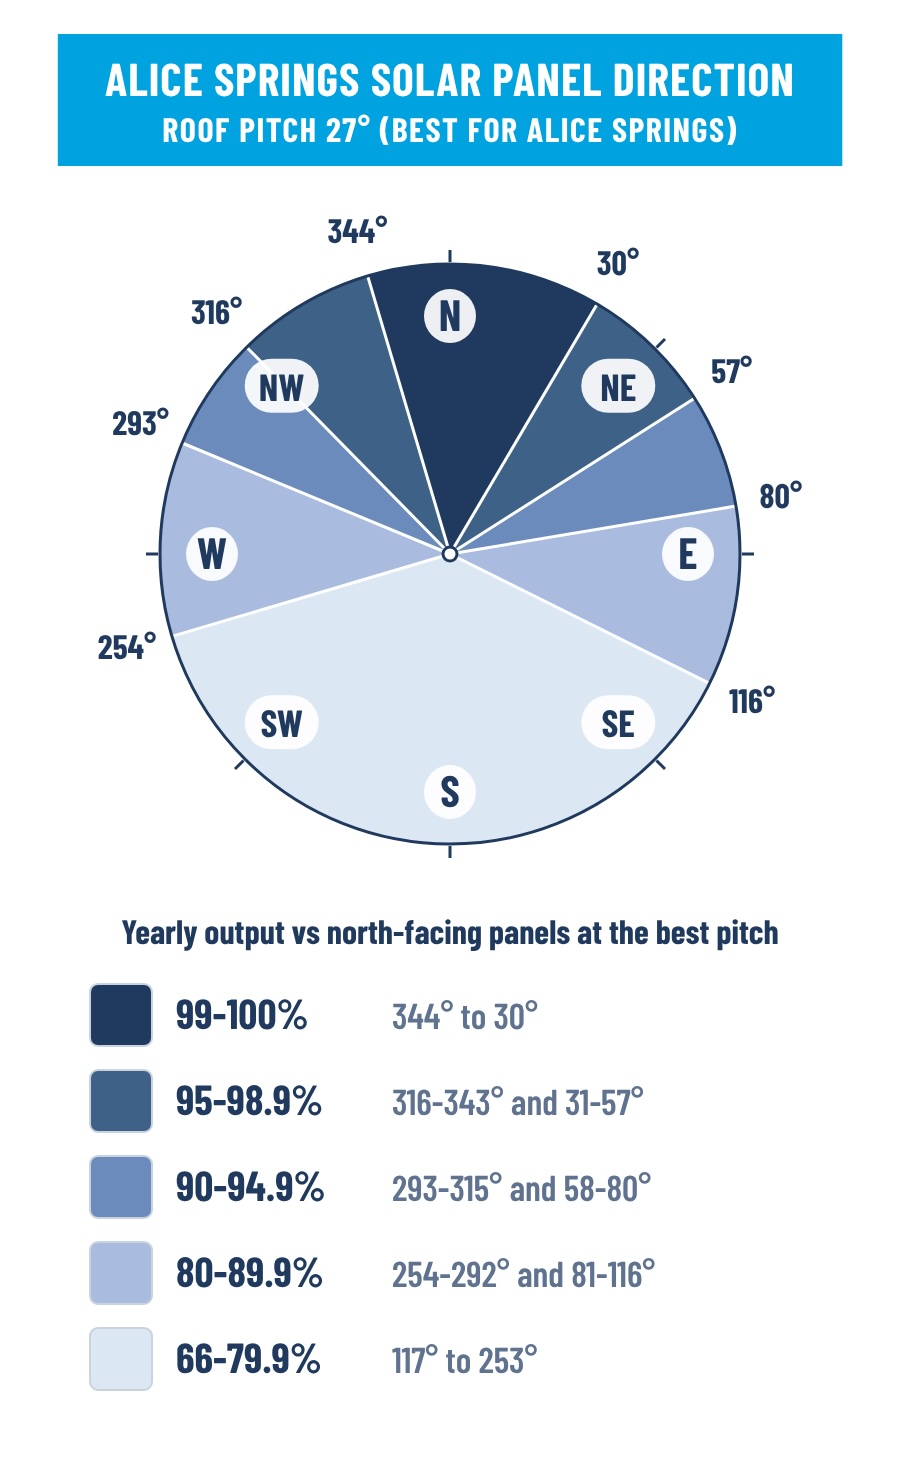
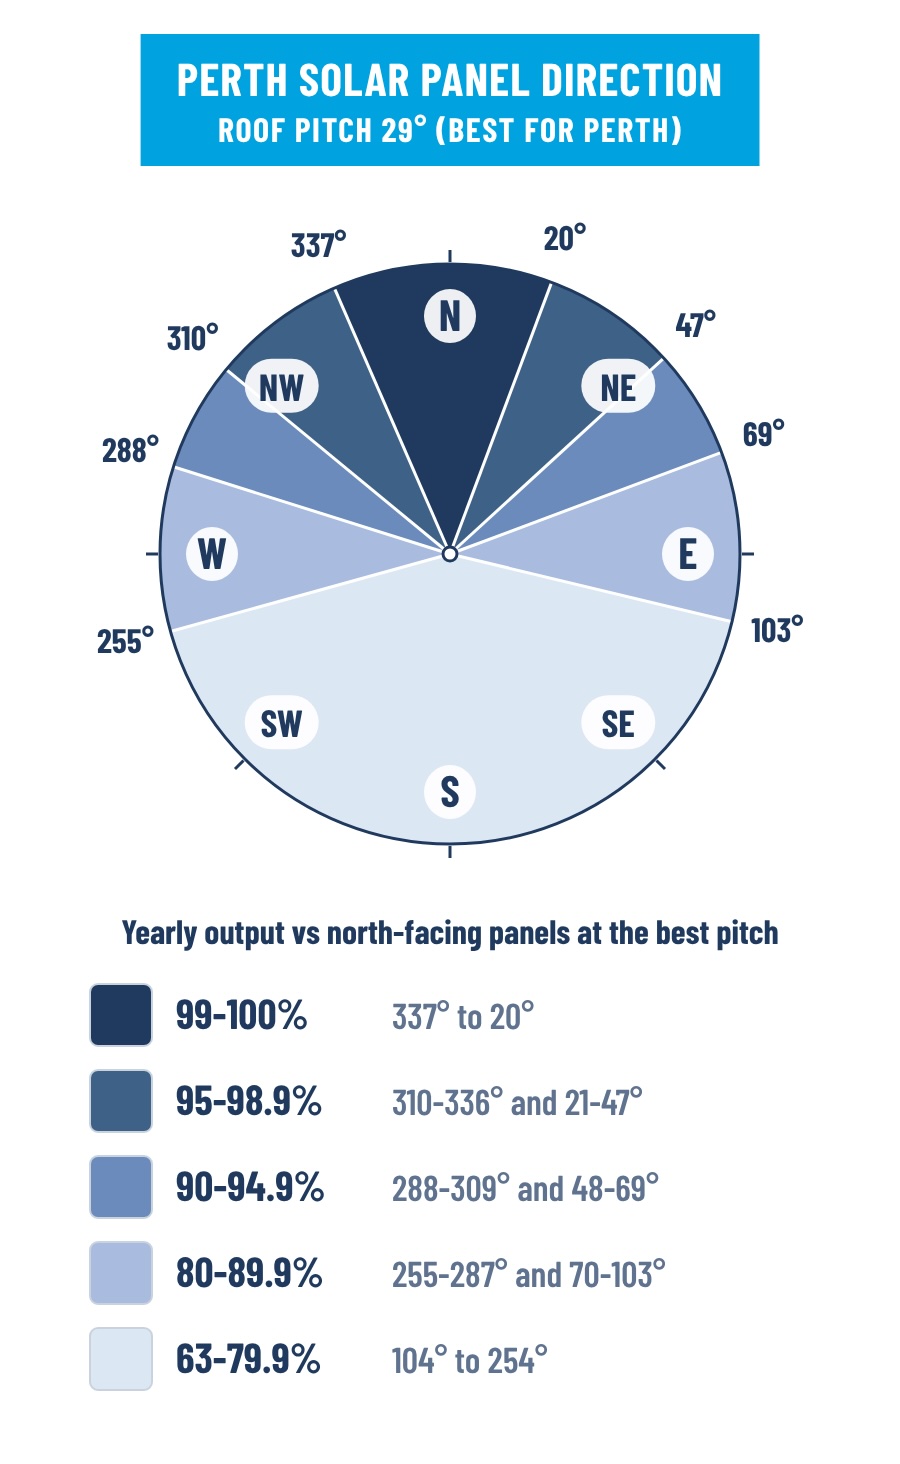
This table shows how much energy you can expect from nearly any combination of direction, compared to the ideal for your city. Direction is measured as a compass bearing: 0° is north, 90° is east, 180° is south, and 270° is west.
Click a city below to see a compass showing the ideal panel direction there.
Your Roof Pitch Changes How Much Direction Matters
A panel that is completely flat does not face any direction. When you tilt it up, it starts to favour one part of the sky, so pointing it away from north reduces output more as the angle increases.
The numbers support this. On a gentle 15° roof, south-facing panels in Sydney still produce about 78% of what north-facing panels do because of the angle the sun shines on them. On steeper roofs, the difference becomes much larger.
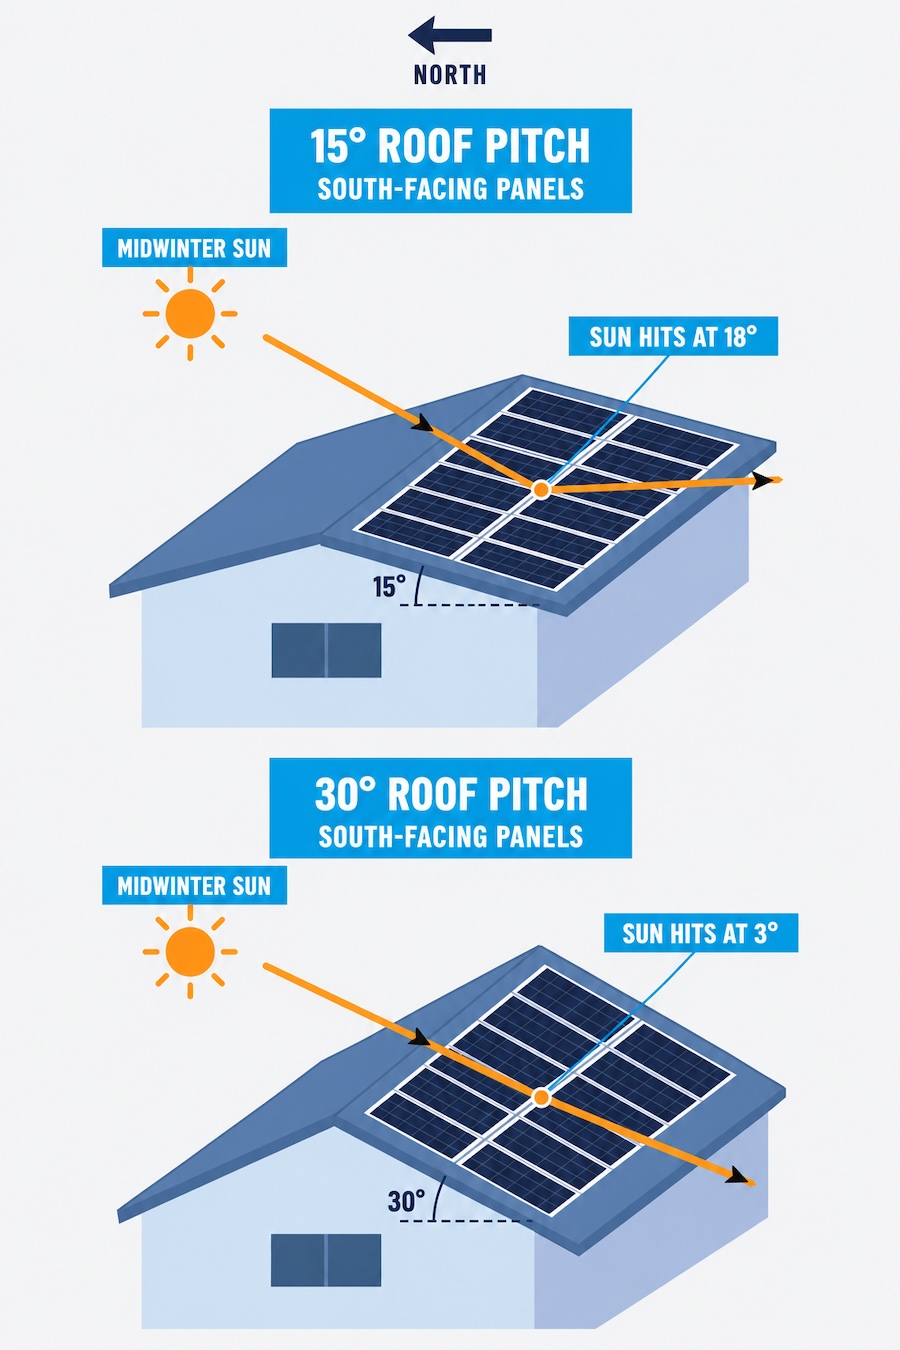
The steeper the pitch, the less solar power harnessed from the sun.
Steeper panels also increase the loss for east and west-facing panels.
A tilt that is 20° away from the ideal only reduces yearly output by about 5%. In most capital cities, the ideal tilt for yearly output is a few degrees below the local latitude, not exactly equal to it. On a pitched roof, mount the panels flush.
Best Solar Panel Pitch In Each City
Choose your city to compare panel direction and pitch. Each figure shows estimated annual electricity output as a percentage of the best orientation for that city. 100% means the most electricity over a year, not the greatest bill savings. Pitch is the panel’s angle from horizontal.
Brisbane: best annual output facing north at 28°
| Panel direction | Pitch (angle from horizontal) | ||||
|---|---|---|---|---|---|
| 10° | 15° | 22.5° | 28°Best pitch | 30° | |
| North | 96% | 98% | 99% | 100% | 99% |
| North-east | 94% | 95% | 96% | 96% | 96% |
| East | 90% | 89% | 87% | 86% | 85% |
| South-east | 85% | 82% | 76% | 72% | 71% |
| South | 83% | 78% | 70% | 64% | 62% |
| South-west | 84% | 81% | 76% | 71% | 70% |
| West | 89% | 88% | 86% | 84% | 84% |
| North-west | 94% | 95% | 96% | 95% | 95% |
Swipe the table sideways to see all pitches.
Canberra: best annual output facing north at 33°
| Panel direction | Pitch (angle from horizontal) | ||||
|---|---|---|---|---|---|
| 10° | 15° | 22.5° | 30° | 33°Best pitch | |
| North | 93% | 96% | 99% | 99% | 100% |
| North-east | 91% | 93% | 95% | 95% | 95% |
| East | 86% | 86% | 84% | 82% | 81% |
| South-east | 81% | 77% | 71% | 65% | 63% |
| South | 78% | 73% | 65% | 56% | 53% |
| South-west | 80% | 76% | 70% | 64% | 62% |
| West | 86% | 85% | 83% | 81% | 79% |
| North-west | 91% | 93% | 94% | 94% | 94% |
Swipe the table sideways to see all pitches.
Darwin: best annual output facing north at 20°
| Panel direction | Pitch (angle from horizontal) | ||||
|---|---|---|---|---|---|
| 10° | 15° | 20°Best pitch | 22.5° | 30° | |
| North | 99% | 99% | 100% | 99% | 99% |
| North-east | 98% | 98% | 98% | 98% | 96% |
| East | 95% | 94% | 93% | 92% | 89% |
| South-east | 91% | 89% | 86% | 84% | 79% |
| South | 90% | 86% | 82% | 80% | 73% |
| South-west | 91% | 88% | 85% | 83% | 77% |
| West | 94% | 93% | 91% | 90% | 87% |
| North-west | 97% | 97% | 97% | 97% | 95% |
Swipe the table sideways to see all pitches.
Hobart: best annual output facing north at 38°
| Panel direction | Pitch (angle from horizontal) | ||||
|---|---|---|---|---|---|
| 10° | 15° | 22.5° | 30° | 38°Best pitch | |
| North | 91% | 94% | 97% | 99% | 100% |
| North-east | 89% | 91% | 93% | 94% | 94% |
| East | 83% | 83% | 81% | 80% | 78% |
| South-east | 77% | 74% | 68% | 63% | 57% |
| South | 74% | 69% | 62% | 55% | 48% |
| South-west | 77% | 73% | 67% | 62% | 56% |
| West | 82% | 82% | 80% | 78% | 76% |
| North-west | 88% | 90% | 92% | 93% | 92% |
Swipe the table sideways to see all pitches.
Sydney: best annual output facing north at 33°
| Panel direction | Pitch (angle from horizontal) | ||||
|---|---|---|---|---|---|
| 10° | 15° | 22.5° | 30° | 33°Best pitch | |
| North | 93% | 96% | 99% | 99% | 100% |
| North-east | 91% | 93% | 94% | 94% | 94% |
| East | 86% | 85% | 84% | 81% | 80% |
| South-east | 81% | 77% | 71% | 65% | 63% |
| South | 78% | 73% | 65% | 57% | 54% |
| South-west | 81% | 77% | 71% | 65% | 63% |
| West | 86% | 85% | 84% | 81% | 80% |
| North-west | 91% | 93% | 94% | 94% | 94% |
Swipe the table sideways to see all pitches.
Melbourne: best annual output facing north at 32°
| Panel direction | Pitch (angle from horizontal) | ||||
|---|---|---|---|---|---|
| 10° | 15° | 22.5° | 30° | 32°Best pitch | |
| North | 94% | 96% | 99% | 99% | 100% |
| North-east | 92% | 94% | 95% | 95% | 95% |
| East | 87% | 86% | 85% | 82% | 82% |
| South-east | 82% | 79% | 73% | 67% | 65% |
| South | 80% | 75% | 67% | 60% | 58% |
| South-west | 82% | 79% | 73% | 67% | 66% |
| West | 87% | 87% | 85% | 83% | 82% |
| North-west | 92% | 94% | 95% | 95% | 95% |
Swipe the table sideways to see all pitches.
Adelaide: best annual output facing north at 32°
| Panel direction | Pitch (angle from horizontal) | ||||
|---|---|---|---|---|---|
| 10° | 15° | 22.5° | 30° | 32°Best pitch | |
| North | 94% | 96% | 99% | 99% | 100% |
| North-east | 92% | 93% | 95% | 95% | 95% |
| East | 87% | 86% | 84% | 82% | 81% |
| South-east | 82% | 78% | 72% | 66% | 65% |
| South | 79% | 75% | 67% | 59% | 57% |
| South-west | 82% | 78% | 73% | 67% | 65% |
| West | 87% | 86% | 85% | 83% | 82% |
| North-west | 92% | 94% | 95% | 95% | 95% |
Swipe the table sideways to see all pitches.
Alice Springs: best annual output facing north at 27°
| Panel direction | Pitch (angle from horizontal) | ||||
|---|---|---|---|---|---|
| 10° | 15° | 22.5° | 27°Best pitch | 30° | |
| North | 96% | 98% | 99% | 100% | 99% |
| North-east | 95% | 96% | 97% | 97% | 97% |
| East | 91% | 90% | 89% | 87% | 86% |
| South-east | 86% | 83% | 78% | 75% | 72% |
| South | 84% | 79% | 71% | 66% | 63% |
| South-west | 85% | 82% | 76% | 72% | 70% |
| West | 90% | 88% | 86% | 84% | 83% |
| North-west | 94% | 95% | 95% | 95% | 94% |
Swipe the table sideways to see all pitches.
Perth: best annual output facing north at 29°
| Panel direction | Pitch (angle from horizontal) | ||||
|---|---|---|---|---|---|
| 10° | 15° | 22.5° | 29°Best pitch | 30° | |
| North | 96% | 98% | 99% | 100% | 99% |
| North-east | 94% | 95% | 96% | 95% | 95% |
| East | 89% | 88% | 86% | 84% | 84% |
| South-east | 84% | 81% | 75% | 70% | 69% |
| South | 82% | 78% | 70% | 63% | 62% |
| South-west | 85% | 81% | 76% | 70% | 70% |
| West | 89% | 89% | 87% | 85% | 85% |
| North-west | 94% | 95% | 96% | 96% | 96% |
Swipe the table sideways to see all pitches.
How to read the figures: 85% means about 15% less annual electricity than the city’s best orientation. These percentages compare orientations within each city, not how much electricity different cities produce.
Source: PVWatts calculator (pvwatts.nlr.gov), modelled using a 10 kW system. Estimates are rounded to whole percentages; only the best orientation is shown as 100%.
This is why different sources give different numbers for the same direction. Most of them are correct; they are just using different roof pitches. Always check the roof angle behind any figure before relying on it.
Got A Flat Roof? Consider East-West Tilts
Panels on a flat roof should be tilted. If you lay them flat, rainwater will pool on the glass instead of washing away dust. Installation guidelines recommend a tilt of at least 10°.
The obvious move is to tilt them all north. But north-facing tilts need wide gaps between rows, so each row doesn’t shade the one behind it. Low east-west tilts, set up in back-to-back pairs, can sit much closer together.
I tested this on a 9 m × 6 m roof in Adelaide. North-facing tilts at 30° fit 15 panels. East-west tilts at 10° fit 24 panels, which produced about 15% more electricity than laying panels flat and almost 50% more than the north-facing tilts.
Each east-west panel produces slightly less electricity than a north-facing one, but you can fit many more of them.
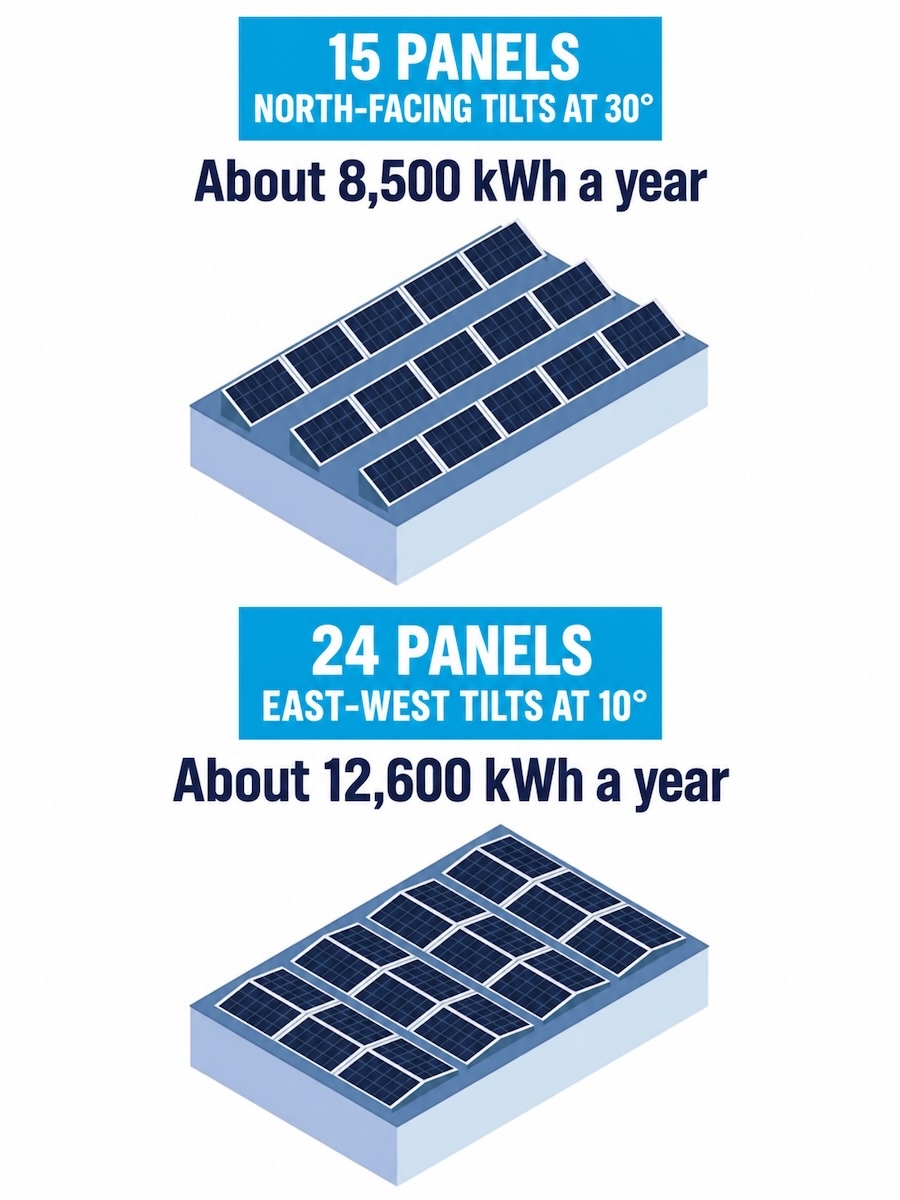
East/west produces more for some than north-facing tilts. It depends on your roof and when you use electricity.
Why The Time Of Day Matters More Than It Used To
When feed-in tariffs were high, every kilowatt-hour was worth about the same, so the goal was simple: point all panels north and maximise output. Now that feed-in tariffs are lower, the time of day you generate solar power affects its value in many parts of Australia.
- Some feed-in tariffs pay more later in the day. In Western Australia, customers of government-owned retailer Synergy earn 10c per kWh for solar exported between 3pm and 9pm. The rest of the time, they get 2c. That’s five times more for solar from mid-afternoon under the state’s Distributed Energy Buyback Scheme.
- Midday grid power can be free. The Solar Sharer Offer gives eligible households in New South Wales, South East Queensland and South Australia three free hours of grid electricity in the middle of the day. Victoria’s Midday Power Saver works in a similar way. On those plans, your midday solar competes with free power.
- Some networks charge for midday exports. Under two-way pricing from the NSW electricity network, Ausgrid, exports between 10am and 3pm above a free monthly allowance attract a small charge. Exports between 4pm and 9pm earn a small credit. Your retailer decides how that shows up on your bill.
A kilowatt-hour generated at 4pm is usually worth more than one produced at noon. This does not mean north-facing panels are a bad choice, but it does mean east and especially west-facing panels can offer better value than their yearly totals suggest.
Batteries, EVs, And Panel Direction
A home battery changes the direction question again.
Without a battery, every kilowatt-hour your panels produce goes to one of two places: either your home uses it as it is generated, or it flows into the grid and earns you a small feed-in tariff.
These two options have very different values. Solar energy you use yourself saves you the full price of grid electricity, often $0.30 per kWh or more. Solar you export usually earns just a few cents.
That is why self-consumption, or the share of your solar energy you use instead of exporting, is more important than total output.
Without a battery, any solar energy you do not use immediately is exported for just a few cents. With a battery, extra midday solar can be stored for use in the evening.
Timing still matters when you have a battery, but total output becomes more important, especially in winter when shorter days make it harder to fill the battery. This makes north-facing panels and having more panels overall a better choice.
Charging an electric vehicle at home during the day works the same way. It uses up midday solar energy that you would otherwise export for a low return.
If you’re planning a battery, ask installers how your array will perform in winter, not just on a sunny summer’s day.
Shade Matters More Than Direction
Shade is the enemy of solar panels. Shade gets in the way of sunshine on solar panels. A north-facing roof that is heavily shaded will produce much less electricity than a sunny east or west-facing roof.
Panels connected in a string share one circuit, so shade on one panel, or even part of one, can reduce the output of the whole string. Microinverters and optimisers can help, but the best solution is to keep panels out of shade whenever possible.
Before deciding on a layout, check for trees, chimneys, and nearby buildings that could cause shade. Then, work out solar panel direction around them.
What To Do Next
Direction is important, but less so than most people think, and it matters differently than it did in the past. Here is what you should do:
- Find out when your household uses the most electricity. Your bill or your retailer’s usage data can show if you use more in the morning, midday, or evening.
- Cover your unshaded roof areas with panels. If you need to choose, start with north, then add west or east to match your usage, and finally consider south.
- Ask installers to design your system based on your electricity usage, not just for maximum output. A good installer will ask when you use power. If they do not, that is a sign to be cautious.
When you are ready, we can connect you with up to three installers we have checked and approved.