
Air-conditioners were working hard during the recent heatwave that affected large parts of Australia — and rooftop solar power systems did their bit to alleviate strain on the mains grid while making air-con use greener and cheaper.
How Much Electricity Was Supplied By Rooftop Solar Panels?
From about 4.30AM last Monday January 5, 2026 to the same time this morning (January 12), rooftop solar contributed 18.8% to overall electricity demand in the National Electricity Market (NEM – QLD, NSW/ACT, VIC, SA and TAS) and Western Australia’s South-West Interconnected System (SWIS). Utility-scale solar kicked in another 10.3%.
The maximum contribution from rooftop solar systems installed in NEM regions was 46.9% on Monday, January 5 at 12PM, followed by 45.9% on Wednesday, January 6 at midday. Overall for the period, all renewables met 49.9% of demand.
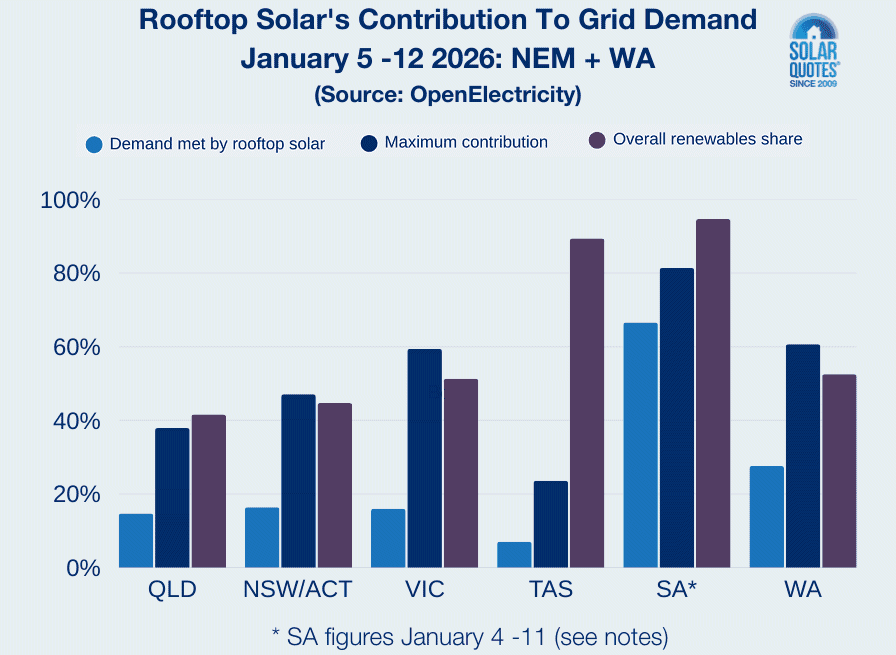
Here’s what happened in each state and territory for the period (aside from NT – I don’t have figures) based on data sourced from Open Electricity:
Queensland:
- Demand met by rooftop solar: 14.7%
- Amount of solar electricity consumed: 226 gigawatt hours (GWh)
- Maximum contribution: 37.9% (January 6, 12PM)
- Overall renewables share: 41.6%
New South Wales/ACT
- Demand met by rooftop solar: 16.4%
- Amount of solar electricity consumed: 290 GWh
- Maximum contribution: 47.1% (January 6, 12:30PM)
- Overall renewables share: 44.7%
Victoria
- Demand met by rooftop solar: 16%
- Amount of solar electricity consumed: 202 GWh
- Maximum contribution: 59.4% (January 5, 12PM)
- Overall renewables share: 51.3%
Tasmania:
- Demand met by rooftop solar: 7.0%
- Amount of solar electricity consumed: 13.5 GWh
- Maximum contribution: 23.6% (January 5, 11.30AM)
- Overall renewables share: 89.4%
South Australia:
- Demand met by rooftop solar: 66.6%
- Amount of solar electricity consumed: 1,510 GWh
- Maximum contribution: 81.4% (January 10, 2.30PM)
- Overall renewables share: 94.7%
Note: I originally recorded figures yesterday, then when checking them again this morning on Open Electricity, they were really off (much lower) for South Australia. So I’ve opted to use January 4 to January 11 figures originally recorded as they seemed to align better with what was happening when I was checking SA from time to time during that period. I’ll check the figures again in the coming days and adjust if necessary.
Western Australia
- Demand met by rooftop solar: 27.6%
- Amount of solar electricity consumed: 130 GWh
- Maximum contribution: 60.7% (January 9, 1.30PM)
- Overall renewables share: 52.5%
In a graph:
New Electricity Demand Record Set
The period saw underlying NEM demand jump to a record high of more than 40,000 megawatts at one point and January 7-9 saw the highest electricity demand in the NEM during the January 5 – 12 period.
Hot summer days have been challenging for electricity networks, striking fear into the hearts of grid operators as high temperatures drive the increase use of air-conditioners.
But in part thanks to rooftop solar panel installations, Global Power Energy’s Geoff Eldridge said there were no Lack of Reserve notices, no calls for emergency reserves, and prices were largely stable in the middle part of the day. Wholesale spot prices even went negative at times, which is becoming increasingly common.
“Peak [underlying] demand is higher than it was in 2019, and summer heat remains a defining challenge,” he said. “What has changed is how the system absorbs that challenge. Solar now carries much of the heat-driven load during the day.”
The remaining challenge for summer is in the evenings, when panels are no longer producing power. But even that will become less of an issue in the years ahead thanks to the Cheaper Home Batteries program (CHBP). More than 175,000 home batteries have been installed since the program formally launched in July 2025. These batteries will serve their owners well, helping to power their homes during evening peak, and put downward pressure on wholesale power prices — benefiting everyone.
The week also would have been a good test of how home batteries cope with extreme heat.
Beyond home solar batteries, there are also plenty of utility scale energy storage projects being built — there seems to be project announcements every other day at the moment.
Virtual Power Plants Yet To Shine
Another key element in taming the electricity system are Virtual Power Plants (VPPs). These are networks of distributed energy resources such as home batteries and solar panels centrally controlled by a third party and smart software to act as a single power source, balancing the grid and reducing peak demand.
But Virtual Power Plants are yet to really take off in Australia; even though we supposedly lead the world. Battery owners are still suspicious and concerned about various issues such as how hard a VPP operator might hit a battery and the impact that may have not only on battery warranty, but longevity.
According to this report from the Australian Competition and Consumer Commission (ACCC), around 38,200 Australian households were participating in VPPs by January last year, with adoption increasing nearly 22% every six months over the prior two-and-a-half years.
However, participation still trails well behind stand-alone battery installations. While there is a requirement under the CHBP that solar batteries installed be VPP *capable*, it is not required to join a program. But there can be added incentives for doing so. For example, In New South Wales and South Australia there is a payment available for connecting batteries to a VPP.
You can compare what’s available across Australia on SolarQuotes VPP comparison page.
By the way, you can also check out how rooftop solar performed on Xmas day 2025 here.
 RSS - Posts


Denand Price
Our proerty is in SA and on the 10th (peak supply day), our system had the battery full by 13.15 and didn’t even start selling through Amber until 17.20 and the price was low enough that the battery wasn’t used at all to supply the grid. Amber income $1.34 for exporting 12.96 kWh
The 7th though, completely different story. We were selling power from the roof from 15.00 and from the battery by 19.00. Because of the demand from the grid, our battery only charged to 70% before the selling began. Amber income $33.99 for exporting 68.54kWh
FWIW the best income ( demand) during the heatwave was on Tues 5th, $205.14 from Amber for 76.03kWh of exports.
Not sure how this tallies up with the demand for exports to the grid.
Thanks, Michael. For keeping track of this information. Am I correct in saying that these percentages of solar contribution are only what reaches the grid and not the amount consumed behind the meter, that is directly from solar panels to air con? If that is correct the contribution of solar would be much higher. Is there anyway of measuring/estimating this.
that ia a good question, becuase at the distribution level (houses) dnsp monitoring is dark.
So, this implies they can measure solar self consumption. How do they do that?
Shirley this can only measure on front of the meter. We used 116KWh over that time period behind the meter (production minus export, almost exclusively on AC). Most solar owners with AC would be in a similar boat. (Although ymmv in specific KWh)
I believe AEMO uses a statistical model developed by Melbourne Uni. It used data from PVOutput connected system and some early NSW gross meters. It takes into account local weather.
https://www.aemo.com.au/-/media/files/electricity/nem/planning_and_forecasting/demand-forecasts/nefr/2016/uom-rooftop-pv-model-technical-report.pdf
And don’t call me Shirley.
The global mean surface temperature anomaly for 1-8 Jan 2026, was +1.60 °C above the 1850-1900 reference baseline.
https://bsky.app/profile/climatecasino.net/post/3mc3ct5p2m22k
And this is apparently occurring during a weak La Niña phase.
4 Jan 2026: R-Niño3.4 at -0.95 °C
https://www.bom.gov.au/climate/enso/?ninoIndex=nino3.4&index=rnino34&period=weekly#overview-section=Monitoring-graphs
NOAA’s Jan 2026 ENSO update suggests a 50% chance of an El Niño phase by mid-2026 and more than 60% chance by 3Q-2026.
https://bsky.app/profile/climatecasino.net/post/3mbwdccptic2j
It seems air conditioners will likely be working much harder during the next even hotter Australian summer (i.e. 2026-27). Are you prepared?
Is this summer hot? Humid, sure, but hot? Obviously it depends where you are, a few places apparently have been warmer, but it seems very regionalised.
Depending on the day you’re talking about, and part, the peak temperatures were sub-30!
On the other hand hot and humid (usually cloudy) nights are taxing on folk.
John Alba: – “Is this summer hot? Humid, sure, but hot?”
The Australian Bureau of Meteorology (BoM) does not use a single, universally fixed temperature threshold for “hot,” “warm,” or “cold.” Instead, these terms are relative to the specific climate zone, season, and historical averages of a particular location.
Australia is divided into six major climate zones (e.g., tropical, subtropical, temperate, desert). A “hot” day in a temperate zone (like Melbourne) might have a lower temperature than a “warm” day in the tropics (like Cairns).
So, where/when are you referring to, John?
John Alba: – “Depending on the day you’re talking about, and part, the peak temperatures were sub-30!”
Meanwhile, Sydney’s (i.e. Observatory Hill’s) maximum temperature peaked at 42.2°C on Saturday, 10 Jan 2026, making it the second time in the summer of 2025/26.
https://www.weatherzone.com.au/news/sydney-tops-42c-twice-in-summer-for-first-time-in-13-years/1891131
Geoff, relative means you’re getting into subjective territory. Britain is ‘hot’ when it hits 30 or so whereas it’s the mean daily maximum even in winter for Darwin, though only the mean maximum in summer for Hobart.
Given Sydney is a concrete jungle and thus a heat sink, might not that have something to do with the temperature? I’m presuming the location in question is a park next to the harbour, so there may be some amelioration, but honestly what do you expect from a built environment that’s only growing worse?
Michael, you’ve mentioned the maximums, but what about the minimums? Folk don’t just use power when it’s peak output, they also need power when it’s at the minimum. Leaving aside the poor solar output at night, what about lowest maximums by region over the same period?
-NSW 20.8% (noon 11th Jan)
-QLD 35.4% (11 am 11th)
-SA 51.9% (1pm 8th)
-VIC 30.8% (10:30am 9th)
QLD aside, it looks like there’s huge variation in maximum contribution, which has implications for reliable power supply.
I believe it is significant due to self consumption. Over the dates mentioned in the blog, the grid would have observed my house consuming about 95KWh. It in fact used about 215KWh. Because I was self consuming so much of my generation for AC, my exports were significantly lower than average for this time of year. Multiply this drop of exported production by all the other houses in the states with a heatwave and the low measured contribution is of no surprise.
Keep in mind too the dire FiT means that there is virtually no financial incentive to set the thermostat a bit warmer and share some of those electrons. The lost export earnings potential for staying way more comfortable is a cup of coffee money over the week.
My grid use for the week in question was less than half yours. Something broke last time I had a power cut so self consumption is a little more complicated, but probably similar direct consumption – AC is a glutton compared to most other things.
I won’t bother comparing exports for the period in question across the years, but the daily average for the first 11 days of the month compared to previous years suggests it could be the highest export month since last year. Obviously the full month is TBC and BoM is predicting plenty of grey days so the export average could plummet radically.
My FiT is still decent at 10c/kWh, but my retailer has indicated they’re not inclined to continue that so things are likely to change radically in the nearish future. : – (
Do you mean you drink cheap coffee, or you export a lot of power? Given how high shop coffee prices are, and how common 2 or 3 c/kWh FiTs are, it takes a lot of kWh to pay off a single coffee. : – )
I’m comparing my exports at my FiT (5c) between two strategies. The first strategy is maximizing for comfort in the heatwave (all zones on, high fan speed, 21C but it’s going to self consume practically everything) vs the second strategy of keeping one zone at 26C and low fan speed. The latter would let me export an additional 25KWh per day than the former (on a sunny day) due to reduced AC draw. My point is that over a week that latter strategy would only earn an extra $5-$10 so poor FiT is encouraging a reduction of exports during heatwaves.
Up in NSW, on a 42°C day, my brother was exporting 10 kW while powering two dwellings. The system nearly cooked, with heatsinks over 75°C, so 100°C+ inside, I figure. That was with a shadecloth shade, which reduced convection cooling. Reduction of inverter and battery life need to be considered when driving the system hard in hot weather.
I’ve advised him to drop exports entirely on hot days.
Many domestic systems have small inverters, already becoming undersized for self consumption, let alone hot weather export. Killing them for peanuts make no sense.