
Australia’s GHG emissions continue to rise
The latest Australian National Greenhouse Gas Inventory quarterly update reveals a reduction in electricity sector emissions, but an increase at a national level.
The update states for the year to March 2017, emissions excluding the Land Use, Land Use Change and Forestry (LULUCF) sector increased 1.0 per cent on the previous year. A major contributor to the rise was the expansion in LNG exports says the report, with an LNG production increase of 39.7 per cent over the previous year.
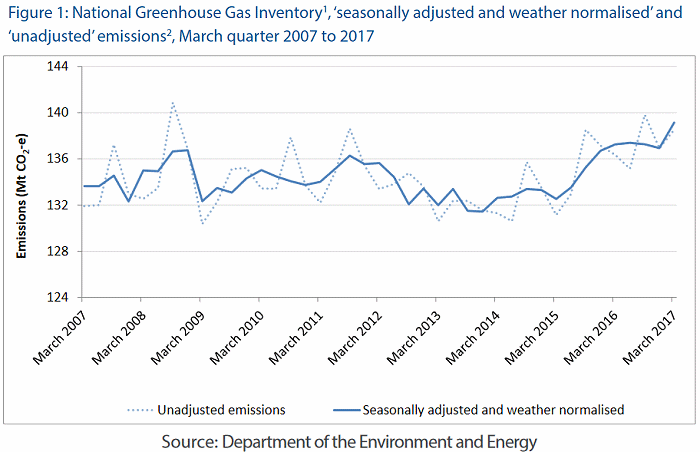
For the March quarter 2017, emissions increased 1.6 per cent relative to the previous quarter on a seasonally adjusted and weather normalised basis.
Here’s how various sectors shaped up (year to March 2017 vs. year to March 2016).
- Energy – Electricity: -1.9%
- Energy – Stationary energy excluding electricity: +5.8%
- Energy – Transport: +0.4%
- Energy – Fugitive emissions : +1.3%
- Industrial processes and product use: +2.8%
- Agriculture: + 2.5%
- Waste: -0.3%
Climate Council CEO Amanda McKenzie said the overall situation would have been much worse if not for the efforts of some State and Territory governments. Ms. McKenzie also urged the Federal Government to end the political gridlock and get on with the task of shifting to renewable energy and storage technologies.
“We already know we can drive down our emissions and tackle climate change through affordable, clean and efficient renewable energy and storage technology – so what are we waiting for?”
Electricity Generation Emissions Drop
As indicated above, there was some good news with regard to electricity generation related emissions, with a 1.9% reduction.
Emissions from the National Electricity Market account for approximately 86% of total electricity estimates in the year to March 2017. With regard to the NEM specifically, the update states for the June quarter 2017, electricity emissions decreased by 2.8 per cent on a seasonally adjusted and weather normalised basis, and dropped 2.3 per cent in the year to June 2017 compared to 2016.
This occurred due to reduced demand and brown coal electricity generation, along with an increase in renewables based electricity generation.
The last report showed NEM emissions in 2016 (full year) dropped 0.3% compared to 2015, partially due to weaker demand.
NEM Generation Energy Mix Changes
The following shows changes in the electricity generation fuel mix in the NEM this year to June, compared to the same period in 2016.
- Black coal : + 3.6%
- Hydro : + 7.2%
- Other renewables (excluding small scale solar) : +3.9%
- Brown coal : – 10.8%
- Gas : -5%
The Quarterly Update of Australia’s National Greenhouse Gas Inventory: March 2017, which incorporates NEM electricity emissions up to June 2017, can be viewed here (PDF).
 RSS - Posts


There is a lot rubbish going on about coal fire power stations. What about;
1 WORLD POPULATION… Everyone farts. (methane) What is this doing to the enviroment…
I’ll just stop you there and point out that people normally don’t fart methane. Some do, but they’re exceptions. People with flammable farts are normally emitting hydrogen. Hydrogen is not a greenhouse gas but can slow down the breakdown of methane in the atmosphere. But very little human produced hydrogen comes from our bums. The vast majority results from burning fossil fuels, including coal.