
The best place for solar panels is on your roof. Despite this, over one-third of our solar electricity comes from large-scale solar farms. Their construction can involve land clearing that releases carbon dioxide into the atmosphere.
These emissions aren’t good, but they are trivial next to those from fossil fuel generation.
This is because:
- Burning Australian coal releases roughly 1,000 times more carbon dioxide per kilowatt-hour generated.
- Coal mining results in vast amounts of land clearing. Even before the coal is burned, this may result in more emissions per kilowatt-hour generated than solar farms.
- When the land beneath the solar farm returns to its original use, regrowth will absorb carbon dioxide from the atmosphere roughly equal to what was originally released by land clearing.
Unlike coal mines, solar farms and agriculture can be combined. Under the right conditions, solar farms can increase the amount of vegetation land can support. But even in an — imaginary — worst-case situation where some lunatic bulldozed an old-growth forest to build a solar farm and no regrowth allowed, coal power will still emit over 300 times more CO2 per kilowatt-hour generated.
If you want to check my figures for this worst-case scenario, you can find them below. But first, I’ll make you read about how much land coal mining requires and how solar farming and real farming can go together.
Solar Farms — Big But Not That Big
Last financial year, solar energy provided 14% of Australia’s on-grid electricity. As most of our solar power capacity is on roofs, the approximately 11 GW of solar farms only produced about 5% of generation.
If we installed modern, 20% efficient, solar panels flat on the ground without gaps between them, 11 gigawatts would take up 57 square km. In practice, most solar farms have rows of solar panels with space between them to prevent shading. Land is also used for other purposes such as inverters and vehicle access. In total, Australia’s solar farm capacity would cover around 100 square km. This figure may not be spot on, but it’s nice and round, so I’m running with it.
Update 23rd of February 2023: It has kindly been pointed out to me in the comments that 100 square km is too small an area for Australia’s existing solar farms. Even if only the ground the solar panels cover was counted they would cover over 200 square km. Please imagine the black squares in the maps below as being at least twice as large. But solar farms being built today can potentially take up much less space per megawatt of capacity, with 5B claiming they can get up to 150MW per square km.
If all of Australia’s 100 square km of solar farms were arranged in one large square just outside of Sydney, it would look something like this:
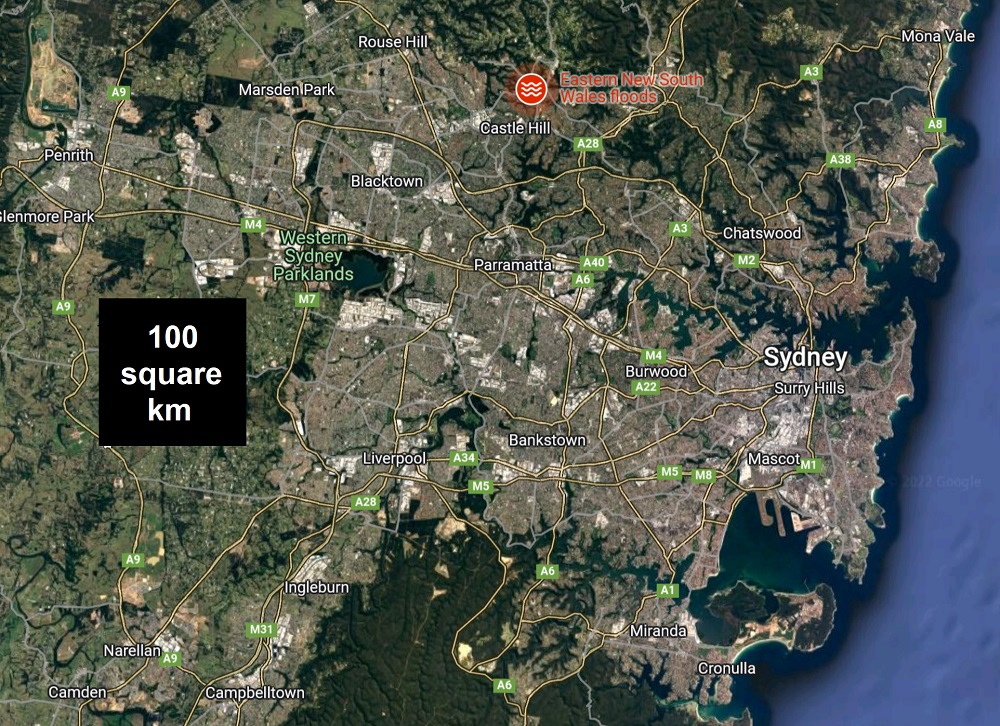
While 100 square km is a lot of land, you can see it’s not that much in relation to a major city of 5.3 million.
Here’s what it would look like at the national level:
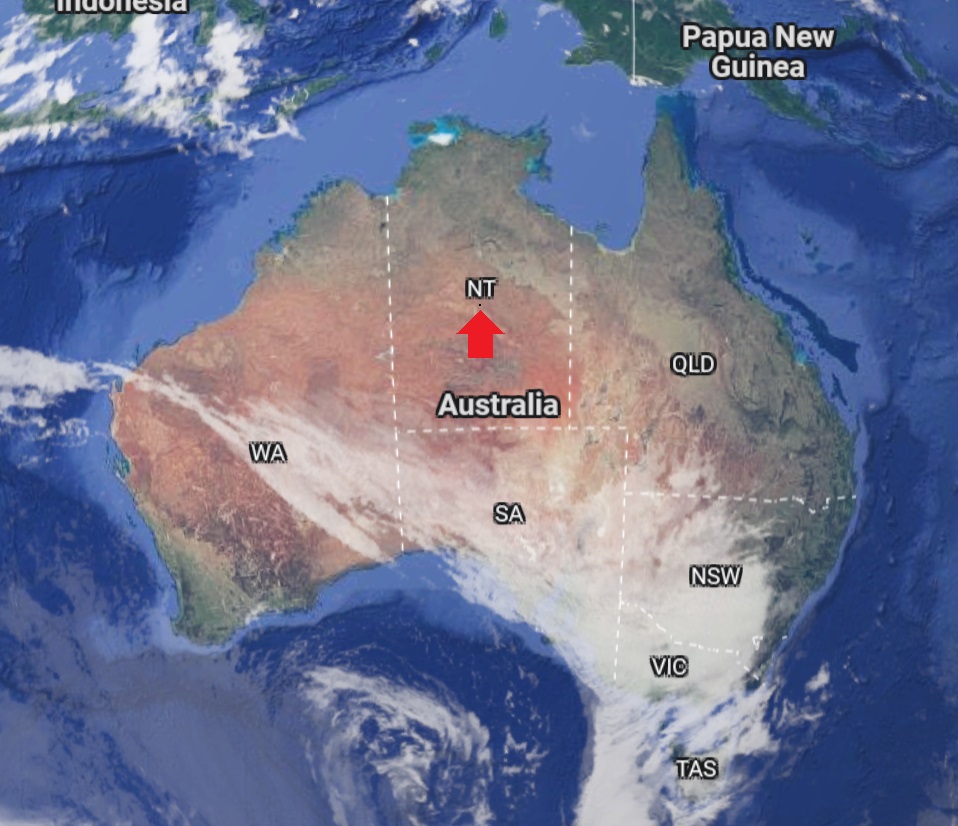
I’ve put a black square representing 100 square km of solar farms right under the letters “NT”. A nice, sunny, location for it. Since it’s hard to spot, I’ve also included a large red arrow. As you can see — or not see if your vision isn’t acute — Australia’s solar farms don’t take up a lot of land.
Even if Australia decided to generate its entire current grid electricity consumption from solar farms and increased the area they cover by a factor of 18, they’d still only cover this much of the country:
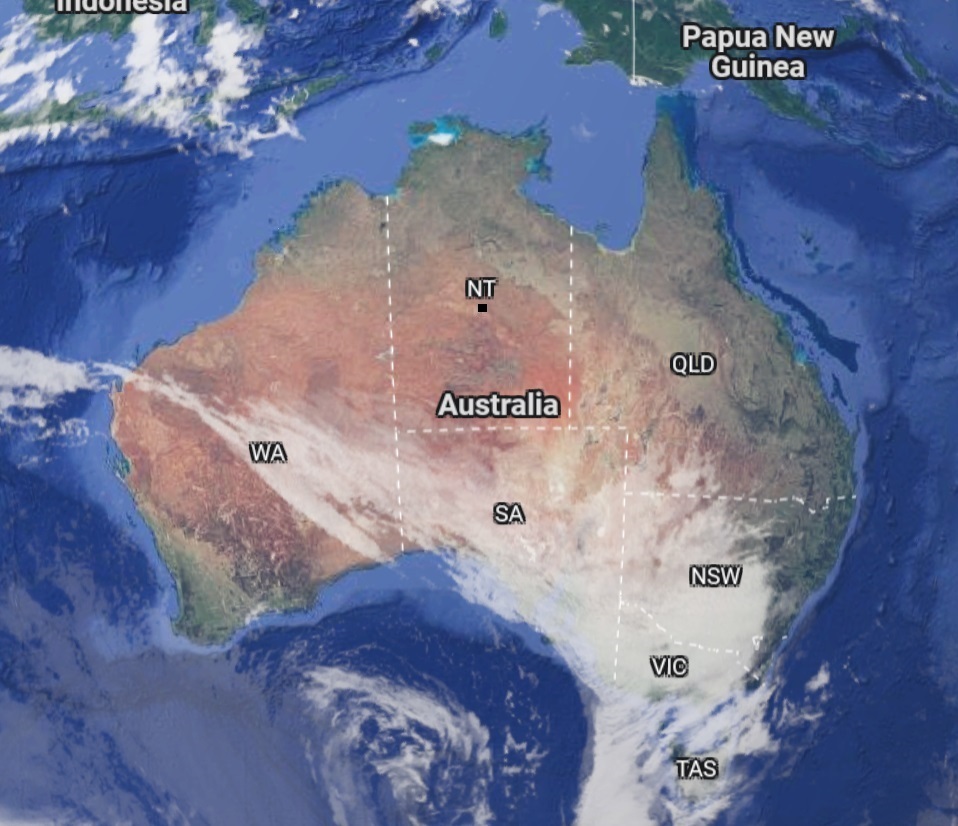
While they cover a lot of land, it’s still not that much in relation to the continent. Also, if it was all located in the middle of the Northern Territory, the black square would be smaller thanks to the location’s very high solar power output. If closely spaced solar panels were used, it could be about half that size.
Even if national electricity consumption doubled, we would not devote that much space to solar farms. Not when we still have so many rooftops we can put it on. But there is a possibility we will end up building considerable solar farm capacity to meet overseas demand through intercontinental electricity connectors such as Sun Cable’s Australia-Asia Power Link (AAPowerLink) project.
Coal Clears More Land
Solar farm land use is tiny in relation to how much has been cleared for coal extraction. For example, South Australia’s Leigh Creek coal mine — now closed — covers a total area of around 70 square km.
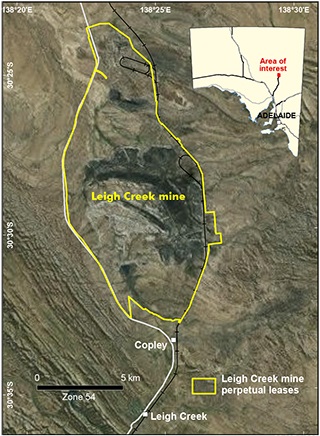
This image is from the South Australian Government’s page on Leigh Creek Mine remediation. (I’m not going into coal mine remediation here, as that would require a hole article.)
Here’s what a black square representing the area of all Australia’s solar farms looks like next to it:
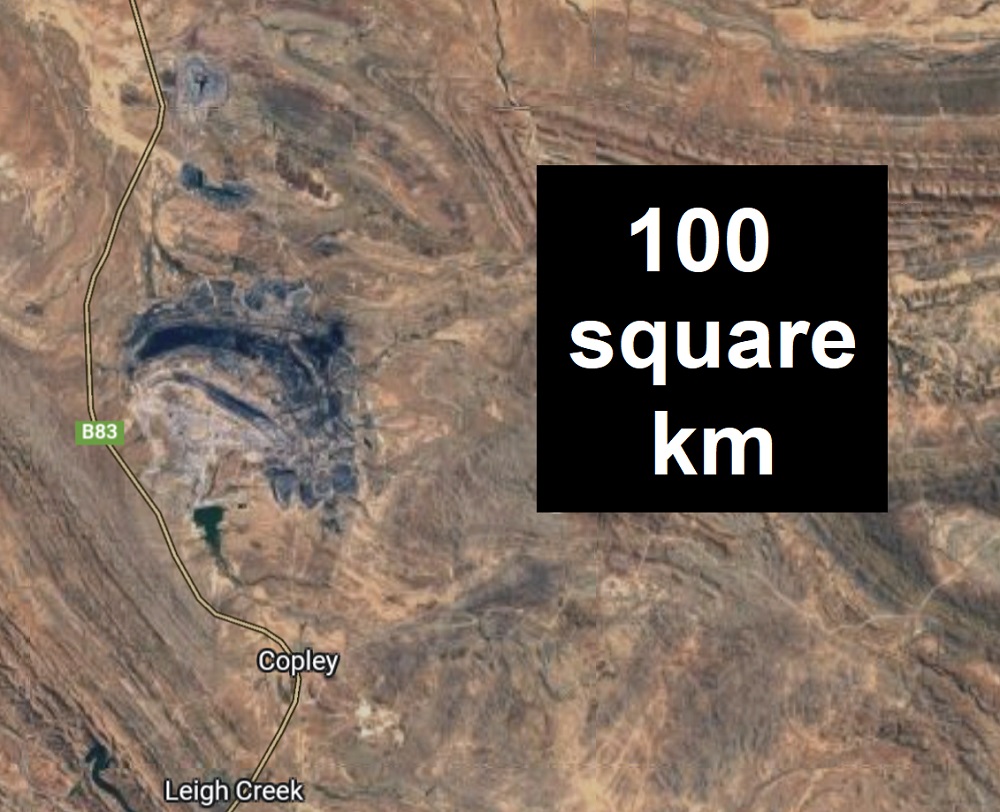
In 2007, its highest output year, coal from this mine generated 5,188 gigawatt-hours of electricity. Last financial year, Australia’s solar farms generated approximately 12,200 gigawatt-hours. In a year of below-average sunshine, Australian solar farms produced over two-thirds more electricity per square km than the Leigh Creek mine in its best year.
But solar power actually did better than that. Solar farm capacity is expanding rapidly and Australia had less at the start of last financial year than at its end. After accounting for that, solar farms produced approximately 84% more energy per square km than the Leigh Creek coal mine’s best year. This figure will increase as the efficiency of solar farms improves.
Not every coal mine is as spread out as Leigh Creek. But most of Australia’s production comes from open-cut mines rather than underground ones. I don’t have good figures for how much land is taken up by coal mining for domestic consumption. But, as most of our solar energy generation comes from rooftops, it seems almost certain to me that solar power requires less land clearing per kilowatt-hour generated than coal.
Solar Farms Don’t Have To Remove Vegetation
Solar farm construction often involves the removal or reduction of existing vegetation, but it doesn’t have to. Here’s an example from Germany of dual-use solar power and agriculture:
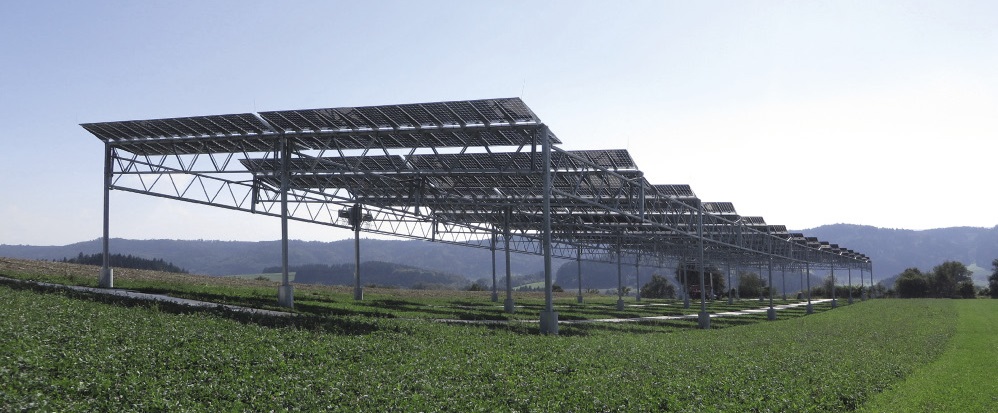
Image Credit: Fraunhofer Institute
The French decided that didn’t look weird enough and came up with this:
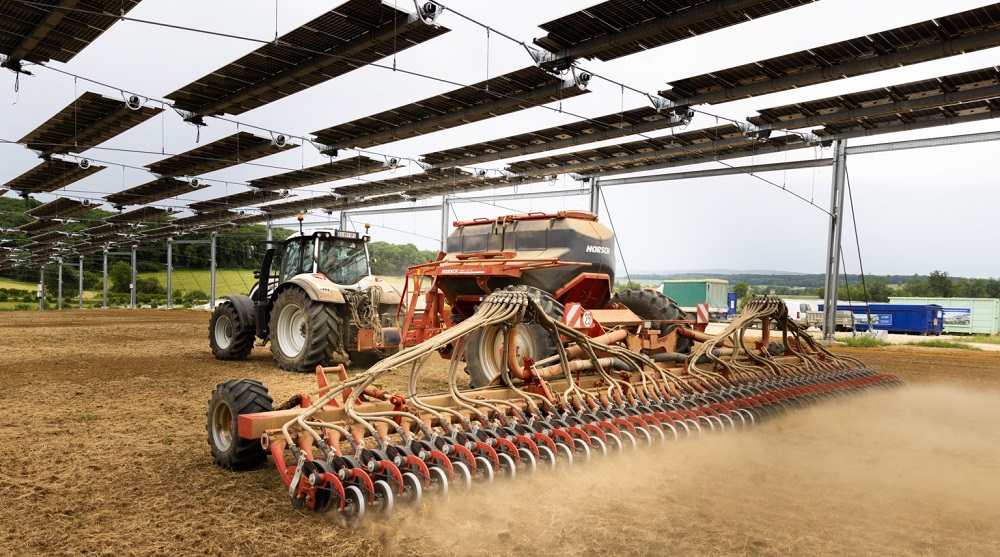
Image Credit: PV Magazine
Despite their efforts, as I pointed out years ago, the best solution may be to vertically install bidirectional solar panels that use sunlight falling on either side:
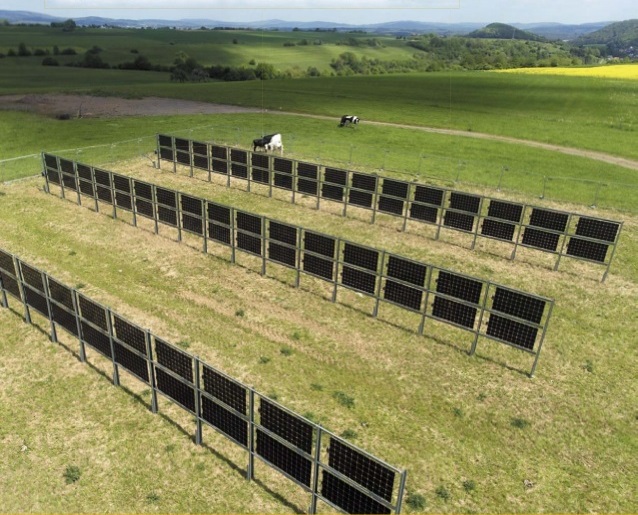
Image Credit: Photon Magazine
This leaves the space between panels wide open for agriculture, whether grazing or cropping.
In Australia, it’s usually not the amount of sunshine but water availability that limits vegetation growth. Ground-mounted solar panels can increase water availability by providing shade, cooling the ground, slowing wind speed, and allowing dew to drip from them. This can increase the total amount of vegetation that can be sustained. The fact less sunshine can help plants grow is familiar to many Australians who have struggled to mow thick grass in sheltered areas of the lawn that receives less sunshine.
Numurkah Solar Farm: Solar Energy + Grazing
It’s not just whacky Europeans who have combined solar power and agriculture. Here’s a video showing the Nurmurkah solar farm. It was built on grazing land and continued to be used for the same purpose after the solar farm was completed:
The carrying capacity of the land — how many sheep it can support — is around 80% as much as normal grazing land. But during a drought, it’s higher than land without solar panels.
Solar Farms Often Cause Land Clearing
Most Australian solar farms are not combined with actual farming. This is especially true for modern ones where solar panels are installed on frames in a factory and unfolded on-site. As the photo below shows, this often leaves very little open ground:
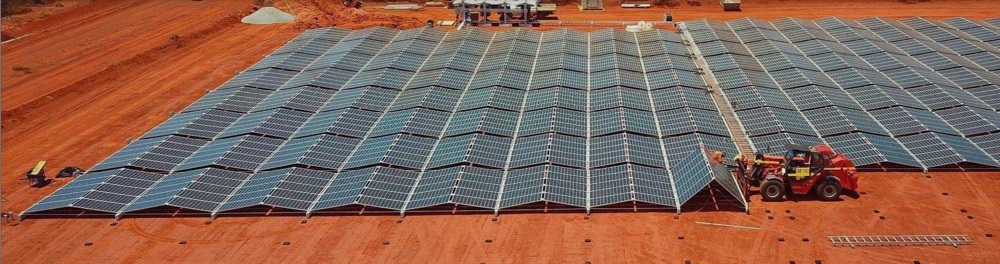
Maybe you can grow some shade herbs under there, but you’ll have to train goannas to harvest them. (Image Credit: 5B)
The fact these types of solar farms can’t combine with agriculture may appear to be an environmental minus, but this design provides two solid environmental benefits:
- It produces more energy per square metre, and so requires less space in total than a traditional solar farm.
- It lowers costs. This results in the very large environmental benefit of more solar farms being built, which reduces fossil fuel based electricity generation.
The downside is the area under the panels will support very little, if any, vegetation. While the land doesn’t have to be completely cleared like in the picture above, there simply isn’t much room for plant growth under them.
Regrowth Can Be Quick
Extracting fossil fuels and then burning them releases carbon that was trapped underground for millions of years. It takes an extremely long time for all the carbon released into the atmosphere to become trapped underground again. If you burn a kilogram of coal today, some of the carbon dioxide released will still be in the atmosphere 10,000 years from now.
Emissions from land clearing can persist in the atmosphere for a far shorter period. This is because the emissions come from the burning or decomposition of vegetation and associated fungi and animals. If the land is returned to its original use, then regrowth of vegetation and re-establishment of the local ecosystem results in carbon being drawn from the atmosphere by plants and being incorporated into biomass. This process may take decades if a forest is cleared, but for scrub or grazing land, which is what solar farms are usually built on, most of the reabsorption of CO2 can occur within a few years.
Mature Ecosystems Don’t Absorb CO2
Cleared land that’s left alone will absorb CO2 from the atmosphere as vegetation regrows. But this process will slow down over time and eventually stop.
In most mature ecosystems, the amount of CO2 absorbed and released is balanced. Exceptions, such as peat bogs and marine estuaries, are not likely places for solar farms. This means we only have to worry about emissions from land clearing itself, as uncleared land does not, normally, remove a net amount of CO2 from the atmosphere.
How Much CO2 From Solar Land Clearing?
CO2 emissions resulting from land clearing depend on three main factors:
- What type of land is cleared.
- How complete the clearing is.
- How much regrowth occurs.
If a solar farm is built on grazing land that’s used for the same purpose afterwards, this will result in little or possibly no total loss of vegetation. On the other hand, if a forest is fully cleared for a solar farm and no regrowth is allowed, considerable carbon dioxide emissions may result.
I will consider the maximum amount of CO2 emissions from building a solar farm in an extreme, worst-case scenario.
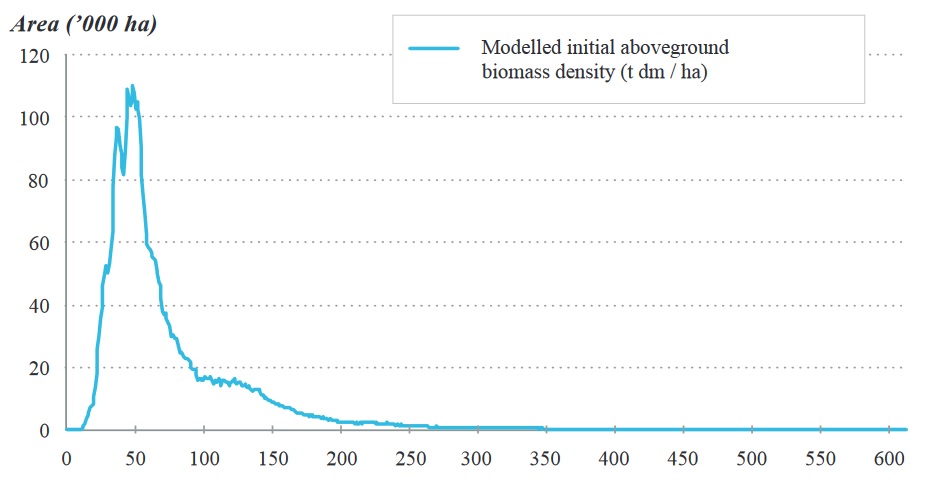
How Much Biomass?
According to Land Clearing — An Assessment Of Biomass Density, the maximum amount of dry biomass per hectare in Australia is around 110 tonnes:
 No one ever cuts down dense, old-growth forests to build solar farms. There’s plenty of already degraded land that can be used. But I’m going to imagine a worst-case scenario where I bulldoze a forest, burn all the biomass, and poison the ground so nothing grows back. It will be the world’s most evil solar farm!
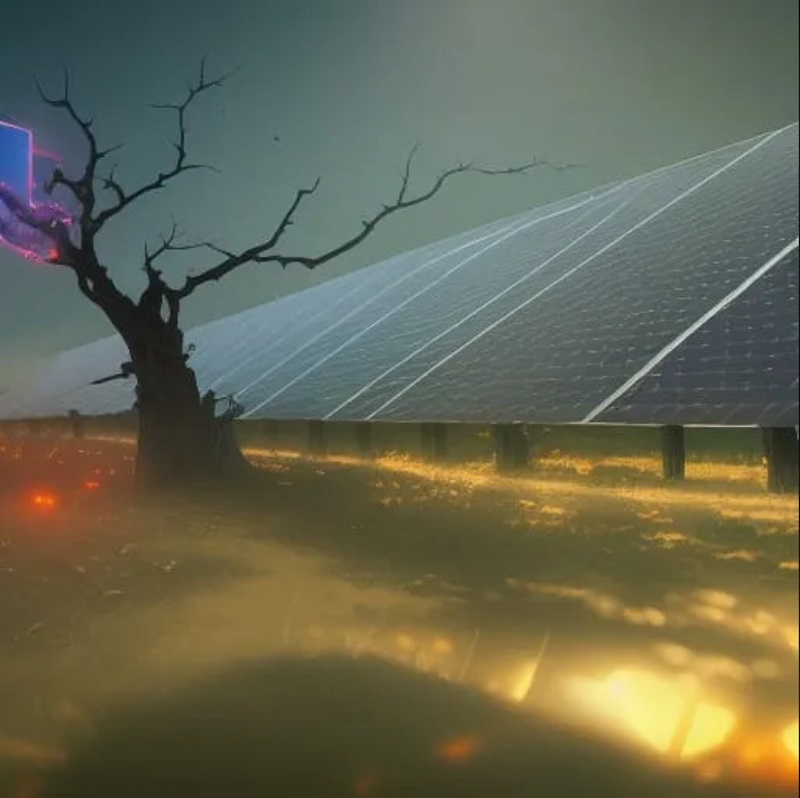
According to Nightcafe Creator AI, this is what an “evil solar farm” looks like. (Image Credit: A goddamn computer!)
Underground Biomass
The 110 tonnes per hectare figure only includes above-ground biomass. But this paper suggests there are around 25 tonnes of biomass below the ground for every 110 tonnes above. While some of this would remain below ground over the life of the solar farm, I’m going to assume all the carbon in it ends up being emitted as CO2. This brings the total biomass per hectare up to 135 tonnes.
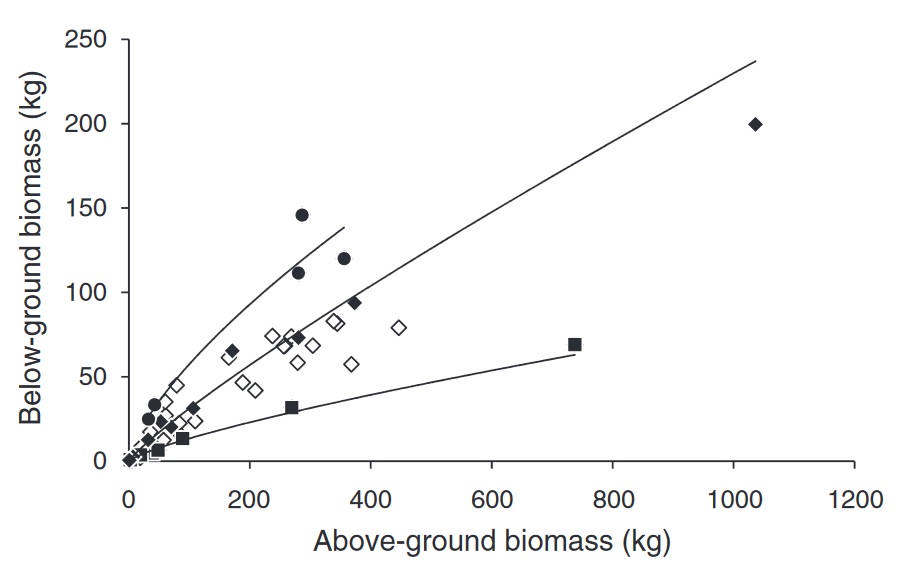
Justin Jonson and David Freudenberger had this graph published on page 644 of the Australian Journal of Botany in December 2011. And I’m quite glad that they did. It saved me a lot of digging. (Image Credit: Australian Journal of Botany)
Carbon Content Of Biomass
The carbon content of dried plant material is around 40-50% by weight. I’ll use a figure of 44% because that’s the carbon content of cellulose — the most common plant compound. There will also be things like fungi, insects, and spiders mixed in with the plant material, but their carbon content will be similar. This means the total amount of carbon is nearly 60 tonnes per hectare.
When biomass is burned or otherwise decomposes, every atom of carbon will combine with two atoms of atmospheric oxygen. This added mass causes every tonne of carbon to create 3.67 tonnes of CO2 emissions. So in this worst-case scenario, clearing one hectare will result in the emission of 218 tonnes of CO2.
1 Hectare Solar Farm Electricity Output
A modern dense solar farm will cover around 90% of its total area with solar panels. While I used a worst-case situation for land-clearing emissions, I’ll assume its location is reasonably representative of Australian solar farms and place it near Dubbo in NSW. While the typical solar farm will have a mildly higher output than one there, it should be reasonably close to average.
A one-hectare solar farm near Dubbo that covers 90% of its total area with solar panels would generate around 2.66 gigawatt-hours per year. These days it’s reasonable to expect a solar farm to have a lifespan of 30 years. Over this time, assuming some deterioration in output, it would produce around 75 gigawatt-hours.
Dividing the 218 tonnes of land clearing emissions by this amount gives 2.9 grams of CO2 per kilowatt-hour of solar farm electricity generated.
Coal Is Over 300 Times Worse
If we ignore emissions from coal-related land clearing and only consider those from mining and burning coal in power stations, then each kilowatt-hour generated from coal releases around 1,000 grams of CO2. This makes coal 345 times worse per kilowatt-hour than my unrealistic, worst-case, estimate for emissions from solar farm land clearing.
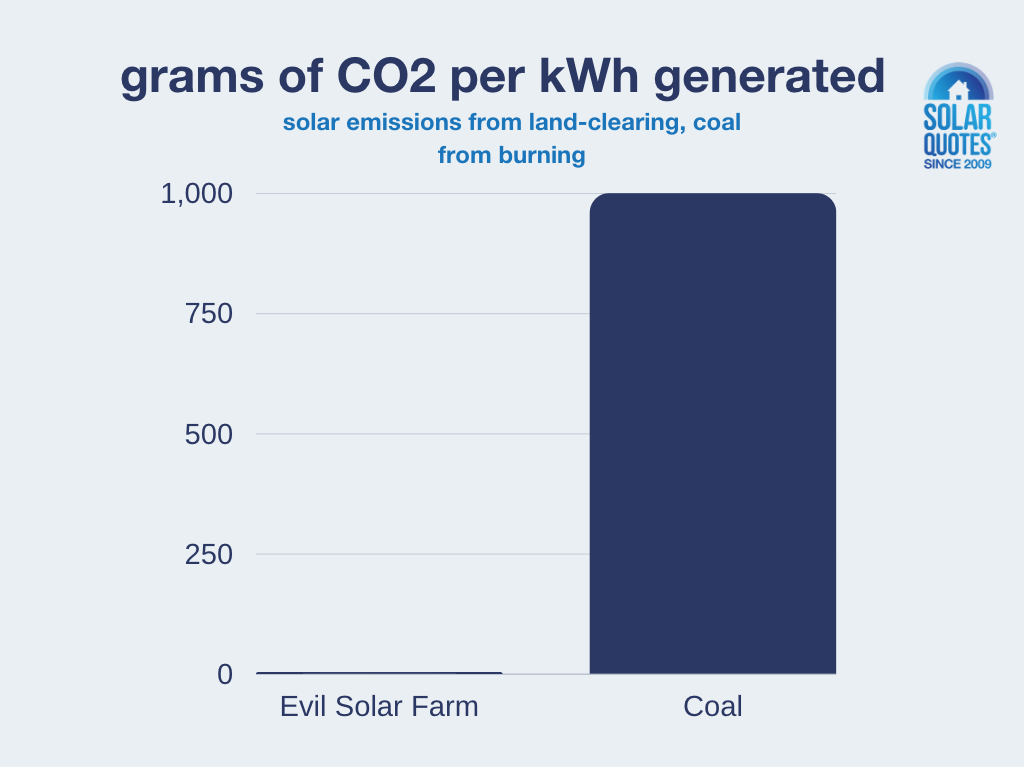
Because solar farms are generally built in either open ground or scrub rather than our densest forests, a more realistic comparison would make coal around 1,000 times worse. But even before emissions from burning fossil fuels are considered, land clearing for coal mines may result in more emissions per kilowatt-hour generated than solar farms.
Also, we should consider that once a solar farm reaches the end of its life, provided the land is returned to its original use; regrowth will cause emissions from land clearing to be drawn out of the atmosphere. Generally, this process will mostly occur within just a few years.
This is very different from a coal mine. No matter how long you wait, it will never suck all the CO2 emitted by the coal out of the air.
 RSS - Posts


As I mentioned in previous blogs, there is a strong case for floating solar in Australia. Partially cover dams and reservoirs with floating solar panels. No land to clear and reduced evaporation losses. Better still, install at on hydro reservoirs and be close to a grid connection.
My estimates for existing dams and reservoirs are here, together with a link to World Bank resources:
http://www.vdrsyd.com/mp/floating_solar.html
The main objection I have come across is that recreational boaties would complain. No much of an excuse to do niothing, especially when, in genral only 10 or 20% of the reservoir needs to be covered with solar.
I can understand Ronald’s enthusiasm for solar and I am also happy with my 6.6kW of panels despite an overly-generous (?) FIT of 2.5c/kWh in WA, but I also have to dampen his enthusiasm by quoting Germany as an example:
Despite a lot of solar and wind and nuclear installations, Germany still needs a lot of gas for its industry and is not getting it and is reestablishing coal-fired stations for base load and buying more energy from nuclear France. One cannot smelt steel and alum via batteries and our industry will find that out.
Similar story from India where Greenpeace established a “green” solar village. On opening the villagers demanded “useful” electricity for cooking and refrigeration as that was prohibited. By the way, no fridge means no serum for snake bites and certain death.
Dominic Wild,
“One cannot smelt steel and alum via batteries and our industry will find that out.”
Have you done the detailed energy supply-demand analysis, Dominic? No? I’d suggest Blakers & team have. On what competency basis do you dispute their work, Dominic?
https://www.solarquotes.com.au/blog/waratah-super-battery-mb2677/#comment-1502706
There are many opportunities for PHES in Australia.
https://www.solarquotes.com.au/blog/waratah-super-battery-mb2677/#comment-1503628
PHES projects in progress: https://reneweconomy.com.au/pumped-hydro-energy-storage-map-of-australia/
The list of gigawatt-hour scale BESS projects is growing.
https://www.solarquotes.com.au/blog/electricity-tariff-comparison/#comment-1499379
Hi Ronald,
A worthwhile and interesting exercise.
You did not discuss the water usage with coal.
11GW solar would give about 14.4 TWh per year not 12.2 TWh if you use a Capacity Factor of 0.15 and is about 7% of NEM.
The storage area required also needs to be considered. If you need 36-hours of storage this is the equivalent of the Snowy 2. Huge about 270km^2
Leigh Creek was old and the comparison should be done against a modern black coal mine.
It was a brown coal of poor quality. It also had to be transport 250km to burn. Any other state would not have been developed.
It was good that it closed down.
Using ” in-situ coal gasification” would have reduced the footprint. Better to use solar 🙂
Dave
In Australia 32m2 is the standard glass window area at 400$/m2, = $12,800
A roof top 32m2 of glass ‘windows’ facing the sky at $5,000, is a solar PV system.
So double the amount of glass in a home at half the cost of std windows, and put it on the roof.
Forget fancy names, like PV solar power systems.
The auto manufactures know this and are busting to get into the EV business.
The above combined with the existing grid is perfect.
You see when you look at the grid backwards and with an EV for every building, the grid is UNLOADED and is free to carry any excess power.
The distributed power can be fed back into the grid and concentrated, which is the opposite of concentrated central power generation.
Nobody does the numbers, everybody is misdirected by the framing of the matters by the ‘get rich quick’ nuclear promoters.
Nuclear needs the entire grid and 5 times more grid capacity in the future when high density energy in fossil fuels is not available.
This is insanely stupid economics, National grids cost $trillions and SMRs, nuclear are $2billion each.
UNLOAD the grid from the ends of the grid, FMD.
$trillions saved as the existing grid is perfect.
20million vehicles and 20million buildings in Australia, all connected to the grid.
Forget solar farms and their expensive grid connections, klm of expensive transmission construction.
20million roofs are all the structure we need to get panels up and facing the sky. 20million buildings connected to the grid. 20million points of power need, and no transmission grid capacity ‘needed’.
The UNLOADED grid saves $trillions.
Solve the right problems.
Opposition member Peter Dutton isn’t giving up on SMR’s any time soon by the look of it. He keeps repeating the phrase ‘This is the discussion we need to have’ somewhat ad nauseum, as though the ‘nuclear option’ has never ever been discussed before.
Although SMR’s are touted as costing a mere 2 Billion or so each, and ready to be used 2 years or so after construction, the reality is that the installed cost is far more likely to be at least twice as much (assuming things go reasonably well), then there is the ‘ramp-up’ period… possible teething problems with ancillary equipment.
As well, SMR’s are NOT an off the shelf product. No vendor in his right mind is going to have multi-mega billions of $ tied up in ‘finished stock’ ready to serve eager customers at a moments’ notice., and capable of being loaded onto a freighter for shipping 8 weeks after they’ve received an order.
Rather fortunately for Australia we have little or no ‘legacy’ generation reactors supplying large amounts of electricity to a grid along with millions of customers to worry about.
For someone so obsessed with terrorism I find it bizarre that PD can even consider “small nuclear reactors” distributed all over the country. What a dream situation for any terrorist group wanting throw a country into chaos – just a small explosion near one of these devices and there is radioactive contamination for centuries.
There is a delightful US auto company ad from the 1950s predicting that cars will have nuclear reactors instead of gasoline. Mind you, in those days they didn’t acknowledge the possibility of cars crashing:
https://www.gizmodo.com.au/2022/06/fords-nuclear-powered-1962-concept-car-is-a-fascinating-atomic-age-fantasy/
Yes – Lucus Heights was a target. Many designs are underground and won’t be near a big city so may help.
Without good cheap storage eg H2 at $1/Kg they may be the only option by 2040. Many countries are looking at them:
https://en.wikipedia.org/wiki/List_of_small_modular_reactor_designs
Australia and Germany are the notable exception.
Hi Michael,
You are right. SMR sites would be pretty to identify with today’s satellite technology too Even if you have only 1 single SMR reactor at a site,, that needs just about as much ‘security’ and space surrounding it as would 3, 4 or 5 of them together.
One lesson from the Ukraine situation and the accelerating rate of natural disaster events, is that in today’s world, it could prove very unwise not to have your national energy supply spread around as much as possible.
Going back to the areal extent of energy structures. Rolls Royce SMR is 0.04km^2 for 0.47GWh !!
Dave,
“Rolls Royce SMR is 0.04km^2 for 0.47GWh !!”
Actually, it’s zero km² because Rolls Royce SMR’s are ‘vaporware.’
There are no physical manifestations of any so-called ‘factory-built’ SMRs anywhere on Earth to date (if ever). And yet it seems these various SMR projects keep extracting apparently tens/hundreds/thousands of millions of dollars, pounds, euros, rubles, yuan, etc., of taxpayers’ money from various countries with little physical progress (except perhaps a few ‘orphan’ units in Russia & China) to show for it.
https://en.wikipedia.org/wiki/List_of_small_modular_reactor_designs
Noel Wauchope wrote on 30 Dec 2021:
https://michaelwest.com.au/ikea-it-aint-small-modular-nuclear-reactors/
CSIRO/AEMO’s GenCost 2021-22 report estimates the SMR build cost projected for year 2030 is around $16,000/kW. For a 470 MW capacity SMR unit, that equates to around a $7.52 billion price tag. Ouch!?♂️
GenCost estimates 2030 LCOE:
* SMRs: AU$140-335/MWh – EXPENSIVE
* VRE + integration: AU$50-80/MWh – CHEAPEST
hahaha, sad but true
Where did you get the information that mature growth forests are not carbon sinks?
Dr Beverley Law, a PHD in Biology, has conducted a world wide study (although her local study was in Oregon) and debunked those old empirical “guesses” with actual data measuring carbon inputs and outputs. I know my reference is only a YT video but she’s probably put out a paper as well.
https://www.youtube.com/watch?v=LDdKOmvIKyg
The conclusion – forests during the growth phase are net carbon emitters because the lack of shading promotes carbon emissions from ground respiration. On the other hand old growth forests have a canopy cover that prevents as much carbon respiration from the ground and are net carbon sinks. While it seems counter intuitive this is what the data tells us.
Well, there is this paper:
https://onlinelibrary.wiley.com/doi/abs/10.1046/j.1354-1013.2001.00439.x
This found that total respiration – photosynthesis and later breakdown of photosynthetic products – was greater in the old growth (or older growth) forest studied, but doesn’t conclude the old forest is a significant carbon sink. It does say clearing land can result in carbon in the soil being emitted as CO2 and I did take that into my “evil solar farm” example – but only in a rough way. I am not qualified like Beverley Law.
But note, in practice, generally no forests are cleared to build solar farms in Australia. They are normally built on degraded land.
CO2 is a plant nutrient.
Experiments have shown that there is a roughly linear relationship between growth rate and CO2. Double CO2 means about double the growth rate.
Most of the “green revolution” can be accounted for by the natural increase in CO2 in the atmosphere over that time.
Part of mining coal is rehabilitating the land afterwards so the articles claim coal damages more land is meaningless over the lifetime of the project.
Usually neglected is the increase in local temperature due to solar farms compared to grassland. This increases the driving force to generate storms and extreme weather events. I have yet to see anyone advocating solar farms take account of this.
The loss of production from the farm land now taken over by solar cells needs to be taken into account. This cost alone makes solar arms expensive.
In addition figures for the cost of disposal of panels and the environmental damage to produce the elements needed aren’t usually taken into account.
All this makes solar quite expensive.
Roger, doubling the level of CO2 doesn’t double growth rate. That only applies to certain plants under ideal conditions. Conditions that do not apply to Australian scrub. It definitely does not lead to a doubling of biomass and CO2 sequestered within it. Please look this up and in your next comment apologize for getting it wrong. This is important to show you are capable of learning. If you are not capable of learning, then your comments won’t be helpful to anyone.
Roger Reitze,
“Experiments have shown that there is a roughly linear relationship between growth rate and CO2. Double CO2 means about double the growth rate.”
Evidence/data, Roger?
20 Jul 2022 Reuters article headlined Fact Check-Use of CO2 generators in greenhouses does not disprove impact of CO2 on global warming included:
https://www.reuters.com/article/factcheck-co2-greenhouses-idUSL1N2Z01O0
“Most of the “green revolution” can be accounted for by the natural increase in CO2 in the atmosphere over that time.”
Roger, what “green revolution”? Evidence/data?
The industrial activities that our modern civilisation depends upon have raised atmospheric CO₂ levels by nearly 50% since 1750.
https://climate.nasa.gov/causes/
Relative to the 1880-1920 baseline mean, global mean surface temperatures have steadily risen to +1.1-1.2 °C today. James Hansen & team suggest year 2024 “is likely to be off the chart as the warmest year on record.” See Fig 3 at: http://www.columbia.edu/~jeh1/mailings/2022/AugustTemperatureUpdate.22September2022.pdf
History of atmospheric CO₂, from 800,000 years ago until January 2022:
https://www.youtube.com/watch?v=gbxEsG8g6BA
Roger Reitze,
“Part of mining coal is rehabilitating the land afterwards so the articles claim coal damages more land is meaningless over the lifetime of the project.”
Evidence/data, Roger?
Mine owners don’t always rehabilitate, as Western Sydney University’s water researcher Dr Ian Wright explains in the 23 Feb 2022 YouTube video by James O’Connor titled Mining The Blue Mountains – A Documentary, duration 0:25:50.
For example, Canyon Colliery was closed in 1997, but water discharging from it is still laced with a toxic concentration of a periodic table of elements, including sulfates (29.5), nickel (210), & zinc (370), flowing downstream & into the Grose & Hawkesbury Rivers.
Mines at Sunny Corner, abandoned more than 100 years ago are still discharging a toxic water plume, including sulfates (1,650), nickel (260), & zinc (240,000), that eventually ends up in the Murray-Darling system.
A freshwater high reliability trigger value of 8 µg/L was calculated for zinc using the statistical distribution method with 95% protection. This applies at hardness of 30 mg/L of CaCO3.
https://www.waterquality.gov.au/anz-guidelines/guideline-values/default/water-quality-toxicants/toxicants/zinc-2000
But it seems with tougher environmental regulations and effective enforcement, mine owners can be made to clean their act up, as evidenced with the improved water quality now coming out from Clarence Colliery.
https://theconversation.com/the-stunning-recovery-of-a-heavily-polluted-river-in-the-heart-of-the-blue-mountains-world-heritage-area-176246
“Usually neglected is the increase in local temperature due to solar farms compared to grassland.”
Roger, evidence/data?
“All this makes solar quite expensive.”
Compared with what?
Renewables remain the cheapest new-build electricity generation option in Australia.
https://www.csiro.au/en/news/news-releases/2022/gencost-2022
Geoff Miell thank you.
It is mind numbing amount of the harmful information people quote.
The main driver is big fossil fuel power companies who need to keep their cash flow from a central national grid demand.
Nuclear would be perfect for them as they would need the Federal Government providing the Disaster Insurance and cash flow guarantees for the next 60 years to 100 years.
Cash flow protection from new energy technologies, cheaper technologies.
The government’s sold utilities and tunnels came with government support.
The tunnels came with road closures and oneway streets to stop traffic funnelling away.
Nuclear will be too capital expensive to turn off prior to its pay back and profit yields.
Stephen Brickwood, many thanks.
“It is mind numbing amount of the harmful information people quote.”
I respond to the climate change “dismissives” here at this blog only to let others who may read the comments know there are compelling answers/evidence/data to the apparent (to me) false narratives being propagated.
ICYMI, Canadian atmospheric scientist Professor Katherine Hayhoe tweeted earlier today:
https://twitter.com/KHayhoe/status/1586793478482272257
Prof Hayhoe includes in her twitter thread that:
“The main driver is big fossil fuel power companies who need to keep their cash flow from a central national grid demand.”
IMO, the climate change “dismissives” are useful dupes benefitting the fossil fuel industry.
Geoff Miell thank you again.
Copy and paste your work, as it often comes up and it is mind numbing, going over the same.
I know the writers went to school because they can write.
Remote solar and wind farms also need new fifty metre wide easements through forests and across farmlands for grid connection corridors, then ongoing maintenance of the corriders, poles and wires for the lifetime of the farm. This does impact the calculation somewhat.
The repurposing of the former smelter site at Kurri Kurri as a gas peaking plant is brilliant. The grid infrastructure was already there, and the ground was too toxic to remediate adequately for housing or business park use.
It is good to put TCO calculations together as you have done, don’t get me wrong. 🙂 All too often, advocates on all side are silent on the enabling costs necessary for their preferred technologies.
Francis Young,
“The repurposing of the former smelter site at Kurri Kurri as a gas peaking plant is brilliant.”
Brilliant is not the word I would use. Words like “white elephant” & “stranded asset” come to my mind.
Gas analyst Bruce Robertson, from the Institute for Energy Economics and Financial Analysis, suggests:
https://reneweconomy.com.au/labor-backflips-on-kurri-kurri-gas-plant-but-experts-say-it-still-doesnt-stack-up/
See also Bruce Robertson’s submission to the IPCN re the Kurri Kurri Gas Lateral Pipeline Project proposal at: https://majorprojects.planningportal.nsw.gov.au/prweb/PRRestService/mp/01/getContent?AttachRef=SUB-41960218%2120220501T231627.547%20GMT
There are more than a dozen gigawatt-hour-scale BESSs (e.g. Wallerawang 9, Great Western, Liddell, Eraring, Waratah Super, Orana, Mt Piper, Wooreen, Robertstown, Goyder South, Bulli Creek, Supernode & Collie) proposed or in development, and I suspect there will be more to come.
https://reneweconomy.com.au/big-battery-storage-map-of-australia/
Gas is NO LONGER CHEAP: https://www.aer.gov.au/wholesale-markets/wholesale-statistics/gas-market-prices
Large-scale battery storage is now the superior choice for electricity peaking services, providing significant cost, flexibility, and emissions advantages when compared to equivalent open-cycle gas turbine plants.
https://www.cleanenergycouncil.org.au/resources/resources-hub/battery-storage-the-new-clean-peaker
I suspect that big community batteries may be very popular and difficult to source.
Gas is the least cost remaining option.
And is the only peace offering to the bitter failed fossil fuelled generators
Stephen Brickwood,
“Gas is the least cost remaining option.”
Compared with what?
Gas from where? See the AEMO’s 2022 Gas Statement of Opportunities, dated Mar 2022, particularly Fig 3: Actual and forecast maximum daily production capacity from south-eastern gas fields (excluding LNG imports), 2020-26 (TJ/d).
Gas analyst Bruce Robertson at IEEFA, told the IPCN regarding the then proposed Narrabri Gas Project, at a public hearing on 23 Jul 2020 (from the Day 4 transcript, p72):
https://www.ipcn.nsw.gov.au/resources/pac/media/files/pac/projects/2020/03/narrabri-gas-project/public-hearing/transcripts/200723-day-4-narrabri-gas-project-public-hearing.pdf
What are the impacts to carbon emissions during the manufacturing of solar panels and “harvesting” the materials needed to produce the panels? Is that figured into the carbon footprint of solar panel impacts? The production is primarily in China, without the scrubbers on their stacks to control carbon emissions?
What about the impacts to habitats?
I’m just wondering how you calculate footprint of less than 10 square kilometers per gigawatt of capacity? I had a quick look at the footprint of some existing solar farms in Australia land it was mostly around the 50 sq-km per gigawatt mark. The best I could find was 35 sq-km. I think you’re out by a factor up to five.
Not saying this invalidates the over-all conclusion: The blob above 3 to 5 times bigger is still pretty small compared to the size of the country. Just think its equally important not to over-sell it and be realistic.
It was an estimate of only the ground covered by solar panels and inverters, but even allowing for that, you are right that it was much too low for Australia’s existing solar farms. I’ll add an update to the article pointing out the space taken up should be considerably larger. Thank you for pointing out the mistake. Much appreciated.
I don’t have fancy data to add here, but I will say that all the solar farms in my area, and others I have seen further west and south have been / are all built on land that had been previously cleared for grazing/cropping so no ‘old growth’ or any other growth cleared at all. In the grazing areas sheep can still be run in those paddocks (cattle are a bit big and bullish for low-mounted panels to withstand). Thanks for this information and I laughed at the ‘Evil Solar Farm’ analogy. Coal Power is such unsustainable old rubbish tech now.
The alternative to using “farm” land for solar farms is floating solar. This seems ideal for Australia. Amongst other benefits it reduces evaporation from reservoirs (typically 1.5m per year). The technology was developed in Australia many years ago but went “offshore” and is now being implemented on a huge scale in Singapore and nearby countries. The World Bank is encouraging the technology.
Some concept notes are here:
http://vdrsyd.com/mp/floating_solar.html
Good work but, and it is a big but…
Calculation needs to include power line corridors to access these installations. Huge amount of land clearing, often in reserves and National Parks.
Why must you degrade your research by comparing solar generators to coal-burning generators? Everyone knows that coal is dirty, so compare solar with gas-fired plants, will you!
Then, no one has complained about the CO2 released when clearing land, yes, we know it’s not much. What is a worry is the choking of the land by the panels so that no more CO2 can be absorbed!
Rooftop empty real-estate is the cheapest area for PV panels.
NO GRID UPGRADE REQUIERED.
Consumer below.
20million roofs in Australia. All behind the meter box.
The existing grid cost $TRILLIONS. Fragile and light weight because it is so expensive to expand.
Double the consumers normal usage and the consumer grid load is removed, and the same amount is available for heavy industrial users moving away from fossil fuels to the clean feed in PV electricity.
The grid owners cashflow is protected, $TRILLIONS saved on grid capacity upgrade construction.
I meant double the amount of rooftop PV kW
In searching using the combination of the two terms “agrivoltaics” and “cattle”, I found many results, including this;
https://ourlandandwater.nz/wp-content/uploads/2023/08/Agrivoltaics_Report_OLW-RPF23.pdf
see the section with the heading “2.2 Sheep and Beef Farm Case Study”, including, especially, the “Key Findings” in that section.
One prospect that has occurred to me, regarding agrivoltaics and cattle, and, the perception that cattle are too big to run in agrivoltaics, is the use of mini-beefs; breeds such as lowline, redline, and mini-herefords. Then, also, the panels would not have to be mounted so high. The only problem that I see with that prospect, is the difficulty in sending the mini-beefs off to be slaughtered; mini-beefs, especially mini-highland cattle, and mini-herefords, are simply to cute to kill (I can’t eat that – they look so cute when they are alive…).
As an update, I have collected several aerial views of coal mines and coal-fired power stations that illustrate the vast areas “consumed” by these projects:
https://vdrsyd.com/mp/greenhous.html#aerial_coal