
Current testing standards have been called into question after new research indicating 20% of solar panels tested in a study had 1.5 times worse than average degradation rate.
Why Do Solar Panels Degrade?
All solar panels degrade over time. This is largely due to natural wear from environmental factors such as ultraviolet rays, heat, humidity, salt, temperature changes (causing expansion/contraction, microcracks), wind and inherent chemical changes.
This leads to gradual (and should be small) annual efficiency losses over a panel’s lifespan. A permitted maximum annual loss is noted in the panel’s performance warranty (more on warranties below), which are usually 25 – 30 years.
Then there’s those modules that degrade more and faster than they should through manufacturing flaws and poor quality control. Or fail totally, prematurely.
What Did The Research Discover About Solar Panel Performance?
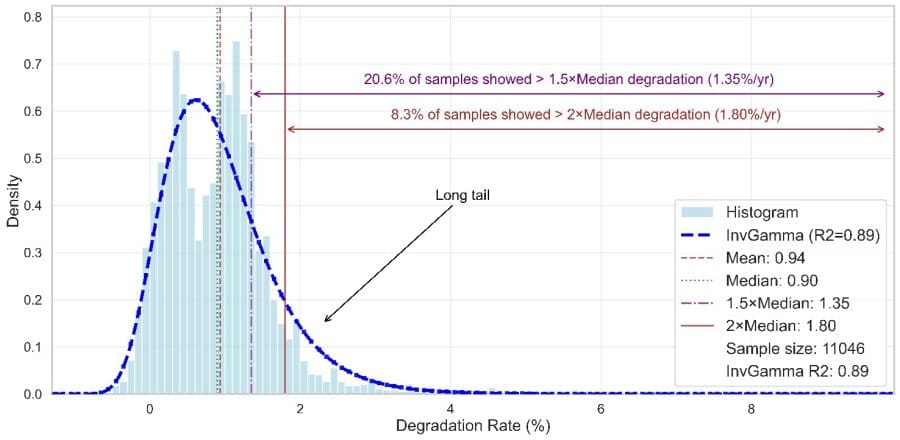
Researchers from UNSW’s School of Photovoltaic and Renewable Energy Engineering analysed information collated previously; obtained from nearly 11,000 different photovoltaic samples globally. They observed a so-called ‘long tail’ in the probability distribution of performance data; indicating that up to 20% of all samples perform 1.5 times worse than the average.
“For the entire dataset, we observed that system performance typically declines by around 0.9%1 per year.” said Yang Tang, one of the authors of the paper on the subject. “However, our findings show extreme degradation rates in some of the systems. At least one in five systems degrade at least 1.5 times faster than this typical rate, and roughly one in 12 degrade twice as fast.”
This has big implications for the useful service life of such panels; which could be closer to 11 years — long before the 25 – 30 years of a warranty ends.
“Or, in other words, they could lose about 45% of their output by the 25-year mark,” Tang said.
3 Major Reasons For Panel Failure
There were three major reasons for failures in the long tail group:
- Interconnected failures where different types of problems can interact with each other; e.g. backsheet damage resulting in corrosion damage.
- “Infant mortality” where fairly new panels have critical manufacturing defects or material flaws not picked up in quality control . They tend to have a slight recovery and slower degradation rate after the initial period of installation.
- Minor flaws that may not cause a problem initially, but then result in a sudden severe performance loss at a random point in time.
The researchers stress the accelerated degradation was not related to the climatic conditions the solar panels were exposed to. There were no samples installed in extreme environment locations such as very hot deserts.
What Does The Study Hope To Achieve?
Dr. S. Poddar, co-author of the paper, says it’s time to think about new testing standards as current standards only report on several parameters. These are a module’s response to mechanical stress, extreme temperatures, and exposure to ultraviolet radiation — as well as often testing for humidity and response to a standardised amount of sunlight (AM1.5 spectrum),
“But when they are actually operating in real-world conditions there are so many different factors coming into play, and those cascading failures can be very significant,” Poddar said.
The team would like even more data from large-scale solar farms and to understand different factors contributing to module failures in different climate types.
“Thirdly, testing authorities should be informed of real-world degradation patterns across diverse climates and consider combining stress tests to better replicate outdoor operating conditions.”
The UNSW study has been published in the IEEE Journal of Photovoltaics.
Product Vs. Performance Warranties
Solar panels come with two different warranties. There’s the product warranty covering materials and workmanship (often 25 years). Then there’s the performance warranty that guarantees the system will not degrade beyond a certain point each year for whatever number of years; usually 25 – 30 years as mentioned.
For example, the JA Solar Deep Blue 4.0 Pro 440-Watt solar panel has a product warranty of 25 years and a 25-year performance warranty. The warranted annual performance degradation for the first year is 1%, and for years two to twenty-five, 0.4% loss each year. This makes for a power output warranted at year 25 of 87.4%.
You can check out the product and performance warranties of a bunch of models on the SolarQuotes solar panel comparison table.
On a related note, last week we published an article on solar panels installed in the 1990’s undergoing performance testing that indicated maximum degradation levels stipulated in their long performance warranties were realistic. However, those researchers (a different team) mentioned the degradation paths seen in the advanced solar cell technology nowadays were not present in the old solar panels tested.
Choosing Solar Panels
Australians are spoiled for choice of solar panels; and spoiled with low prices. The Clean Energy Council’s approved modules list contains over 1,500 solar panel models meeting international standards – IEC 61215:2021.
And at the pricing for good quality gear these days, there’s just no reason to skimp — there are plenty of solar panels in the budget price range.
But how to find them?
You could use the SolarQuotes comparison table as already mentioned, but an easier way to start looking in the right direction is the SolarQuotes recommended solar panel brands table; as any of those manufacturers should be a safe bet. There are also recommended brands tables for inverters, home batteries, EV chargers and heat pumps on that page.
Footnotes
- That .9% is still much higher than the annual permitted degradation rate noted in the warranties of major solar panel manufacturers, which is usually in the range of 0.25% – 0.55% per year in years 2 – 25. ↩
 RSS - Posts


Having a warranty is all fine, but how do I test the performance of my, let’s say, 5 year old system if I suspect it’s not performing as it should? The panel manufacturers do not need to honour a warranty if I cannot proof something is wrong.
Hi William,
All modern solar systems have a monitoring platform that records performance.
If you compare the first year’s performance to those following you can track degredation.
https://www.solarquotes.com.au/blog/dont-ignore-solar-monitoring/
I wouldn’t say this is a good way to achieve this due to many variables particularly weather. Undetected micro crack from damage or transport/install (linking to an article you guys did on hail resistance of panels testing)
The true way to test this would be to isolate a panel and measure its output post a decent clean in direct sunlight to see the independent panel production and then convert that into a percentage of initial performance.
Keeping in mind panels have generally a positive power tolerance (good ones anyway) this will likely hide / cover things until at least the 5 year point if degradation is expected as per this article.
Of course I DO NOT recommend the home owner to do this. Electrician or solar business service department would be the ideal.
One issue is that panels rarely fail 100%. An example is a Hailstorm I suffered some years ago: I had microcracks in the PV cells that were only evident some months after the event.
Because these are on a SolarEdge system (an inverter I would no longer buy for political reasons), I can monitor the performance of each panel. The cracks reduced the output by about 25%. Still use them until total failure They are now ´extra.´ panels, so not associated with overall performance. It is easy to add extra panels to strings in SolarEdge systems. If a panel fails, the Optimiser effectively bridges the panel.
String inverters act differently. One can still use optimisers on compromised panels such as shading issues. tho they seem to be not used as much now.
I agree with your views Andrew!
Just looking at yearly output stats is useless and show you why below:
My system had for the first 3 years 10kW peak northerly direction installed and returned in average per day
Year 1 – 50.2 kWh
Year 2 – 49.8 kWh
Year 3 – 51.8 kWh
Year 4 – 53.2 kWh
Year 5 – 49.1 kWh
These results show absolutely no trend.
Then I added another 10kW peak in East/West and got for the new ones these averages per day:
Year 4 – 48.1 kWh
Year 5 – 43.9 kWh
There is a significant correlation in years 4 and 5 for the old and new panels, so I guess there was simply less sunshine. They both dropped by about 9% year on year.
Other than that, it shows that degradation cannot be determined at all using solar system stats! Unless the system stops working altogether, there is no value in trying to measure degradation. Concentrate on failure.