
Last week, monitoring software company Solar Analytics announced they can monitor solar consumption in homes without a consumption meter.
The announcement is here, and it is a genius move. But to explain why, I need to go back to basics…
If you buy a rooftop system from any decent solar installer, it comes with solar generation monitoring1. But basic solar monitoring only shows you the output of your solar panels.
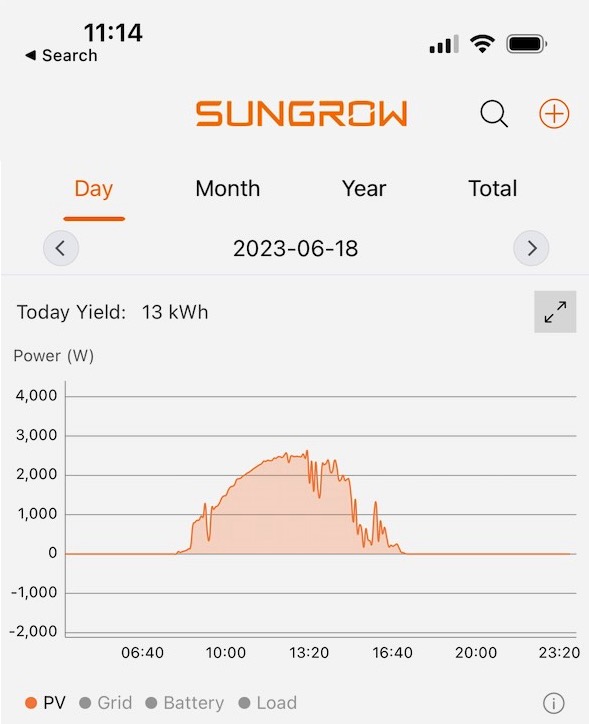
Solar generation on Sungrow’s app
Prior to Solar Analytics’ announcement, to measure anything other than solar, you needed an additional device in your switchboard – a consumption monitor.
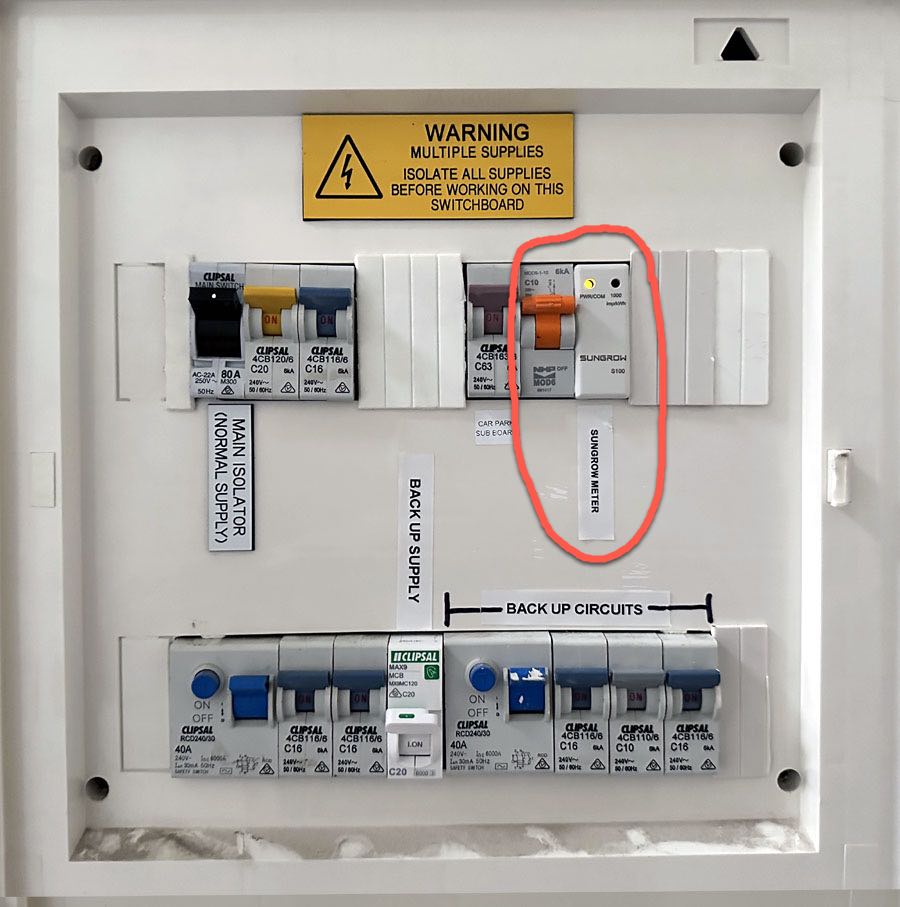
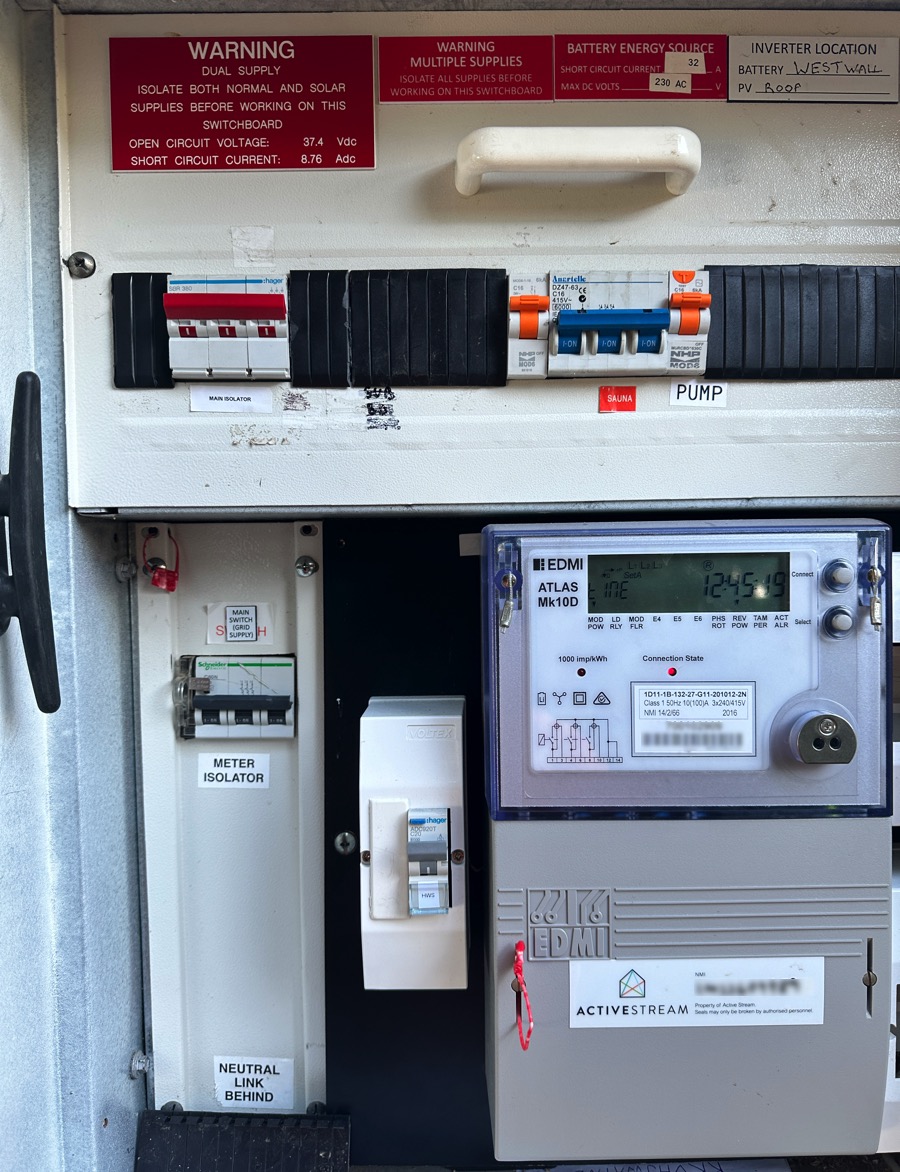
A single-phase Sungrow smart meter and its breaker in the switchboard. It monitors power to and from the grid.
The consumption monitor reports the power flow to and from the grid. It sends this data to your inverter, so the inverter’s monitoring app can provide you with all the information you need to understand not just your generation, but your consumption:
- When exporting to the grid: The difference between how much power your solar is producing and how much power is flowing to the grid is how much solar is being consumed in the house.
- When importing from the grid: The sum of how much power your solar is producing and how much power is flowing from the grid is how much solar is being consumed in the house.
Here’s Sungrow’s app reporting consumption and generation:
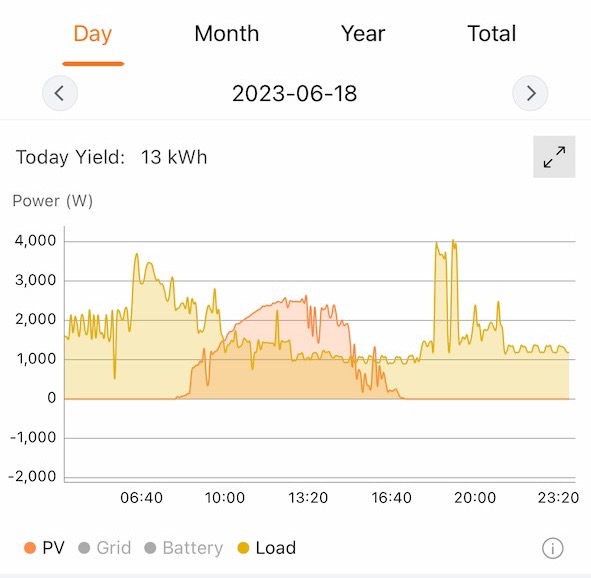
With a consumption monitor, the Sungrow app can show you the home energy consumption (yellow) overlaid with the solar (orange). Why the hell didn’t they make solar yellow?
The inverter manufacturer usually supplies the consumption meter, typically costing $200 for a single-phase home and $400 for a 3-phase home, plus installation.
Adding a hardware consumption meter typically adds at least $500 to your solar system price, much more if your switchboard needs upgrading to fit the meter.
But Everyone Already Has A Big-Ass Consumption Meter In Their Home…
One thing that has always frustrated me is that every Australian building with a grid connection already has a calibrated, reliable, revenue-grade consumption meter: your retail electricity meter:
Your electricity meter already measures your consumption.
And almost all solar homes have a retail meter with a secure communications link built in – the infamous ‘smart meter’, plaything of many conspiracy theorists.
The fact that this meter can’t talk to your solar inverter is crazy. But one thing has changed that. And that thing is called the ‘Consumer Data Right’.
Consumer Data Right To The Rescue
The Consumer Data Right (CDR) is a government initiative allowing you to access your retail electricity meter data.
Solar Analytics realised if they combine the data in the retail meter (which is simply how much energy you’ve either sent to or taken from the grid every 15 minutes.) and mush it together with your inverter’s solar generation data, they can give you consumption monitoring through software – no extra hardware required. They call it “Solar Analytics Integrated+”.
How ‘Solar Analytics Integrated+’ Works
The Solar Analytics server talks to both your solar inverter and your retail electricity meter – it synchronises the timestamps and subtracts the grid export data from the solar generation data to show you the power flow in your home.
The one big drawback: it’s not real-time.
The way CDR works is you can only ask for your meter data once daily. That means this meter-free consumption monitoring is always 24 hours behind. You can only see yesterday’s data, so you can’t use it to adjust your behaviour in real time. For example, it can’t answer the question: “Is there enough excess solar to use the car charger right now?”.
You can only use Solar Analytics Integrated+ to make decisions in retrospect. But that’s still pretty handy.
For example, you can answer the following questions:
- What electricity plan will be cheaper for my unique consumption?
- Will a battery be worth it based on my current consumption patterns and grid electricity pricing?
- How can I change my consumption to maximise solar self-consumption?
- How can I change my consumption to avoid peak tariffs?
- Do I need more solar?
The other thing to realise is that Solar Analytics Integrated+ will be more expensive over the long term than hardware consumption monitoring from the inverter manufacturer.
On a single-phase house, you may save $500 in consumption meter installation and hardware by choosing Solar Analytics Integrated+. That will buy you a ten-year Solar Analytics subscription2. So after 10 years you’ll be ahead with the hardware3.
But you may be thinking of subscribing to Solar Analytics anyway (in fact, I highly recommend it4). In which case, you need to decide if saving $500 is worth it to be without real-time data. The decision is easier for 3-phase homes who can save closer to $1000 on hardware and installation.
My Recommendation
If You Are Buying Solar Only
I think – for most Aussie homes – investing in a solar power system without a hardware consumption monitor is short-sighted. If you want to understand your power flows – nothing beats seeing the power flow in real time. And if you understand your power flows, you’ll have lower bills.
If You Are Buying Solar + Battery
If you are buying a battery with your solar – then you are getting a consumption meter anyway – the battery requires it. You can use your inverter manufacturer’s app to monitor your solar, battery and consumption.
If you want the extra features of Solar Analytics and have a compatible inverter5, you can connect Solar Analytics via the cloud. If you have a non-compatible inverter brand, you must install a Wattwatchers device to drive Solar Analytics.
If you are Buying a solar power system in SA or QLD with Dynamic Exports
Dynamic exports (also called Flexible Exports) gives you a variable 1.5kW-10kW export limit.
If you are buying solar in SA, you must enroll in Dynamic Exports if it’s available in your postcode.
If you are buying solar in QLD, you can choose to avail yourself of Dynamic Exports.
You’ll need a hardware consumption monitor in either state to make Dynamic Exports work. So my advice is to choose a Solar Analytics-compatible inverter. If you don’t dig the built-in real-time monitoring, you can upgrade to Solar Analytics at any time without any extra hardware.
If You Have An Existing Solar System.
If you want the extra features of Solar Analytics for your existing solar, Integrated+ is a great way to add Solar Analytics with zero hardware cost.
You can even sign up for the 30-day free trial, and see 3 months of historic insights, including solar system performance (0-100%), the cheapest electricity tariff based on your consumption and exports, and potential battery payback, then cancel before you pay a thing.
Using Your Retailer’s Portal To Look At Your Retail Smart Meter Data
The good news: most retailers now let you see your smart meter data through their billing portal.
The bad news: It’s basic.
Let’s look at AGL’s Portal – one of the best retailer portals I’ve seen.
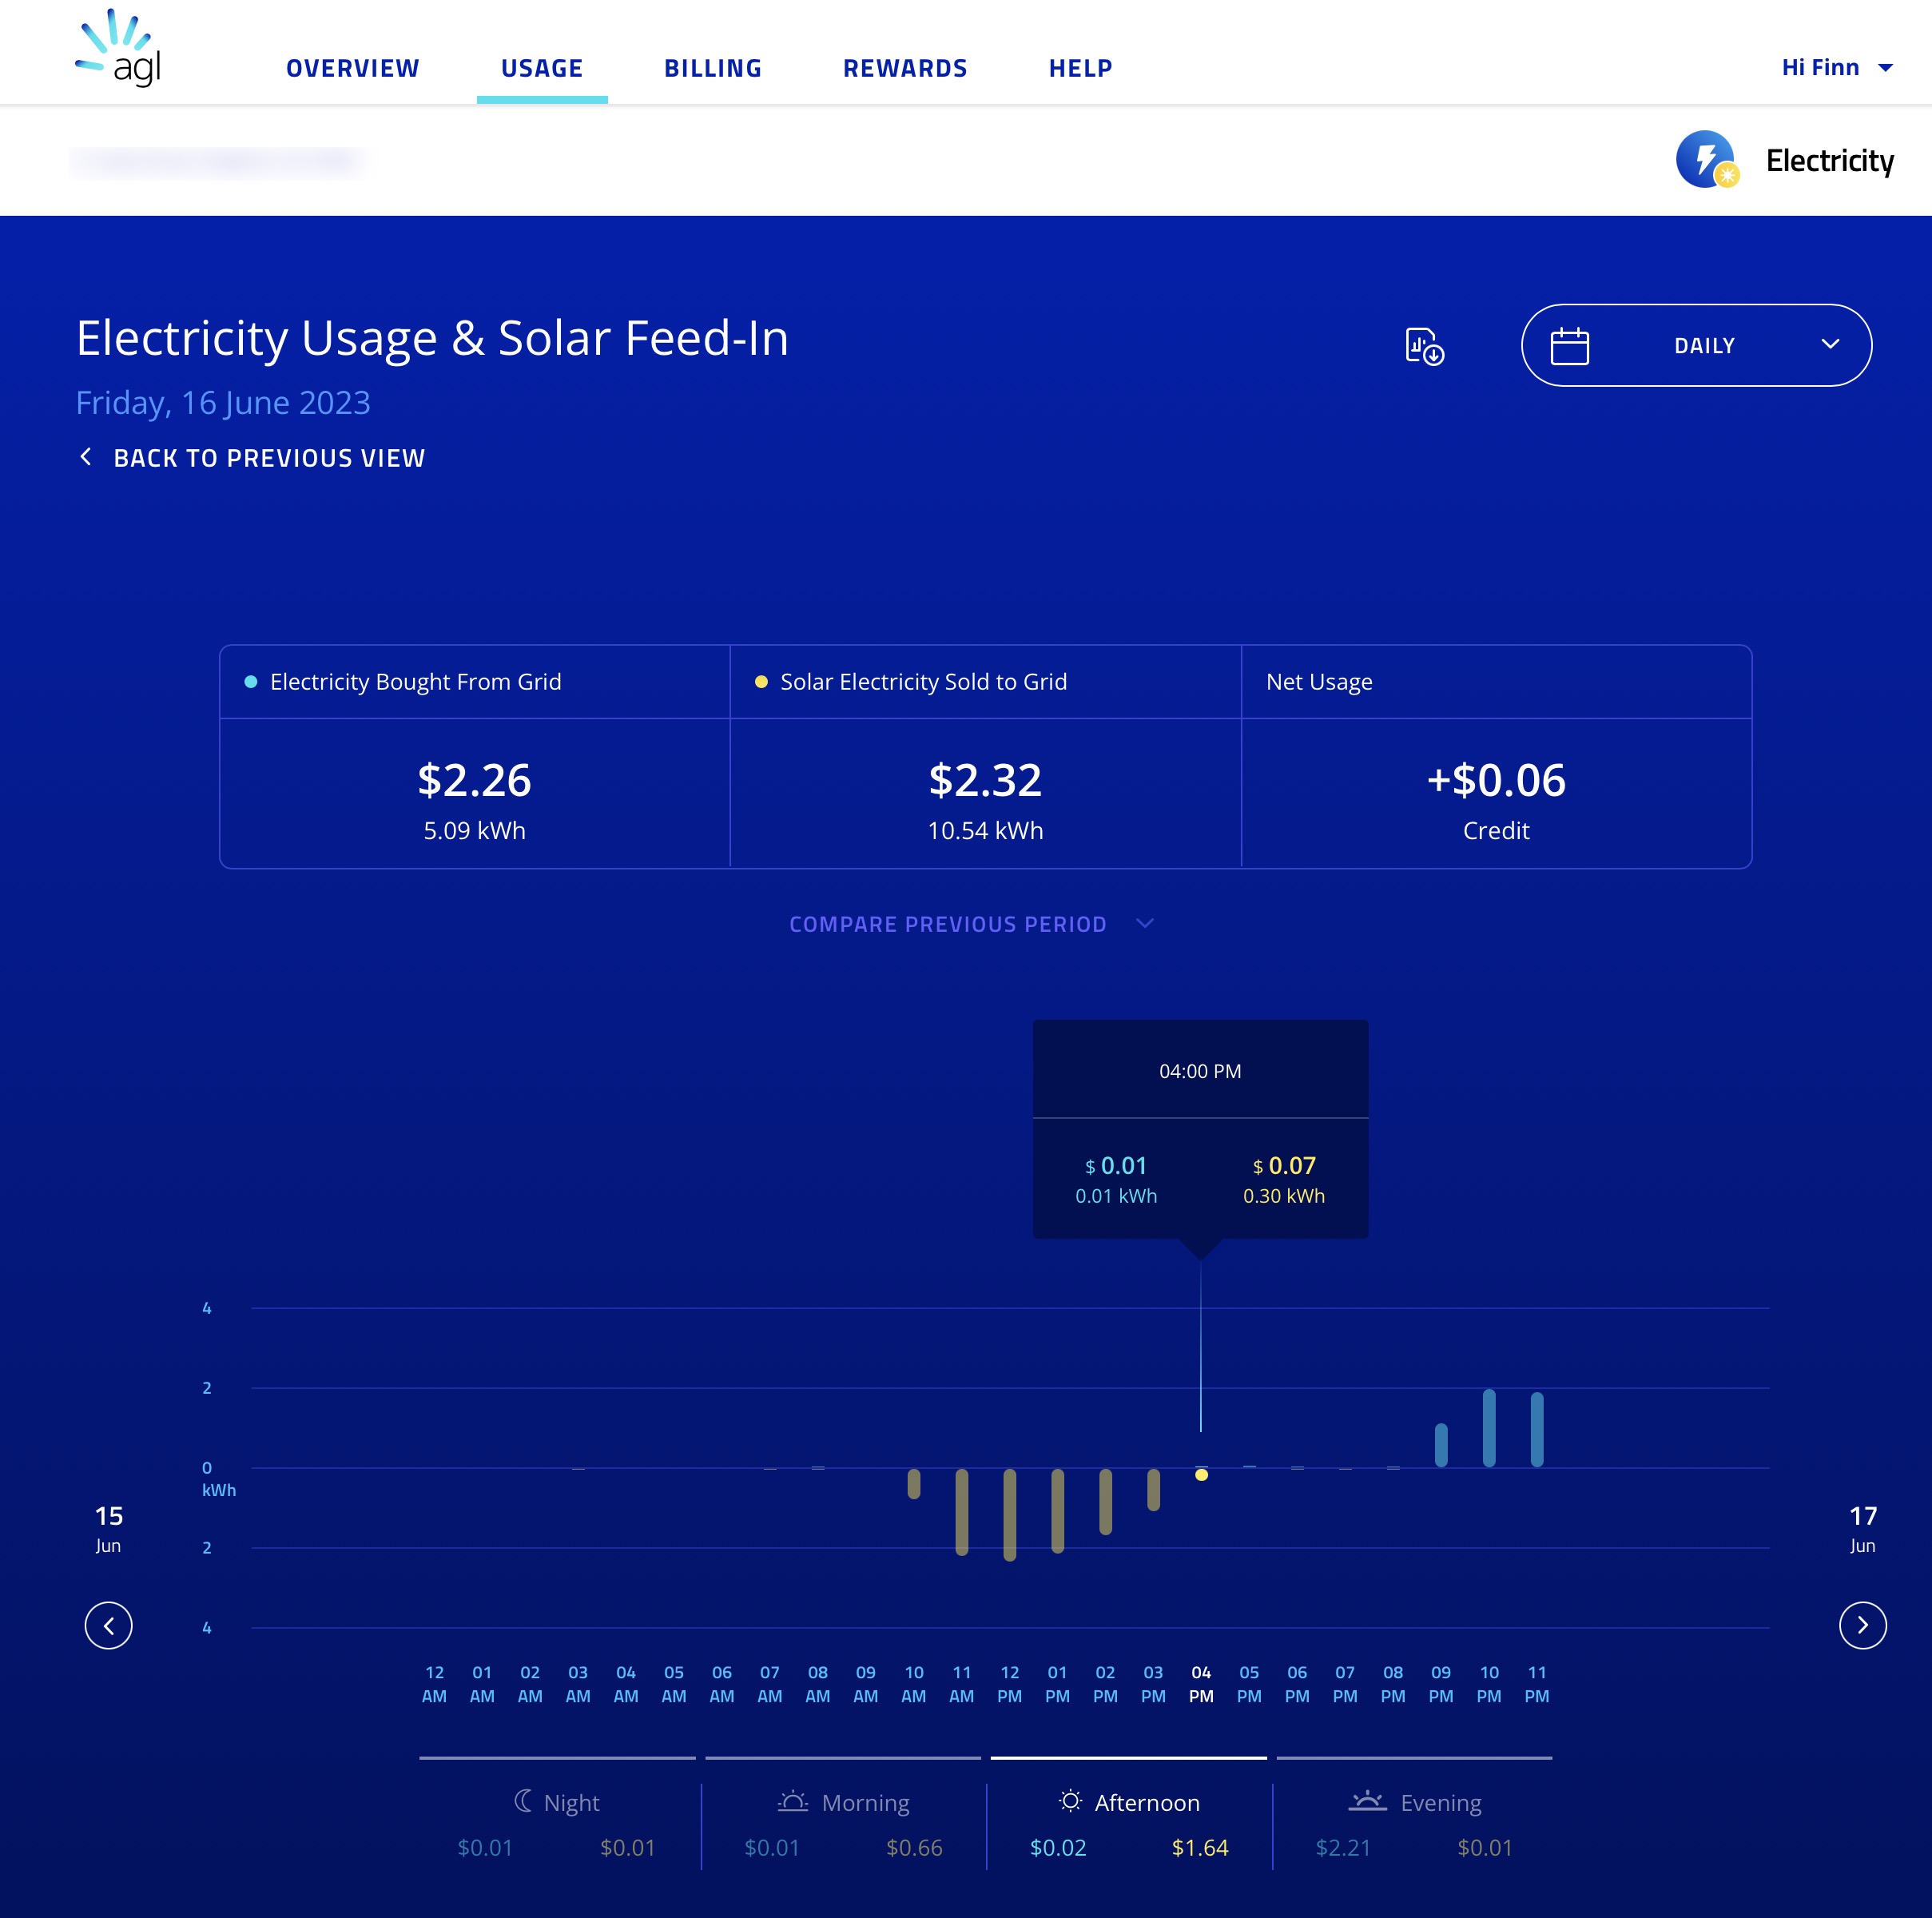
AGL show grid usage and solar exports at a resolution down to one hour. This example is from a house with a solar and battery and is a good example of how much detail you lose when you don’t combine the import and export data with the inverter’s solar (and, in this case, battery) data.
For most of the day, the portal shows zero usage – because all the internal consumption is ‘behind the meter’; the home’s energy is all supplied by the solar and battery.
The home only starts drawing grid power at 9 pm, when the battery runs out.
AGL’s Solar Status Feature
AGL’s portal also has a ‘Solar Status’ feature. It looks at the yellow bars above and gives you a traffic light status for your rooftop solar’s health:
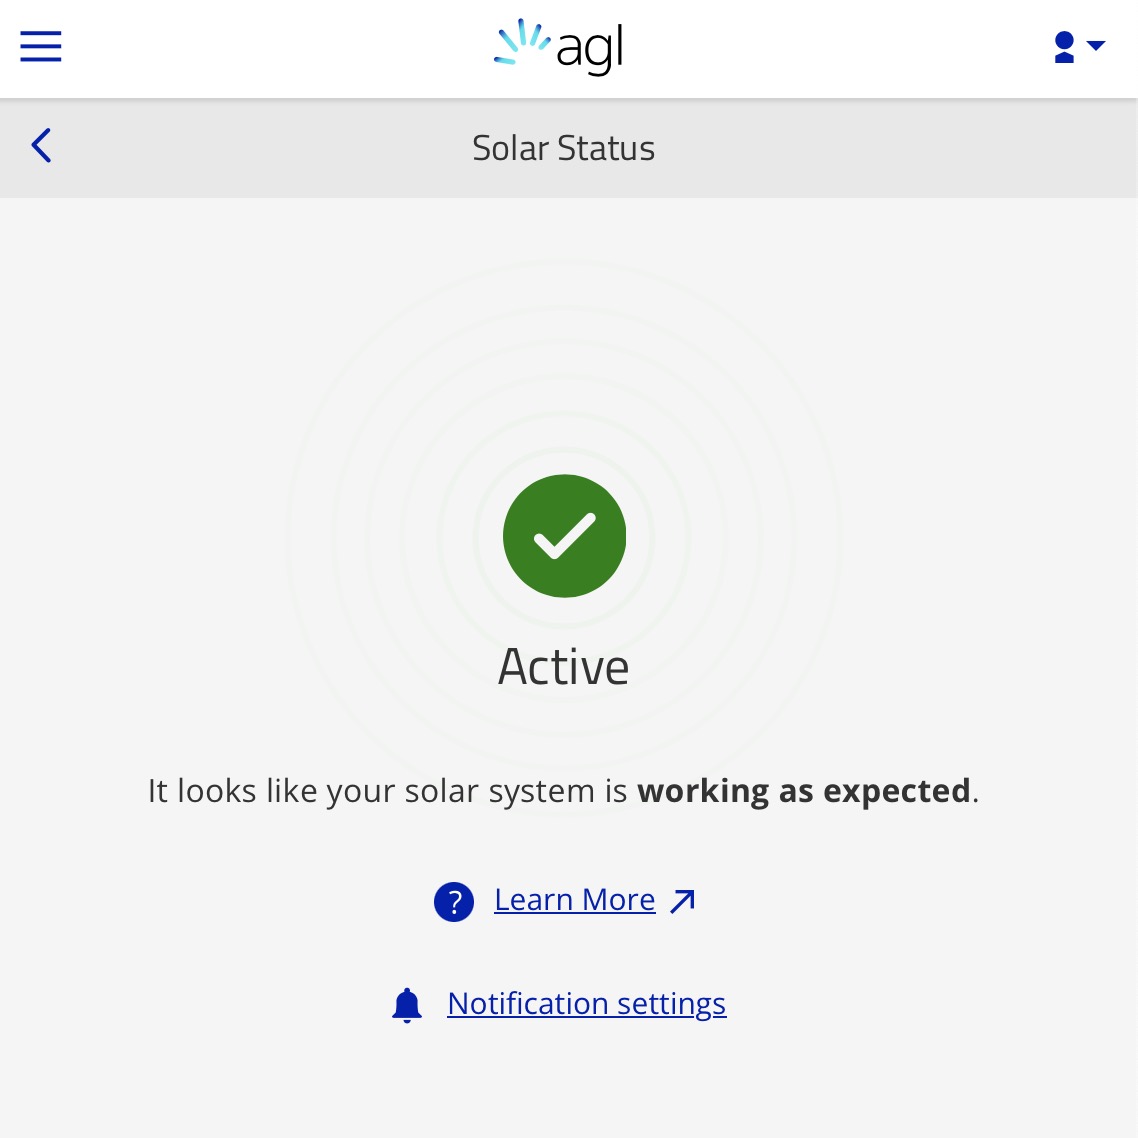
It’s pretty useless, though. And that’s because AGL can only see solar exports at the meter – not total solar generation. So although AGL thinks my system is working great, for the same solar system Solar Analytics is reporting ‘mild underperformance’ at 75%.
Your portal can likely assist you in understanding your grid usage and exports, depending on your electricity retailer, but it lacks the analysis features of a product like Solar Analytics. And AGL is never gonna alert you if another retailer has a cheaper plan!
DIY Retail Meter Data Analysis
Finally, if you have a retail smart meter, you can get 12 months of free meter data without Solar Analytics. This data will tell you how much energy you used every 15 minutes for the previous 12 months. That’s handy because it covers all the seasons.
You can download or request the data from your Distributed Network Service Provider – not your energy retailer – and I show how get your smart meter data for every DNSP in Australia here.
When you get your data, it should be in a CSV file. If you load it into a spreadsheet, it will look like this:
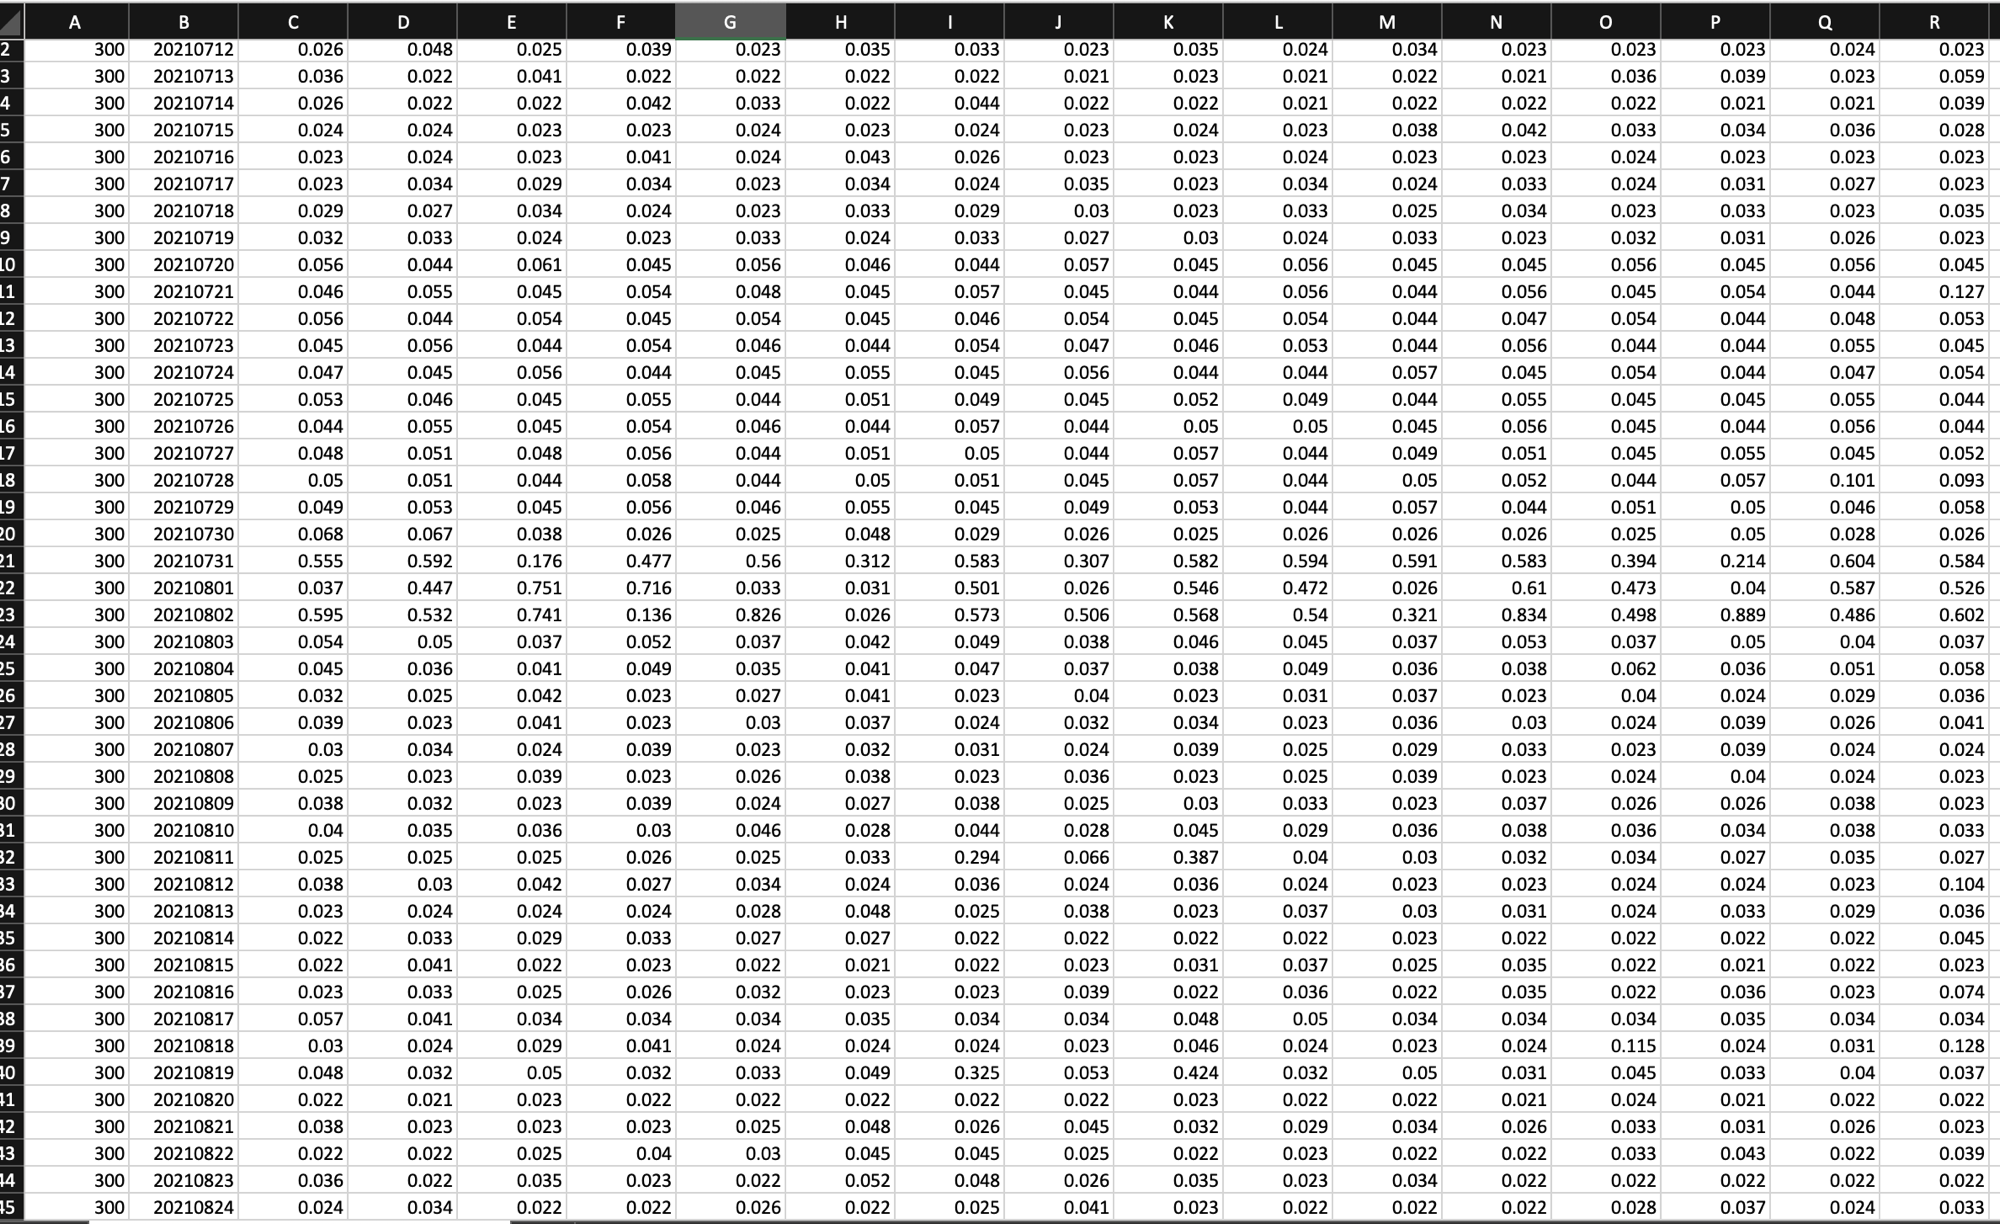
Not very useful.
My favourite, free tool to analyse the data is MeterKloud. Drag your CSV file into the tool, instantly giving you many insights:
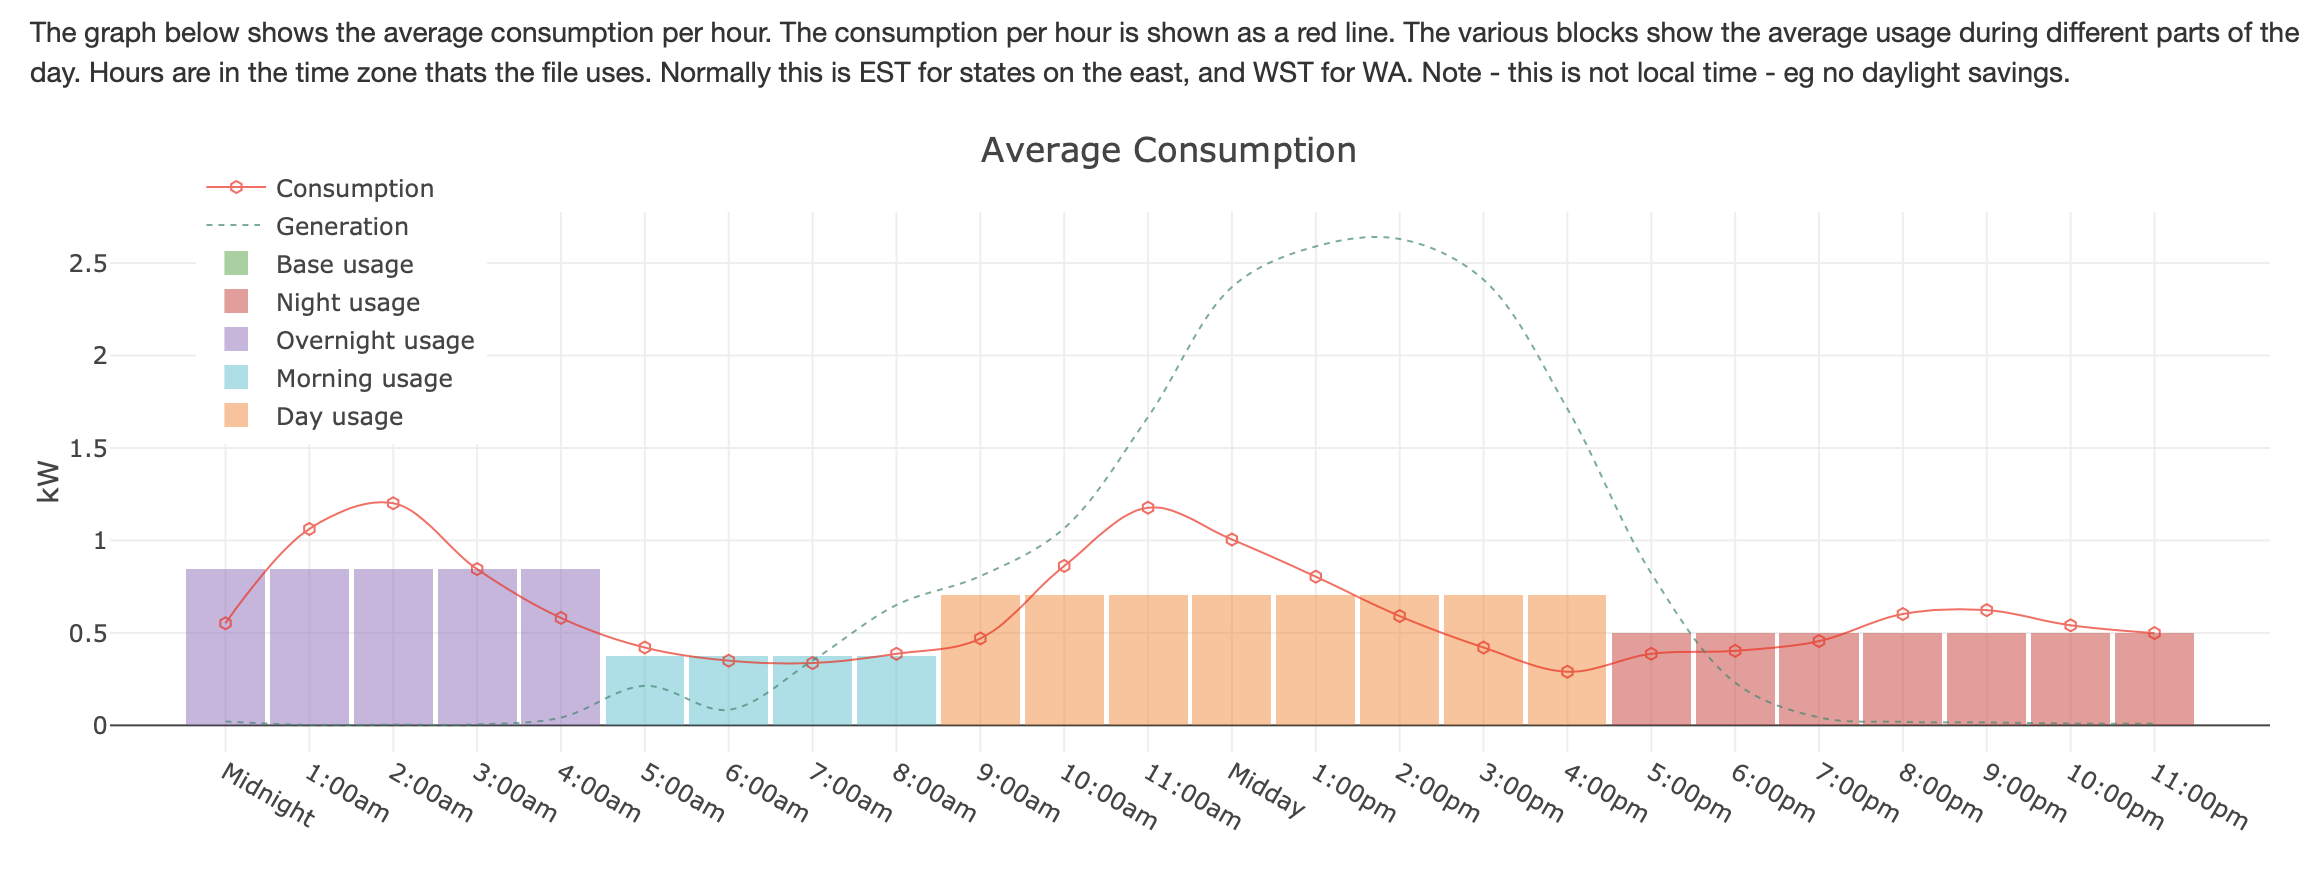
My favourite graph for solar owners is this one – which breaks down your seasonal and weekend/weekday consumption: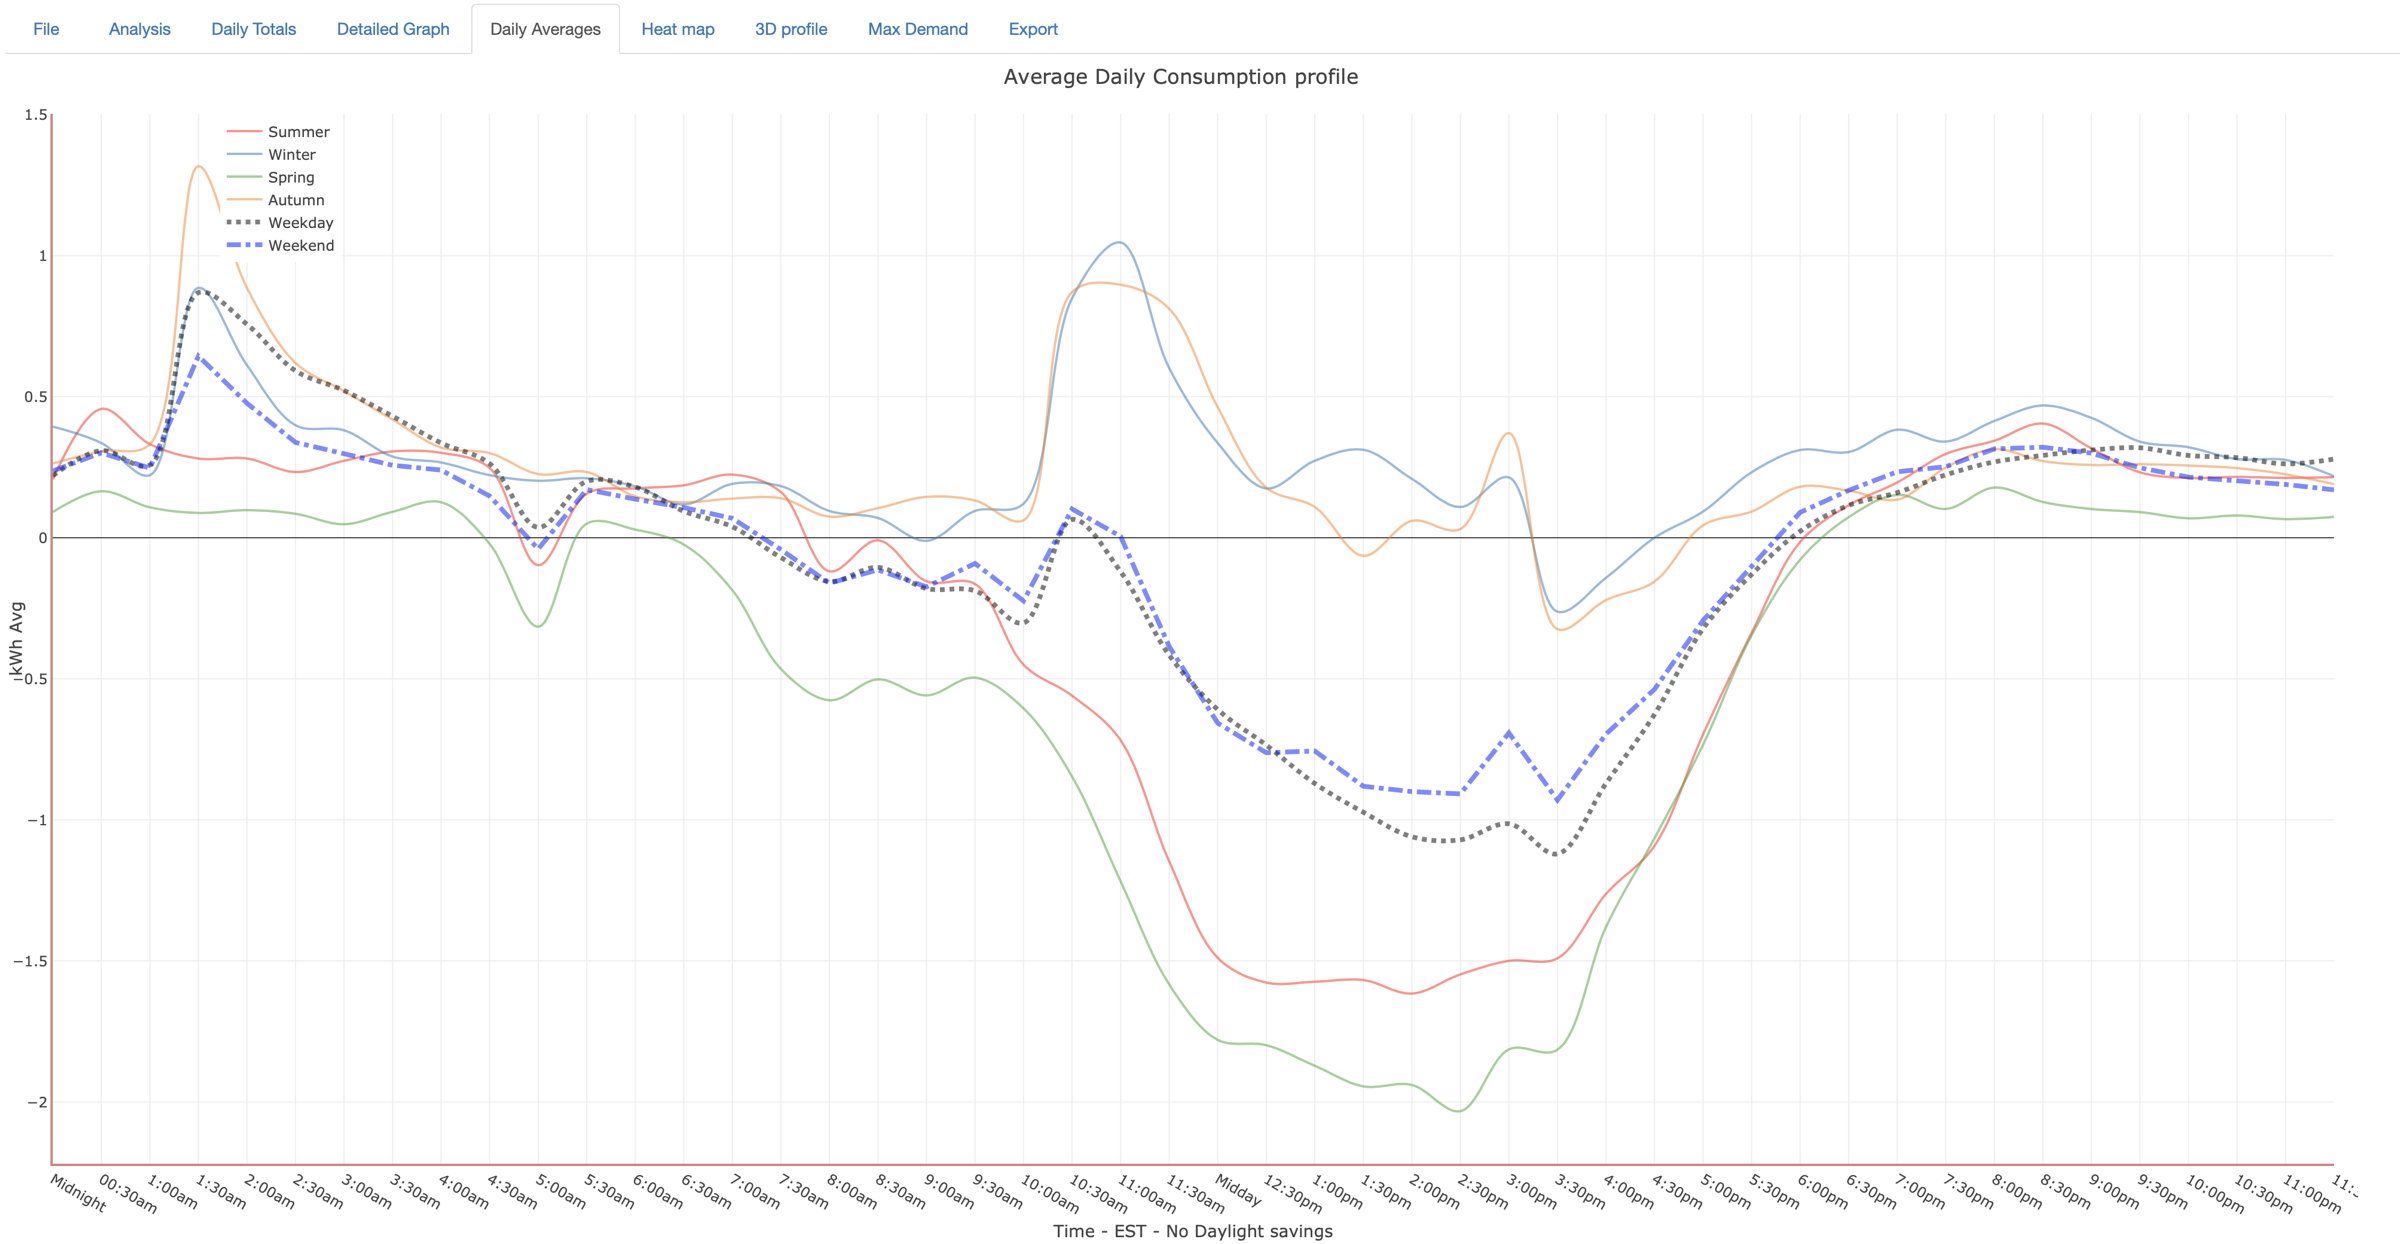
Summing Up
So, Solar Analytics has cooked up a way to track your solar power usage without an extra device in the switchboard. It’s pretty cool because they’re just using data from your existing electricity meter and solar inverter, mashing it together, and boom – you get to see how much energy you’re using and where it’s coming from. You also get alerted if your solar is underperforming, if it’s time for a battery, and which retailer will give you the lowest bill.
But, it’s not all rainbows and sunshine. The downside is that it’s not real-time. You can only check yesterday’s data, not what’s happening right now. Plus, it could cost more in the long run than traditional hardware monitoring.
Is it worth it? Depends on what you need. If you need to see your power usage in real time, you’re better off with a hardware monitor.
If you just want a one-off analysis – then DIY it with your DNSP’s meter data and the amazing MeterKloud tool.
But if you’re looking to understand your solar usage better, without having to install extra kit, and you have a compatible inverter, then at the very least, it’s gotta be worth checking out the free 30-day trial – you can always cancel it on day 29.
Footnotes
- If you buy rooftop solar from a crap installer, be careful. Often their idea of installing solar monitoring is sticking the WIFI dongle in the el-cheapo inverter’s USB port and going home, leaving you to configure it. ↩
- or only 5 years if your system is over 15 kW, but that’s unlikely on single-phase ↩
- assuming it is still working and you haven’t had to fork out for a replacement ↩
- just don’t buy a lifetime subscription if you are offered it! ↩
- Goodwe, GE, Sungrow, Fronius ↩
 RSS - Posts


Another fantastically useful article, thanks Finn.
I use the Powerwall app, and also have the Enphase monitoring software, though my installers said I would rarely use that, the Tesla app would become my go-to. And that proved to be right. The only thing the Enphase app offers in addition that I can remember is data about energy generation by specific panels, and monitoring of specific panel failure.
I think the Tesla app is superb, is there much it’s missing? My retailer’s (Origin) app is also superb, though isn’t real-time and the most granular level is per day, retrospectively. It also hasn’t yet buying in monitoring of costs during a billing period, though they’re apparently working on that, right now you can only monitor kWh. Thanks for the link to the csv processing online tool, I’ll plug my Origin data into that.
People: please don’t stick your finger into a switchboard. The electrician who installed the Sungrow meter should have put a pole filler (cover) over the gap to prevent this. Its the law
Don’t worry Jeremy, this was halfway through the installation of the battery, and the finger belongs to a professional. I’ve updated the picture to show the finished job – so you can sleep at night.
How can we trust Solar Analytics after their decision to dump lifetime subscription customers? Sorry but I struggle to believe any promise they make. Too large of a trust deficit.
I fail to see the point of paying for non-real time data I can already get for free?
Alex, the 3g issue is frustrating, however it is entirely out of Solar Analytics control that Telstra is shutting down the 3g servers. Similar to when 2g was shutdown, many mobile phones and other devices became redundant. The Solar Analytics lifetime subscription was always the lifetime of the hardware itself, not the lifetime of the owner. How can you trust them? Well they no longer offer lifetime subscriptions and are moving towards software integrated solutions like this that aren’t reliant upon a cellular signal. Regarding why would you pay? Getting the data for free from your retailer is useful, however isn’t user friendly and a key detail, it doesn’t show what you are producing. Only whether you were importing or exporting.
4g was and still is available at the time i purchased my system yet i was sold a 3g unit, no other options offered, really annoying. The Solar Analytics system was brilliant, but I cant help but feel ripped off
What do you mean dump lifetime subscription customers? ( I am one, but I’m not aware of any dumping!)
https://www.solarquotes.com.au/blog/solar-analytics-lifetime-subscriptions/
^^ Scott, the above covers the whole thing (issue) nicely.
Why don’t inverters look at Powerpal or equivalent and get real time meter data via Bluetooth?
What about Powersensor? Costs $300, gives real time data every 30 seconds, can be self installed as one sensor just wraps around the output cable from the inverter and another is put in the box near the meter.
Good point Robert
My Sungrow app is useful to get a rough idea of the current generation/consumption situation and historic data going back years (unlike Fronius which makes you pay to access that information).
However I also find Powersensor very useful to help me see real-time solar generation + consumption data and use that to decide which appliances to adjust / start / stop etc
I have their old service which is useful to track total savings but this new solar analytics service doesn’t seem of any real value to me
Hi Finn
What about SolarEdge and their inverters with built-in smart meters or even their wireless one? Considering buying that inverter and that’s what the salesman from the solar company has talked about.
Neo
Inverter smart meters are not only used for looking at consumption/production of your household/solar. They’re also used to limit the amount of energy exported to the grid and wind the output of the inverter down so the export limit set by your DNSP is not exceeded. Most solar installations greater than 5kW basically require a smart meter to be installed as the export limit set by most distributors is 5kW per phase unless you pay to have a separate agreement made.
Unfortunately we wont be installing anything solar analytics related after their “life time subscription” drama with the older 3g KR63s with customer being told to buy a new 4G model and sign up to yearly or 5 yearly subscriptions.
As a company they should never of sold life time subscriptions, anyone could of foreseen the shut down of the 3G network and we will likely all have to deal with thIs again if and when the 4G network is shut down.
Disappointing.
Wife: Should I plug the car in to charge now?
Me: (24 hours of silence constantly refreshing a web page)
Me: Yes!
Thanks for the article.
Would you know what happens to existing customers who already have the hardware & use SolarAnalytics through white labelled solutions like Clipsal Cortex? Will the monitoring continue to work?
Also if one has Tesla CT’s installed along with the Powerwall, then I assume additional CT’s provided by SolarAnalytics are moot as we can get real-time information via the Tesla App?
Also, Not sure if this could impact 3rd Party Apps like ChargeHQ which probably rely on real time inverter data to control EV charging (Tesla’s may be OK?)
The sun grow has a weird little dongle but the software is awesome. I loved the real-time graphs. My one quibble is that they report report a silly metric of total revenue to make you feel more happy but it should be called total savings. Their ‘revenue’ is not the foru,a I want. They have
The Today Revenue is calculated by the formular below:
Revenue = (Feed-in Tariff * Feed-in Energy from PV) + (Self-consumption of PV * consumption Tariff)
I’d prefer to just now want my feed in revenue is.
Thanks for a great article and rather timely in my case. I’ve been trying to get to the bottom of how “Demand Tariffs” work with my particular retailer.
Here’s how they describe their operation:
“A demand charge is based on your highest energy usage over each monthly billing period (measured in 30-minute blocks) during peak times.”
“A peak demand tariff measures the demand you place on the electricity network during the specified peak time.
Spreading your electricity usage over a day, rather than all at once will reduce the demand you place on the electricity network.”
OK, I think I know how they work.
Problems:
– The last bill I received was for 38 days – so much for “monthly billing period”
– The bill claimed my peak usage was 6.69kW between June 1 and July 8.
– The house was empty (it’s a holiday home)
– The “peak usage” for May 26 to May 31 (yes a 6 day bill!) was also 6.69kW, quite the coincidence.
– None of the bills identify the “30 minute” period within the bill cycle that I was supposedly smelting Aluminium at home. This makes it rather difficult to modify my “behaviour”, which is apparently the rational behind this charge.
– There is no “minimum” usage you can aim for, any usage above 0 will add this loading to the bill.
I got the detailed data from Ausgrid and ran it through meterkloud (great tip by the way!) which showed a max demand during the June peaks of .4kW which is as expected for an empty house. This also corresponds to the data from my Enphase inverter. The only large usage was the control load (hot water) that runs between midnight and 4am.
If they are getting this wrong for me, I expect they are getting it wrong for everyone.
(By the way, do you have a good internet available – with manual override – method of tuning off the hot water service)