For all its trials and challenges, among the bright spots in 2022 was Australia’s progress on renewable energy.
The following indicates renewable energy’s contribution to electricity demand in each National Electricity Market (NEM) state and WA’s South-West Interconnected System (SWIS)1 in 2022 compared to 2021; as reported by OpenNEM yesterday afternoon2.
- NSW3: 27.7% vs. 22.8%
- QLD: 22.4% vs. 19.2%
- SA: 67.7% vs. 62.5%
- TAS: 93.1% vs 102.1%
- VIC: 38.2% vs. 34.2%
- WA: 40.8% vs. 37.6%
- AU (NEM + SWIS): 34.8% vs. 31.0%
- Australia: NEM only: 34.9% vs. 31.4%
In 1999, renewables contributed less than 1% of NEM demand. By the end of 2009, that had grown to 6.4% and in 2019, 22.7%. A couple of years before, those who previously claimed more than 20% renewables would be a disaster for the electricity system went really quiet about that as it became clear it wouldn’t.
In terms of generation in the NEM; renewables matched consumption at 34.9%.
What About Rooftop Solar In 2022?
Contribution to demand in each NEM state (+ SWIS) in 2022 from rooftop solar compared to 2021 stacked up like so:
- NSW: 7.9% vs 6.9%
- QLD: 10.1% vs 8.9%
- SA: 16.9% vs. 16.2%
- TAS: 2.2% vs. 2.1%
- VIC: 8.1% vs 7.2%
- WA: 18.7% vs. 15.7%
- Australia (NEM + SWIS): 11.2% vs. 9.7%
- Australia (NEM only): 8.9% vs. 7.9%
As for generation, rooftop solar accounted for 8.9% in the NEM in 2022.
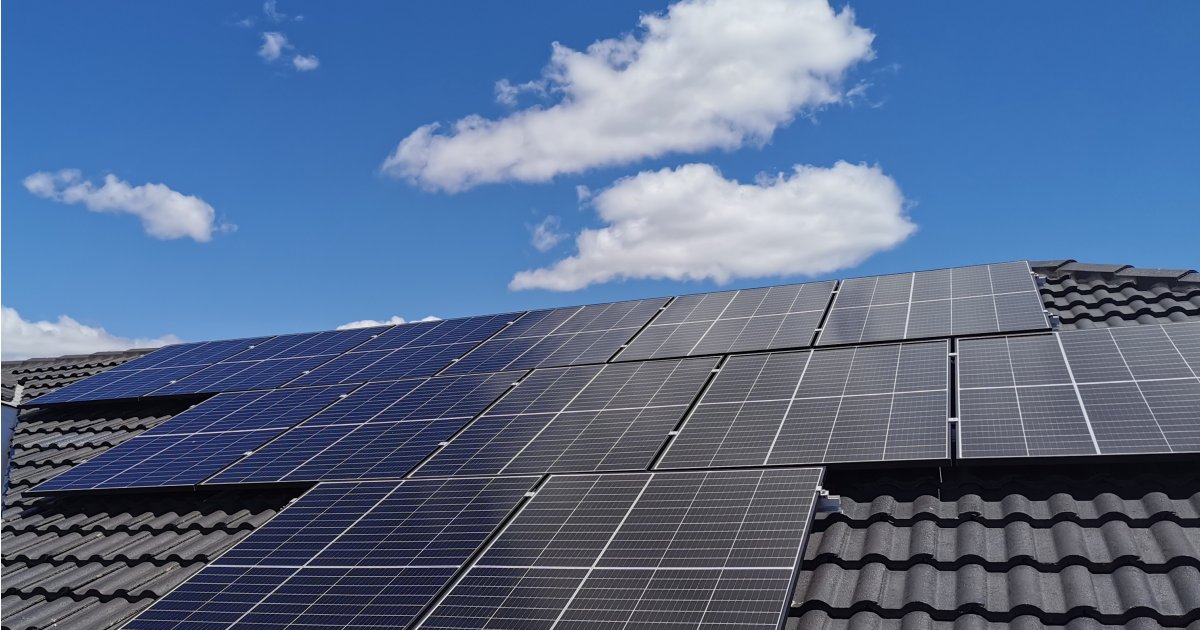
There was again a large amount of rooftop solar capacity added in 2022. While the year may have started off comparatively slowly for uptake of solar panels, activity really picked up when it became clear there were some nasty electricity price rises ahead and Australian households and businesses rushed to buy solar power systems.
The final tally for small-scale (<100kW) installations in 2022 won’t be known for a while yet, but to the end of November last year there had been been more than 256,711 new systems added. Expect the final figure to be significantly higher – not just because of December installations, but as details of earlier installs in 2022 continue to be registered with the Clean Energy Regulator.
There have been more than 3.33 million small-scale solar installations installations in Australia since 2001. 10 years ago, the tally hadn’t even reached one million. There were just 85,000 grid connected solar system in Australia by the end 2009 and it wasn’t until around 2010 home solar power in Australia really started to take off.
How 2023 will pan out is anyone’s guess. But thanks to ongoing subsidies and rebates and the value PV provides, solar panels will no doubt be appearing on a bunch more rooftops across the country this year; saving the households below them a bundle on their electricity costs for many years to come.


 RSS - Posts


Speak Your Mind