

I’m not going to prevaricate. I won’t even waste time using large words I hardly understand. I’m going to come right out and say it. The world’s oceans have problems — big problems as in they’re getting bigger.
Thanks to civilization dumping carbon dioxide and other greenhouse gases into the atmosphere, the annual sea level increase over the past 28 years of accurate satellite observation has been just shy of twice the average over the past 120 years.
We are likely to see 10 cm of sea-level rise since satellite measurements commenced in 1993.
While a 10 cm sea level increase may not seem so serious, speaking as part Dutch, I can assure you it is dangerous and creating problems that sticking fingers in dikes can’t fix. The only reason I’m not curled into a ball and sobbing under the table over the prospects for the future is that I’m optimistic the world will slam the brakes on carbon emissions over the next couple of decades, allowing us to slow the rate at which oceans rise.

I’m sorry, ladies, but we’re well past this point.
I am well qualified to tell you all about sea-level rise on account of the accursed Dutch blood flowing through my veins. Some people believe it’s necessary to study climatology and oceanography for years to speak authoritatively on the subject. Still, I’m pretty sure accursed blood is enough to get me 90% of the way.
How To Get A Rise Out Of The Ocean
Thanks almost entirely to global warming, the world’s oceans have risen by around 20 cm since 1900. The actual figure could be a few centimetres to either side, as we didn’t have satellites doing laps around the planet 100+ years ago. We’ve had them measuring sea levels for 28 years and around half the increase has occurred in that time.
Two ways increased global temperatures result in sea levels rising:
- Thermal expansion of the oceans.
- Melting of land-based ice.
There has also been a relatively small increase caused by:
- Pumping vast amounts of water out of aquifers for irrigation.
There is one thing humans do that counteracts sea level rises, but it is embarrassing:
- Pumping huge amounts of water into oil fields to extract more oil.
Unfortunately, this is more than counteracted by the global warming resulting from burning the oil.
Thermal Expansion: Stuff contracts when it cools and expands when it warms. Seawater is the same. Thermal expansion has been responsible for the majority of the sea level rise so far. The oceans’ average depth is 3.7 kilometres, and most of the warming is so far confined to the top fifth, but it’s slowly spreading. If we held global air temperatures at their current average, the oceans’ thermal expansion would continue for centuries.
Melting Ice: Sea ice melting doesn’t affect sea levels because it’s already in the sea. But ice on land getting dribbly does. The world’s main ice stock is in Antarctica, and there is a considerable amount in the Greenland ice sheet. Currently, around 200 billion tonnes a year of Greenland’s ice goes all wibbly-wobbly and runs into the ocean. While this only represents 0.07% of all the ice on that not particularly green island, trust me, that’s still too much, even if ice can continue to be lost at this rate for over 1,000 years.
28 Years Of Satellite Measurements
NASA has measured sea-level rise by satellite since 1993. While the average annual sea level increase since the start of the 20th century has been approximately 1.7 mm, in the past 28 years of satellite measurements it has been just under twice that at 3.3 mm a year.
Here’s a graph from NASA showing the satellite info:
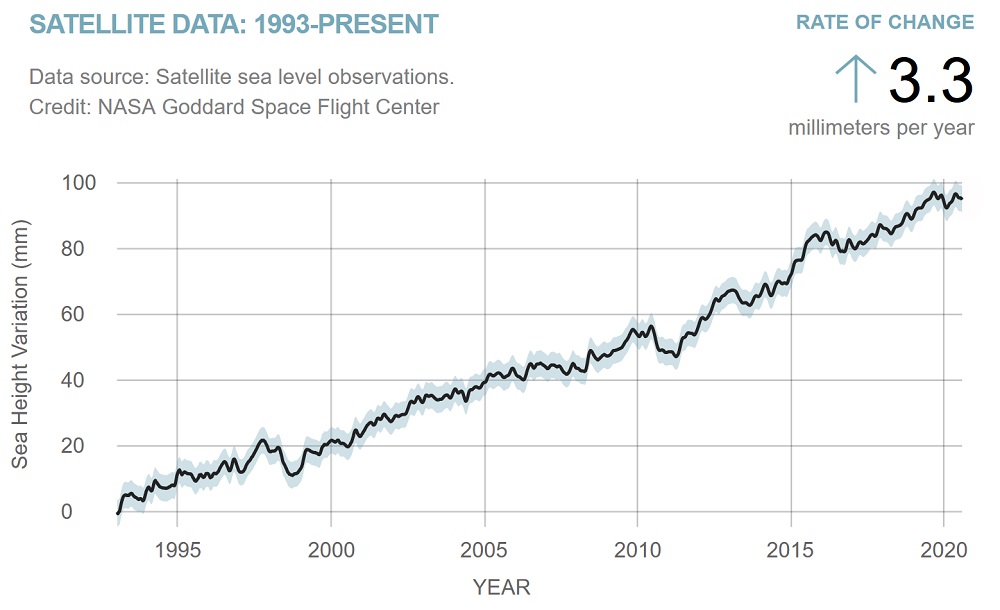
While the graph shows sea level increases have been fairly steady over the 28 year measurement period, it is much faster than 100 years ago. In a worst-case scenario where we don’t slack off on CO2 emission, the average sea-level rise over the 21st century could be up to three times as much. Thankfully, due to the low and falling cost of renewable generation and energy storage, as well as the decreasing cost of electric road transport, the worst-case scenario is now an impossible case scenario.
Unfortunately, we don’t know how bad things can get even if the world reduces net CO2 emissions to zero by 2050. All we can really be sure of is it will be a lot bloody better than if we don’t.
Here’s the figure for millimetres of sea-level increase since 1993:
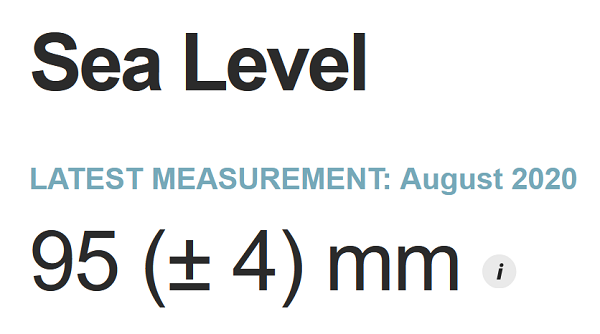
Because it’s from August and because it’s so close, we may see 10 cm of sea-level increase before the end of this year. If we don’t, then it’s pretty certain we’ll pass that point before the end of 2022. That will be over 10 cm of sea-level increase in just 29 years.
Mo’ Ocean Mo’ Problems
I probably don’t have to tell you why it’s bad for sea levels to rise. But just in case you are one of those people who think it will be easier to relocate the bulk of the world’s major cities to higher ground rather than cut emissions, I’ll point out that you’re wrong. The real estate value of Manhattan Island alone is supposed to be around $2.3 trillion. That’s $180,000 Australian for every US family, which more than enough for the United States to eliminate all greenhouse gas emissions with plenty of dosh to spare.
But even if the entire world slams the brakes on emissions over the next couple of decades, we’ll still need to go to a lot of effort and expense to make sure the expanding big blue wobbly things that mermaids live in don’t make a soggy mess of seaside cities through storm surges and more damaging tsunamis.
Sure, you may think that no matter how high sea levels rise you can always hire some Dutch engineers to protect your cities, but that’s how you end up clinging to floating wreckage after a particularly destructive storm and find yourself under the rule of the new Dutch East Everything Company.
There’s a lot to do. A big part of the solution is continuing to accelerate the deployment of solar power generation. Studies from RethinkX and Columbia University recommend oversizing solar systems by a factor of three to achieve dispatchable solar kWh at the lowest cost. We need to be embracing curtailment of solar as a feature – not a bug.
The good news is that savvy Australian homeowners, along with forward-thinking installers, understand this intuitively. Most of the installers we work with don’t just bang out 6.6 kW specials, but have a conversation with the homeowner about sizing. These guys were averaging over 8 kW per system installed in 2020 and rising. That’s a tiny bit of good news at the end of an otherwise pretty bleak blog post.
Happy new year.

Hello gentlemen. You’re a little early, but — unfortunately — not by much.
 RSS - Posts


And with more cloud, so less solar electricity production..
Rather than banging up forever larger solar PV arrays (only to feel as though these need to be replaced prematurely in ~10 years time to keep up with the latest advancements and to keep up with the neighbours etc), how about shifting the focus onto reducing household energy consumption?
Homeowners seem to be too lazy (or have too much money) to bother. This is a big problem.
With the continental shelf off the coast of NSW having a gradient of about 1 in 100 a rough estimate is that a 10cm rise in sea level will result in an average long term retreat of the coastline of 10 metres. No good for coastal infrastructure!
I think your sea level rise projections could prove to be optimistic. There is already sea level rise baked into current CO2 levels and they will continue to rise (even if at a slower rate) for probably 2 to 3 decades yet. Peak sea level is almost certainly going to be decades after peak CO2. Some say that there is already metres of rise baked into the most optimistic projections of slowing emissions (but any emissions are still a rise in CO2 in the atmosphere). As an example see:
https://www.discovermagazine.com/environment/with-sea-level-rise-weve-already-hurtled-past-a-point-of-no-return
Remember that sealevel rise has two components:
1. water expends as it warms
2. nearly all the above sea level ice sheets and glaciers are melting and most of that water flows into the sea (some goes into the atmosphere as increased humidity)
The ice sheets are melting at current CO2 levels in the armosphere. They will likely keep melting until CO2 is substantially below current levels, even though it may take centuries for them to disappear.
HI
Is there any analysis of the tradeoff between the loss of efficiency with west (and east facing too I suppose) facing, steeper sloped panels compared to the cost of storage as a way of reducing reliance on fossil fuels for winter late afternoon, summer early evening load?
It seems that if there was higher solar generation late in the day, the amount of storage needed for the post sunset demand would be less.
Cheers!
The argument for sea level rise is perfectly sound, however your optimism that homo sapiens will acknowledge the errors of their ways is unrealistic. Just maybe if the Donald is evicted in a few weeks, SCUMMO Freudenberg et al are enlightened, NoNotion neanderthals Malcolm Roberts, Mark Latham and the dreaded poorlene all disappear off the planet, Sky News goes bust, and Rupert Murdoch suffers a fatal stroke, we might begin to see a bit less denialism on the part of the sheeple but full awareness of the climate mess will take decades.
AHA! Dutch! that explains lot! Sorta like Evolution and the ‘solution’ to the perceived dangers of global warning:- adapt or go extinct….. and a quick survey shows that 98.99% of all the other life-forms on the planet are hoping for the second option.
Happy New Year Ron
Good to hear about even bigger rooftop system sizes. I also see AEMO is predicting a large increase in commercial rooftop solar for SA
Off topic but you guys seem to have a finger on the pulse.
In the latest SA Electricity Report, mention is made of SAPN moving hot water timers to daytime. Would you have any further details?
SAPN is encouraging hot water systems to switch on during the day with their Solar Sponge controlled load tariff which is from 9:30 am to 3:30 am and has SAPN’s lowest tariff, but what households will pay will depend on what electricity retailers offer.
I think this is a separate SAPN project. Significant if true
“Another noticeable feature in the demand profile is the sharp uptick from 11:30 pm, due to the controlled switching of electric hot water storage systems. SA Power Networks (SAPN) has started moving some of its customers’ hot water systems away from the night-time timer setting to turn on during the middle of the day instead. Additional residential customer hot water loads may have been moved by retailers as smart meters are being installed. This has lowered the observed night-time peak”
Page 38 of the recent AEMO SA Electricity Report
Earth’s climate history previews our hot future, and the correspondingly likely sea levels.
Last year, Mauna Loa Observatory recorded atmospheric CO2 levels that reached a seasonal monthly average peak of 417.1 parts per million (ppm) in May.
See: https://scitechdaily.com/may-2020-had-the-highest-monthly-atmospheric-co2-reading-ever-recorded/
See also: https://keelingcurve.ucsd.edu/
When planet Earth last had as much carbon dioxide in the atmosphere as it does today, during the Pliocene age, 2.6–5.3 million years ago, trees were growing in Antarctica, sea levels were 20–25 m higher than now, and global mean temperatures were 2–4 °C warmer than pre-industrial age.
See: https://www.climaterealitycheck.net/
Sea levels will eventually rise tens of metres (over centuries to millennia timescales) for the current level of greenhouse gases already in the atmosphere.
So far, the only thing that seems to have changed in our Australian political leadership mindset is that some have progressed from their initial delusion that climate change doesn’t exist at all’, to a modified delusion that ‘Oh!, climate change does exist after all, but still no need to worry because our adaption and mitigation strategies will see us safely through all the changes that the experts foresee ahead of us’.
To date though, we haven’t seen any detail at all on what those proposed strategies will be, let alone any time frame for their implementation.
Over=sizing seems a very good idea, looks like we’ll need to be running our air-conditioners a lot more within the next few years…-
You havent factored in that water is at its densest at 4degC (that’s why ice floats) and 90% of the water in the ocean is below 3degC. So heating the lower layers will actually lower the oceans level.
Also, there are rock outcroppings in indonesia that show aout 7k years of tidal erossion, with no sign of level change.
Salty seawater decreases in density from 3 degrees up:
https://www.engineeringtoolbox.com/sea-water-properties-d_840.html
If tidal erosion has been occurring at the same level for 7,000 in Indonesia that’s pretty impressive since sea levels have risen about 4 meters since then due to the ending of the last glacial period. But given the volcanic nature of Indonesia it’s probably not surprising some location would have about the right amount of uplift. There are parts of Canada where the land has risen about 50 cm over the past 28 years.
Greenland will also be OK as at the current rate of sealevel rise. It is now rising 3 cm per year, and accelerating. It will rise a kilometer eventually, when all the ice melts.
Sealevel rise will probably be good business for Holland. It was Dutch companies which built the modern seawalls along the west coast of south Jutland.
The old estimate of 300 mm rise by 2100 is out of date and ignores feedback effects. If It’s less than 600 mm by then, then we’ve spent hundreds of trillions, on a war footing. My guess is closer to a meter rise by then. (Hint: The already observed acceleration is cumulative … but the rate of acceleration also increases as meltwater lubricates glacier slip rates, and decreasing polar ice changes albedo from 85% to 15%, etc. If the methane clathrates warm enough, then the survivors will lead very different lives.)
Erik Christiansen,
Greenlanders certainly don’t need to worry about sea level rise. It’s people who live on or near coastlines that are more than a few thousand kilometres away from large bodies of melting land ice that need to worry.
When large bodies of land based ice melt (like the Greenland Ice Sheet, but also significant parts of Antarctica, like the West Antarctic Ice Sheet) three things happen:
1. The mass of the entire oceans/seas increases due to the melt water dumping into them;
2. The gravitational attraction that the ice sheets exert on the surrounding water diminishes, and the water migrates away from them;
3. As the ice sheets melt, the land below them rebounds upwards.
People living on the US east coast or in Holland don’t need to worry too much about the Greenland Ice Sheet melting, but they do need to be much more concerned about how much Antarctic ice is melting.
Similarly, people living near the coasts of Australia that are closer to Antarctica need to be more concerned by how much the Greenland Ice Sheet is melting.
http://oceans.nautil.us/article/564/why-our-intuition-about-sea-level-rise-is-wrong
A 18 Dec 2020 published paper titled “Twenty-first century sea-level rise could exceed IPCC projections for strong-warming futures” suggests that the IPCC’s projections that sea-level rise from the 1950s levels would likely be within 0.61–1.10 m if warming exceeds 4°C by 2100 is “focused at the low end of possible outcomes”. This statement jumped out at me:
“The lessons from the paleo record inform us that it is possible, when pushed by greenhouse gases, for the climate to change rapidly and for ice sheets to drive several meters of global sea-level rise over a century timescale.”
See: https://doi.org/10.1016/j.oneear.2020.11.002
Ronald,
Your post includes: “Currently, around 200 billion tonnes a year of Greenland’s ice goes all wibbly-wobbly and runs into the ocean.”
The Greenland Ice Sheet (GrIS) is apparently discharging much faster at 502 ± 9 giga-tonnes per year (Gt/y) in 2017 and 2018, or 17% above the 1980s average.
The cumulative GrIS mass net loss is estimated at 4,200 Gt between 1985 and 2018.
The average loss rate of −240 Gt/y between 2003 and 2018 is close to the
approximate −235 Gt/y rate estimated from the GRACE satellite data for the same period.
See: https://www.nature.com/articles/s43247-020-0001-2
The ice loss has been so massive in recent years that it has caused a measurable change in the gravitational field over Greenland.
The melting of the GrIS is the single largest contributor to sea level rise.
If climate change continues at current rate, the rate of GrIS melting will accelerate.
It’s likely that the retreat of the GrIS cannot now be reversed – it’s possibly the first in a series of ‘tipping points’.
If the GrIS were to completely melt and the meltwater were to completely flow into the oceans, then global sea level would rise by about seven meters (23 feet).
https://climate.nasa.gov/faq/30/if-all-of-earths-ice-melts-and-flows-into-the-ocean-what-would-happen-to-the-planets-rotation/
Morning Dutchy
There is no doubt that climate changes and sea levels with it.
After all, it was only 11k years ago that one could have walked to Tasmania and New Guinea and aborigines lived where the outer Great Barrier reefs now exist. And there are at least 20 similar instances in Aboriginal memories around Australia researched or recorded by Patrick Nunn, a research professor at Sunshine Coast uni in 2014 in his book “The Edge of Memory”.
Not sure that I would use NASA Goddard Space Flight Center for satellite sea level observations without correlating it with long term, world-wide sea level measurements taking into account tectonic shifts. But its a free world and why not if it’s easy and confirms your thinking.
Remember the H L Mencken quote “For every complex problem there is a solution that is simple, plausible and wrong”.
It is certain that CO2 is a greenhouse gas. Whether CO2 is the main driver of climate change compared with H2O is an open question.
Hope we all have a healthy, safe and prosperous New Year.
Warming in the past raised sea levels. Sea levels rising now due to warming. There is no conflict. Average annual sea level change over past 2,000 years prior to industrialization = around zero. Average annual sea level rise over past 28 years = 3.3 mm.
Ronald Brakels,
“While the graph shows sea level increases have been fairly steady over the 28 year measurement period, it is much faster than 100 years ago. In a worst-case scenario where we don’t slack off on CO2 emission, the average sea-level rise over the 21st century could be up to three times as much. Thankfully, due to the low and falling cost of renewable generation and energy storage, as well as the decreasing cost of electric road transport, the worst-case scenario is now an impossible case scenario.”
I’d suggest the worst-case SLR scenario is increasingly more likely.
Glaciologist Professor Jason Box said in an interview at the venue of the COP26 at Glasgow: “Technically now, Greenland is beyond its viability threshold…”
Per Professor Box, global mean SLR is estimated to accelerate (conservatively) to at least a metre by 2100. If a major ice shelf disintegrates in Antarctica, then SLR will accelerate faster.
https://www.solarquotes.com.au/blog/2022-election-clean-energy/#comment-1437698
Coastal Risk Australia provides an interactive map of which coastal areas are at risk of flooding due to sea level rise (SLR).
1. Select a location: e.g. Barangaroo, NSW, Australia
2. Select ‘MANUAL’ mode
3. Adjust slider to required SLR scenario.
https://coastalrisk.com.au/viewer
Barangaroo would begin to be inundated beyond a SLR of around +1.0 m.
In the YouTube video titled RESET.21 FORUM 1 | MATTERS OF FACTS: THE SCIENCE OF GETTING IT RIGHT ON CLIMATE, published on 4 Feb 2021, duration 1:22:23, David Spratt discusses sea level rise from time interval 0:07:08:
* Victorian Government scenario for 1.1 m by 2100;
* US Government high scenario for 2.5 m by 2100;
* US DoD scenario for up to 2 m by 2100;
* Karl Braganza (Australian BoM): BAU GHG emissions trajectory high scenario + storm tide for Cairns for 3.08 m by 2100.
https://www.youtube.com/watch?v=7V8pTQnCp40
Ronald Brakels,
“Because it’s from August and because it’s so close, we may see 10 cm of sea-level increase before the end of this year. If we don’t, then it’s pretty certain we’ll pass that point before the end of 2022. That will be over 10 cm of sea-level increase in just 29 years.”
Per the latest data from NASA for sea height variation (as at 25 Nov 2022):
* 26 Jan 1993: _ _0 ± 4.0 mm (zero baseline)
* 17 Jul 2021: _100.1 ± 4.0 mm (10,400 days, +3.52 mm/year)
* 25 Nov 2022: 104.0 ± 4.0 mm (10,895 days, +3.49 mm/year)
https://climate.nasa.gov/vital-signs/sea-level/
John Englander, an oceanographer, consultant and leading expert on sea level rise, provides a graph (dated 18 Nov 2019) showing a conservative guidance for future global mean sea level rise, based on his 9-box matrix for SLR:
* Low risk: 30 years (2050): 30 cm (1 foot); 50 y (2070): 60 cm (2 feet); 100 y (2120): 2 m (7 feet)
* Med risk: 30 y (2050): 60 cm (2 feet); 50 y (2070): 1.3 m (4 feet); 100 y (2120): 4 m (13 feet)
* Hi risk: 30 y (2050): 1 m (3 feet); 50 y (2070): 2 m (7 feet); 100 y (2120): 6 m (20 feet)
https://johnenglander.net/wp/wp-content/uploads/2019/11/Graph-Englander-9-Box-matrix.png
Sea level rise can no longer be stopped, so it is urgent that we commence intelligent adaptation as a high priority, argues John Englander in his presentation at The Royal Institution on 11 Feb 2019, in the YouTube video titled Sea Level Rise Can No Longer Be Stopped, What Next? – with John Englander, published 30 May 2019, duration 1:18:01:
https://www.youtube.com/watch?v=MvqY2NcBWI8