
Image: ulleo
Green Energy Markets’ latest Renewable Energy Index states small scale rooftop solar power systems installed in October across Australia will deliver $195 million in power bill savings over the next ten years.
“Electricity consumers are flocking to solar to shield themselves from the significant electricity price rises that have unfolded this year,” states the company.
Electricity price hikes in July saw households and businesses throughout much of Australia slugged with increases of up to nearly 20%, so the spike in interest in going solar comes as no surprise as new bills started rolling in – along with the shock.
Green Energy Markets notes that in October, rooftops solar installations exceeded 100 megawatts of capacity for the month (106MW). The company says the only other occasion when 100MW+ was installed was back in June 2012.
The report states the 15,736 small-scale systems installed during October will generate electricity equivalent to powering almost 28,000 homes, and supported 5,193 full-time jobs.
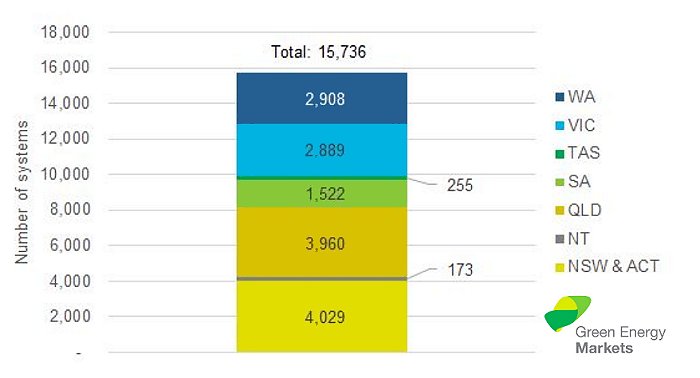
Queensland led the states and territories in terms of rooftop solar installs and employment, with 3,960 systems installed during October; supporting 1,347 full time equivalent jobs.
The latest Renewable Energy Index, which includes Green Energy Markets’ methodology, can be downloaded here (PDF).
The Clean Energy Regulator’s take on October was quite different to Green Energy Markets’.
In its recently published Cracking The Small Scale Code, the Regulator states there were 7,412 small-scale systems installed nationally in October (6,152 of those solar PV), with a total capacity of 37, 991 kW (all systems). However, the Regulator’s published statistics were current as at November 1. The stats are based on Small-scale Technology Certificate (STC) creation – and certificates can be created for up to 12 months after installation, meaning the installation figures for October will continue to rise.
The Regulator states 88 solar PV systems had a concurrent battery storage installation in October – so less 1.5% of installations it noted.
The SolarQuotes auSSII report for October indicated just under 5% of Australians receiving quotes from the service during the month were seriously considering installing solar + battery systems concurrently.
According to the Clean Energy Regulator, there were at least 1,763,298 <100kW capacity solar power systems installed across the country as at November 1.
 RSS - Posts


What I just posted, did not display (for some unknown reason) what I had copied and posted from my web page at
http://www.armadale-wa.net/clean-energy.html
(where the explanations for the derived numbers, are published).
Anyway, the final results that I had published for October, are:
WA 1857 systems for 2,632,200 people – > 70.549 per 100,000 people
SA 717 systems for 1,710,800 people – > 41.910 per 100,000 people
Qld 1911 systems for 4,860,400 people – > 39.317 per 100,000 people
NT 75 systems for 245,700 people – > 30.525 per 100,000 people
Tas 128 systems for 519,800 people – > 24.624 per 100,000 people
NSW 1679 systems for 7,757,800 people – > 21.642 per 100,000 people
ACT 68 systems for 398,300 people – > 17.072 per 100,000 people
Vic 977 systems for 6,039,100 people – > 16.177 per 100,000 people
Hopefully, that will display properly and correctly.
Now that I have been able to download the “Green Energy Markets’ latest Renewable Energy Index” report, I make the following observations, in addition to my previous observations, which related to the data from the “Clean Energy Regulator’s take on October”.
Populations of states and territories are sourced as for my above post.
Regrading the graph above, which is “Figure 7: Small-scale solar PV systems installed by state – October 2017 ” from the “Green Energy Markets’ latest Renewable Energy Index” report; the numbers of systems installed for each state, are;
WA – 2908 systems for 2,632,200 people -> 110.477 per 100,000 people
SA – 1522 systems for 1,710,800 people – > 88.964 per 100,000 people
Qld – 3960 systems for 4,860,400 people – > 81.474 per 100,000 people
NT – 173 systems for 245,700 people -> 70.411 per 100,000 people
NSW & ACT – 4069 systems for 8,156,100 people – > 49.889 per 100,000 people
Tas – 255 systems for 519,800 people – > 49.057 per 100,000 people
Victoria – 2889 systems for 6,039,100 people -> 47.838 per 100,000 people
And, in the Green Energy Markets’ latest Renewable Energy Index” report, Figure 8 is “Figure 8. Number of full-time equivalent (FTE) jobs by state in the installation and sale of rooftop solar PV systems installed over October 2017″, and that gives the respective numbers of ” full-time equivalent jobs by state”, as
WA – 905 FTE for 2,632,200 people -> 34.381 FTE per 100,000 people
SA – 530 FTE for 1,710,800 people – > 30.979 FTE per 100,000 people
NT – 77 FTE for 245,700 people -> 31.339 FTE per 100,000 people
Qld – 1347 FTE for 4,860,400 people – > 27.713 FTE per 100,000 people
Victoria – 978 FTE for 6,039,100 people -> 16.194 FTE per 100,000 people
NSW & ACT – 1285 FTE for 8,156,100 people – > 15.755 FTE per 100,000 people
Tas – 70 FTE for 519,800 people – > 13.466 FTE per 100,000 people
So, I think that the statement from the “Green Energy Markets’ latest Renewable Energy Index” report, that “Queensland led the states and territories in terms of rooftop solar installs and employment”, is a bit misleading.
I forgot to add at the end of my last previous post above, that the statement “Queensland led the states and territories in terms of rooftop solar installs and employment” is a bit like making the claim that Australia is leading New Zealand in terms of renewable energy usage, due to Australia generating more kWh from “Renewables”, than New Zealand, when as stated in the “Green Energy Markets’ latest Renewable Energy Index” report,
“Renewables made up 20.3% of the electricity generated in Australia’s main grids”
whereas, in New Zealand, I believe that it has been reported that 60% of New Zealnd’s grid electricity is generated from clean energy, with a target of 100% in the next few years.