
Which state had the cheapest solar power systems overall last month? Here’s a hint – the initials are WA. Discover what Australians across the country were paying for solar in May 2022.
Cost per watt for fully installed systems including any up-front subsidies and across all system sizes was a mixed bag again in May. There were decreases in Queensland and New South Wales compared to April, and increases in all other states we had sufficient data for at the time of writing.
| State | Cost per watt (May 2021) |
Cost per watt (April 2022) |
Cost per watt (May 2022) |
| QLD | $0.89 | $1.02 | $0.99 |
| NSW | $0.99 | $1.14 | $1.11 |
| ACT | $1.02 | $1.26 | $1.37 |
| VIC | $0.92 | $1.10 | $1.12 |
| TAS | $1.17 | NA | $1.50 |
| SA | $0.92 | $1.04 | $1.14 |
| WA | $0.71 | $0.87 | $0.90 |
| NT | NA | NA | NA |
| AU | $0.92 | $1.05 | $1.08 |
May’s figures are based on details supplied by 279 Australians who chose to note what they paid for their systems when submitting solar installer reviews – these included reviews of installers not within the SolarQuotes installer network.
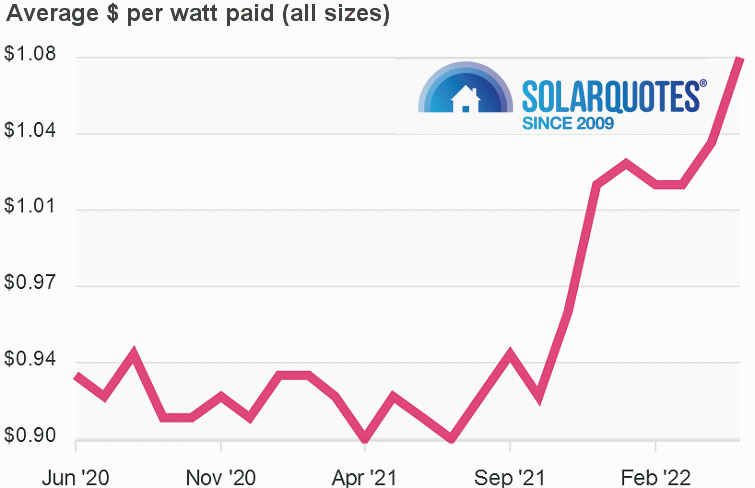
Cost Per Watt Nationally
The following graph indicates average cost-per-watt across all system sizes nationally going back to June 2020.
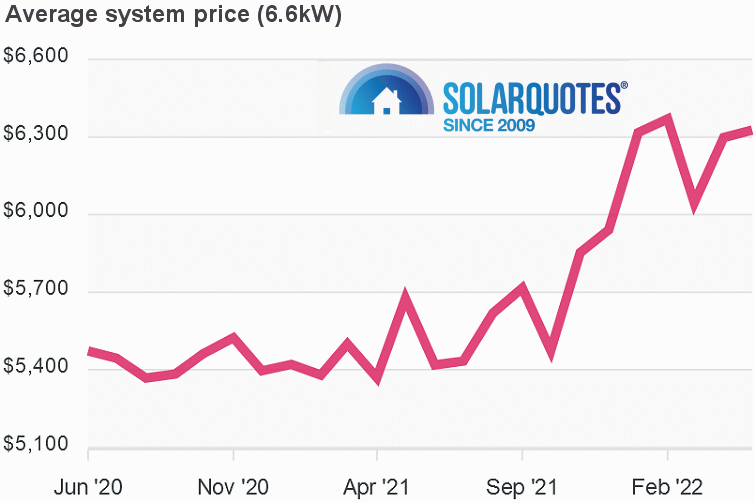
6.6kW Solar System Prices – May 2022
While many Australians are choosing to fill their rooftops with panels these days, 6.6kW solar systems are still very popular (interest in 10kW systems is also growing). The following graph shows how average national pricing on 6.6kW capacity has tracked over the last couple of years.
For advice on system sizing and just about everything else you’ll need to know about going solar, check out Finn’s guides to understanding, buying and owning a solar system.
Electricity Prices Spark A Solar Rush
Last month’s report mentioned significant power price increases for many households and businesses were on the cards. Unfortunately, that came to pass in regional Queensland, SE QLD, SA and NSW, Victoria, Tasmania and to a lesser degree Western Australia and the Northern Territory.
The uptick in solar energy interest in May became a frenzy in June as news of power price hikes hit home. With supply and demand (and other factors) influencing system prices, it will be interesting to see how the rush has affected the cost of solar power systems during June.
You’ll be able to get a sneak peek at how prices tracked during June early next month using the Solar Quotes Australian Solar Price Index; which is what this report is based on. It generates historical solar pricing in each state and nationally, along with filters for creating reports on various system capacities and components.
Note: the tool generates figures in real-time as new reviews are submitted, so the results you’ll see for May when using it may differ to the table and graphs above.
Pricier systems are a pain for solar buyers, but so are higher electricity bills – particularly if the current situation continues for some time. Holding off on an installation hoping system prices drop substantially soon could turn out to a costly decision.
 RSS - Posts


Solar system prices have jumped apparently, but what about solar batteries? An article on another site claimed they’ve been reasonably constant at around $1,250 since March 2018.
Assuming 10 kWh of power used overnight, and imported power being charged at 25c per kWh, that equates to $2.50 per day, just over $900 per year spent on power during non-solar times, or $9,125 after 10 years – assuming no rise in charges.
Assuming a mere 5% rise each year in supply charges, no solar meter charge, and a ‘mere’ $1.30 as an initial daily supply charge, you’re looking at paying $2.02 per day by year 10, a yearly cost of $474.50 for year 1, $736.11 for year 10, and a total cost of just under $6,000.
All up that equates to just over $15,000.
With FiTs now being so low as to be almost worthless, and even 80:20 or 90:10 exporting to importing from large systems unable to make cost parity, home solar batteries are likely to be increasingly of interest to those who can afford the capital expenditure. If FiT revenue is no longer viable, and savings are to be made off self consumption rather than grid imports, why bother to continue subsidising communal power? What not instead abandon the grid and leave it to large industry, apartment dwellers and those too poor to afford solar + battery systems?
Apologies, this is obviously more resident pessimist than resident skeptic, but is my maths wrong? Naturally it depends on your nightly usage and retailer charges, but I’m starting to question whether disconnecting from the grid may soon be more viable than I thought. I previously worked on the basis of daily supply fee + solar meter charges for 10 years versus the cost of a solar battery, and perhaps a diesel\petrol generator for emergencies, but it was pointed out that I really should be factoring in self consumption – I’ve previously treated it as a hidden bonus. Since even low nightly consumption is greater than daily charges that radically changes the equation, and the conclusions to be drawn!!!
Great ideal until you get a week of shockingly bad weather
Try WA – Synergy (govt owned) is ramping up standalone systems in rural areas where it’s cheaper to provide solar and battery/diesel backup than to maintain existing poles and wires. Plan is for 1k properties over the next few years – you have to start somewhere.
It’ll be a while yet before it makes sense to do this in urbanized areas. Being 100% self reliant (and being highly reliable at the same time) is much more expensive then the daily supply charge.
Interesting information.
It appears the trend in presenting graphs these days is to NEVER label the axes. This is poor presentation as its not always obvious what is being graphed. Solarquotes has done precisely this, although in this case its understandable.
A question: I understand Tasmania produces 100% renewable energy from water driven turbines, although there’s some wind turbines in the state too. So why are prices per kwh the highest in the country?
Hi Michael
Tasmania has the highest cost of rooftop solar per watt or kilowatt of solar panels installed for three main reasons:
1. They tyranny of distance – it costs more to get solar hardware to Tasmania.
2. It’s a small market.
3. Tasmania has a strict independent inspection system for solar. This increases the cost, but results in the highest average quality of installs in Australia.