
While it’s very early days for the national home battery rebate, here’s how the postcode leaderboard looks based on July 2025 installation figures. But there’s (a lot) of missing data, so expect changes in the rankings.
Where In Australia Is The Federal Battery Rebate Most Popular?
Western Sydney is leading the way on early uptake of the federal battery rebate with six of the top ten postcodes across the country, according to data released by the Clean Energy Regulator (CER). New South Wales dominates with nine of the top ten postcodes, including an additional three outside of Sydney in regional areas.
A Busy First Month For The Battery Rebate
The first month of the Albanese Government’s Cheaper Home Batteries program had its hiccups, but was a roaring success in terms of installation numbers. Early in August, we reported on home battery installation statistics released by the CER that indicated 19,592 solar battery installations were recorded across the country in July 20251, adding up to a total nominal capacity of 344.1 MWh2.
The information in that report was state/territory focused – but what’s happening at a postcode level?
Installation Leaderboard (So Far) For July 2025
Here’s how things look at the time postcode data was last updated, but see the important notes in the next section. Capacities have been rounded to the nearest kilowatt-hour (kWh) and you can click on the link for each postcode to see what areas it covers.
As noted, the top 10 (so far) were all New South Wales postcodes except for one in South Australia (Adelaide’s northern suburbs). Five of the NSW postcodes were western and north-west suburbs of Greater Sydney, one in Sydney’s south-west and the remainder in regional and other coastal areas of the state.
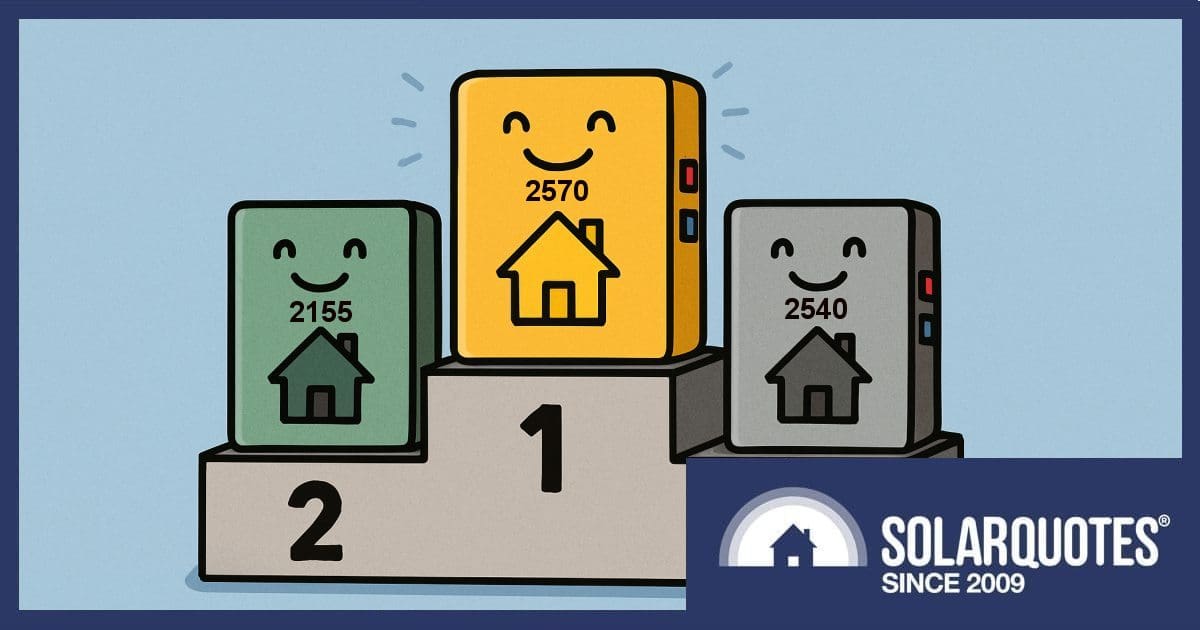
The 2155 postcode may have been beaten on solar battery installation numbers at this point, but is powering ahead on total capacity with more than 1 megawatt-hour. And at least one battery system was installed in 1,420 postcodes in July 2025.
But, read on.
The Devil(s) In The Detail
The CER’s postcode data for July is only reflecting 8,436 installations for the month at the time of writing; although it is ‘current’ as at July 31, 2025. So, the discrepancy between the CER’s news release on August 4 (19,592 installations) and what’s on their postcode data page is huge. It can be explained by this note from the Regulator:
“Solar battery postcode data includes all solar batteries that have been approved for small-scale technology certificates (STCs). It doesn’t include data for installed solar batteries with pending STC applications.”
Small-scale Technology Certificates (STCs) form the basis of the battery rebate, and they can be created up to 12 months after installation. But at the consumer end, the rebate is offered as an up-front discount.
The earlier CER news release figures were a combination of both approved and pending applications. The CER team is really under the pump at the moment on certificate creation approvals, as indicated by another note from the Regulator:
“Processing times for small-scale technology certificates will take longer than usual. Please be patient as the program ramps up.”
Marketing-related distortions also likely come into play with the rankings, with some businesses being faster off the mark and more active in promoting the rebate to their customer base, and more broadly. There was also the impact of the added lure of the New South Wales battery rebate, which ended on June 30 and was replaced by a beefed up Virtual Power Plant (VPP) incentive. Some of those customers would have switched over to claiming the national rebate instead.
And even if the July installation data was complete, the rankings above could be considered ‘unfair’ given population differences between postcodes. So, if you’re really, really keen, the CER data can be downloaded here and Census Quick Stats are available here – have at it :). But perhaps wait until the July postcode data more closely matches the total in the CER’s original release before attempting such a time-consuming breakdown.
Stay Updated
Australia’s home battery revolution is certainly in full swing. According to recent analysis by SolarQuotes, uptake is such that the scheme is likely to chew through its original announced $2.3bn funding pool well ahead of schedule. While a further $1.2bn has been allotted to take the program through to 2030-31, there may still be a gap unless action is taken.
Stay up to date with what’s happening on the battery rebate front and all things solar by subscribing to the free SolarQuotes weekly newsletter.
 RSS - Posts


Speak Your Mind