

Solcast Has A New Free Tool For Rooftop Solar Owners
TLDR: The tool is here
Hey SolarQuotes crowd! Remember me? I’m the bloke who made you all sign up for the Solcast API service in order to check in on the performance of your home solar PV system. Some of you had great success! Others, despite my best efforts, still couldn’t figure how our seemingly complex sign-up and data access worked. And I can’t blame you, it wasn’t the easiest of tasks!
But despite some frustrations, when I last wrote to you in early December (2018), I was very pleased by the great engagement and insightful questions you offered. There were plenty of active comments, many emails in follow-up, and even some tweets along the way! I had great fun in engaging with you folks, and your enthusiasm and energy had me thinking over the holiday period about what Solcast could do in order to help out everyday Australians with their solar energy journey.
In my mind, one repeat suggestion really stood out from the others. Why not build a simple widget/tool that would allow everyday folks to produce an estimate of the energy generation from their PV systems, without all off the difficulties of signing up for an API and making conversions in Excel. One super helpful bloke (John) even went so far as to do this himself with a Google spreadsheet calculator! Champion.
Enter the Solcast Rooftop Solar PV Performance Estimator
Well, our team was so motivated by the SolarQuotes mob that we decided to build a simple and FREE rooftop solar PV performance checker, which we are now hosting on our website.
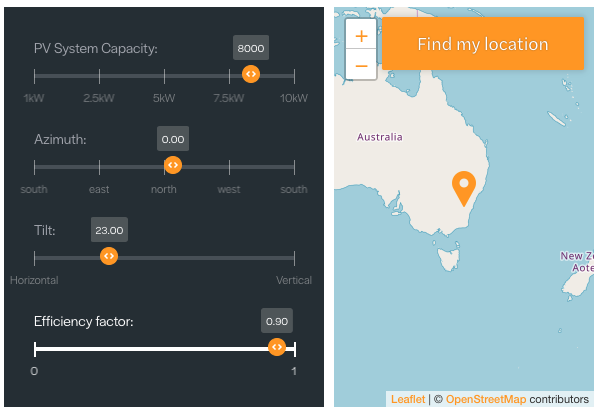
Using a handful of sliders and a map, you can now set the capacity, azimuth, tilt and efficiency factor (we called it the ‘loss factor’ in the previous blog) of your PV system in just a few seconds, while nailing down your exact location by dropping a pin in the map.
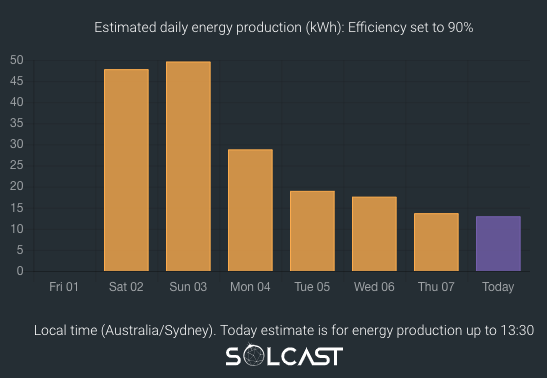
With that, we spin up an estimate of the total energy generation from your PV system in kWh (kilowatt hours) for the past 6 days + today (up to the present time). These results are displayed in a bar chart, which you can mouse over to get an exact value of the estimate for comparison with your home monitoring solution or solar inverter.
And being the enthusiastic group I enjoyed last time around, I’d love to see all your feedback, questions and comparisons in the comments below. I’ll be sure to reply!
 RSS - Posts


So where is it?
Yes, I can’t find the app.
Where is it? I have an account but can’t see it anywhere on the website.
I played with the Solcast forecast last time and also built a URL creation tool.
Mark/Alex,
It’s not an app…it’s right there in plain sight, hosted on the website as Nick says….. there’s no mention of an app per se.
If there was an app, there’s no mention what device or OS it was designed for.
Rgds,
Graham
Hi Graham
Thanks. OK I see – it’s not actually obvious there is a tool – it looks like an image in middle of a blog item, not a user interactive panel.
My PV system is 11kW. Although in reality mine is a spit azimuth system.
Nice tool although I find it’s easier just to make the url call as that gives me the data I can sum for the different array orientations.
I find the azimuth value not all that intuitive. I think in terms of compass angles north at 0/360, east 90, south 180, west 270.
I struggled to get the slider values close to actual, the sliders seem to make large jumps. I think for some things like PV size just entering a number is easier.
Alex
Alex,
Azimuth is the compass, I fail to see the difference.
Definition of azimuth from the interwebbything: the horizontal angle or direction of a compass bearing
I have to disagree with using the letter based compass bearing for the purpose of this tool because a lot of houses don’t fit in the customary N/W/E/NW/NE orientation, hence why it’s better to use digits instead of letters to get more granular control of the angles to accommodate a larger audience. I find too many websites that use solar estimators locked in using just 3 or 6 fixed settings. Not flexible enough.
Take my house, it’s 9 degrees off true north. So, with panels on east/west, I can’t use W or E as 9 degrees is a big variation – 10% off the 90 deg. So by your example, I would have to use something ridiculous, something like WbN (using the 32 point letter compass) to get 279 deg meaning that my west side is slight facing north with majority facing west. It’s way easier to use numbers, it’s not that hard to translate letters to numbers but a lot harder to translate a angle to fit to a letter standard on a compass that is not 45/90 divisible.
Just saying….
Graham
Hi Graham
I never said anything about using letters. I was talking about using numbers from zero to 360 clockwise from north, rather than zero to +/-180.
Zero to 360 is less prone to mistakes when conversing with the lay public, and is the topocentric coordinate used in other fields of science and engineering that members of the public are more familiar with, e.g. astronomy when aligning a telescope, or in the military when aligning a gun, or in navigation when on a boat or an aircraft, or mapping.
Yes they are just different ways to express the same topocentric coordinate system. I’m providing feedback to suggest, for a tool that is being made available to the general public, it needs to be easily understood and use of coordinate systems the public is already familiar with will help.
Just saying…
Alex
https://solcast.com.au/rooftop-solar/free-pv-system-performance-estimation-tool/
Mark – here it is:
https://solcast.com.au/rooftop-solar/free-pv-system-performance-estimation-tool/
Hi Nick,
That is great…. for yesterday’s production, it was 2.8kWh below actual. It was cloudy but some variations are expected.
Today’s production, so far, it’s 6kWh below estimate, but I contribute that to grid over-voltage that occurred today ramping down some production. 43.9kWh est vs 37.9kWh actual.
But way easier to use. Thanks for that tool.
I dare say that it will put Solarquotes’ own estimator to shame 😮
https://www.solarquotes.com.au/solar-panel-efficiency-weather-calculator/
My system is a bit complicated with split panels between east/ west and 3 inverters. Plus, 1 inverter is oversized by 33% so it complicates the estimates a bit. I would have to split into two goes and then add them together to get a total.
“….. a bit complicated” ?
Mightn’t it be simpler to have a buketful delivered from the supermarket every other day? 🙂
In addition to my original post… on further thinking on the estimate vs actual production values.
I have to factor in the small tree that shades the panels on the east side early in the morning for about 2 hours and so I factor about a 2kWh loss there. Hmm, might need to trim that tree down a bit.
Then I have to factor in the age of the systems. The oldest one being 8 years old, then the second system 6 years old and the newest system 3 months old.
So, factoring all these things in would result in performance loss.
Looking at last Sunday (March 3rd), estimated performance was 48kWh and actual was 46kWh. When I consider the other factors above that affect my solar systems’ output, I would be very close to Solcast’s estimate and the tool is pretty close to almost being spot on for that day. So, that’s saying something! So, it seems that my solar system is still performing as expected given its age. I’ve always wondered if it ever performs to its tech specs. But I always knew that I would lose about 16% due to the east/west layout, that was a given. But Solcast’s tool made it more accurate to include all three variables. Most estimators are extremely rudimentary such as fixed N/W/E or NW/NE and fixed tilts angles. So, great work with providing more flexibility with angles. The only closest estimator was PVWatts but it doesn’t include performance impact from cloud cover.
The only negative feedback I would have:- the sliding bit is a bit fumbly to get to the right mark (maybe a direct input in the slider value or a auto-snap to a more granular figure, say, 50W increments for solar, 1 degree for azimuth, 1 degree for tilt). I’m sure most people would not worry too much about the 2 decimal placing in tilt and azimuth numbers.
Oh, now that got me thinking, a dual comparator (like dual loan simulators) to compare two systems with different attributes on the same screen, that would be really cool for users with multi-systems. Too much to ask for, eh?
But nevertheless, I give it a 99% score. Great work…..
Cheers,
Graham
Graham, we will work on making those sliders less fiddly! Thanks for the feedback and your detailed reply!
HI Nick,
I noticed the sliders have been adjusted… much better! Great job.
Yesterday’s estimate for 12/3 was 47.8kWh
Actual production for 12/3 was 47.67kWh.
So, a 0.13kWh difference…….. must have been a wayward cloud passing over for a short time….. But it was pretty much full sun all day. Or the panels need a wash and clean.
But, nevertheless, that’s pretty good.
Curious to see how the figures stack up today because it’s very overcast……..
Thanks,
Graham
It would be nice if we could try it without being datamined.
I’m not quite sure what valuable personal data you think you’re giving away with 4 sliders and a rough map… you could plonk the pin a few streets away if you’re concerned about giving away your location (and if you are, maybe start by not having a mobile phone)…
Solcast places ethics at the center of what we do. We are NOT mining your data with this tool & we are NOT tracking users of this free tool.
You could also try out renew’s Sunulator tool here.
https://renew.org.au/resources/sunulator/
A useful resource, but far more complicated & it does not use actual satellite based cloud tracking
Thanks Nick
That app is much easier to use than my spreadsheet!
Haha, yes it is mate – but yours did the job too 😉
Apologies Nick if this Q has already been asked and answered, but do your calculations account for topographical features like hills that “shade” morning or afternoon?
Thank you, Nick. Very easy to use.
For the period 03-08 March, the Solcast estimates are consistently higher than actual measurement (average +2.7 kWh/day), which I consider is appropriate for my situation given slight shading issues in the early morning and late afternoon.
When I changed the efficiency factor from the default 0.9 to 0.82, the Solcast estimates are very close to actual (average -0.3 kWh/day).
Great example of the “efficiency factor” is use. You can gauge the total losses caused by shading. Nice work Doug!
Currently my area is experiencing strong smoke haze from a recent bushfire in west gippsland (still smouldering) which obviously is effecting the sunlight,
I believe and expect this haze will have some effect on the efficiency of a solar panel array?
Smoke definitely will have an effect on PV output. Exactly how much is difficult to say without instrumentation as the human eye is very adaptable so we are really bad at judging absolute light levels. Very heavy smog, the sort that’s common in China, cuts solar output by about 15% so the bushfire smoke may have a similar effect. You could take a note of how many watts your solar system is producing with the smoke and compare it with what it produces at the same time of day when the smoke is gone. This won’t give a perfect comparison as temperature also affects solar output, but it should give a pretty good indication of what effect the smoke was having.
Definitely a factor. We ingest new information on “aerosols” daily, which captures the impact of smoke on the estimates. Great comment!
Hi
Firstly, I couldn’t get a web page that showed the sliders like near the top of https://www.solarquotes.com.au/blog/how-to-use-solcast/#more-26219
Anyway, following the instructions and exporting my data for the 8th March, it says I should have generated 23.36098kWh. My Enphase Enlighten system reported 21.9kWh.
I don’t know if EnlightenManager’s reporting is affected by what the installers have entered into the System Details page or whether it’s pure recording of energy, but the system page says I have 9 panels with an azimuth of 9 and 9 panels with an azimuth of 113. Given that when I look at Google Maps and have it rotated so north is directly at the top, 1 row is slightly east of North (which I gather should be negative 9) and the other is slightly south of east (which I gather should be -113, not positive). For my entry, I put -61 (difference between -9 and -113 is 104. Divide by 2 is 52, so -9 plus -52 is -61) as the azimuth (EnlightenManager doesn’t have anything for the tilt so I left it at 23.
So without finding that page that has the sliders to make any adjustments, it looks like the estimate is slightly over, but close – off by 1.4kWh.
Max,
What looks like are screengrabs on the Solcast’s website are actually live interactive graphics, meaning you can put your system’s paramaters and location into it directly on the website in realtime and get estimated last 6 days and current day to the time of inputting the variables of your system.
I think a lot of people have glossed over it, not realising the tool is right there.
Regards,
Graham
Helpful Graham, we will try to make it even more obvious
Max! You just need to click the hyperlink above & you will find a new tool that makes this all much easier.
You can find it directly here:
https://solcast.com.au/rooftop-solar/free-pv-system-performance-estimation-tool/
Seems spammy and unnecessary. You can pull data from your meter if you have a Digital Meter, you can do this via your Retailers website, so why would someone need an API to access this?
You also don’t mention the different meter types, if you have a basic non Comm meter at the property you won’t get any data as the meters only read every ninety days.
You can look at pulling data from your invertor, however each brand uses different software/firmware so unless the API is designed for each brand it won’t work.
So there’s really nothing to be gained by using this.
Adrian,
You’ve missed the entire point.
How do you know what your solar system should have actually produced over the last 7 days, taking into account ultra local weather, including cloud cover?
This tool shows you – so you can compare it with your inverter readings, and see if your solar system is working at 100% or if there is a problem.
So there’s lots to be gained by using this tool, it is incredible that Nick has made such a sophisticated tool free to use by anyone. Don’t be fooled by the simplicity – the tech going on under the hood is phenomenal.
@Adrian…
I’m with Finn on it.
It’s not spammy….where does it ask you to give your personal info?
Not all retailers can give you all the necessary details. It has nothing to do with the switchboard metering configuration.
This is a toolset to compare what a solar system should have produced versus what a solar system actually produced. Any large variation would be need be checked to find out why one’s system is underperforming.
The well known ones that affect production are:=
Ambient Temperature:- 0.5% loss for every 1C rise
Inverter efficiency – anything up to 10%
Grid Voltage – highly dependent on inverter’s capabilty to deal with GV over 253V
Shading
Once these have been checked and accounted for and there is still a large difference, then there must be something wrong with the panels or inverter.
The toolset is not designed to predict exactly what one’s system will produce on a given day. It’s merely a check to see how close one’s system’s production is to Solcast’s estimate based on local cloud/solar radiation data for the day.
Just now, I’ve checked my estimated vs actual production. It’s out by 0.08kWh. 37.88kWh estimated vs 37.8kWh. At least I know that my system is performing as expected given the conditions. I find that incredible given that there are thousands of locations to calculate solar production based weather/cloud conditions to come up with a figure that is extremely close. This figure is 99.7% accurate. Obviously, there is a small variation, but I’m not going to fuss over a 0.3% difference.
I think you should rethink your comments, entirely off the mark and not even on point.
Regards,
Graham
Thanks Graham! 0.08kWh is pretty good!
We do not collect your personal info or track users! No spam involved!
So comparing the output of this great tool with the Fronius Solarweb output, I was able to match the values when I adjusted the efficiency factor to 0.96. How do I interpret this? Is this value considered “normal” and expected? My 6.4kw Sunpower/Fronius system was installed less than 2 months ago. I have a 10 panels NE/10 panels NW setup.
Yes, I’ve done the same thing… to get yesterday’s output part of my system (my 9 y.o. panels, new inverter) would have to be >100% efficient!
Stoked!
Wow, not bad!!
Andrew
Typical degradation rates are 0.5-2% per year.
An installation at 0.96 is performing very well & you should not be concerned.
Hi Nick
This tool would be very useful then to track degradation rates over time. Thank you for making this available!
These are my past 6 days. Estimate seems to have struggled with the inclement weather we’ve been having lately.
I use the URL method as I have split array orientation.
Actual / Solcast Estimate
12-Mar 90.8%
11-Mar 91.5%
10-Mar 84.9%
9-Mar 85.8%
8-Mar 84.5%
7-Mar 125.0%
I’ll look into a half hourly assessment later.
Yes, complicated cloud cover conditions can lead to reduced accuracy. Pariticularly with storms!
Firstly – excellent tool and thanks Dr. Nick
Any instructions on how to calculate split arrays. I have 9 panels facing about 15 deg west of due North and another 23 panels facing about 15deg South of due West.
So would it be something like this:
Difference between arrays 90 deg
90 x 71.875% (percentage of panels facing just south of west) = 64.6875deg +15 deg (starting point) = rounding up 80deg on your calculator?
Does that seem right? It’s obviously only an average as you really need to treat it as two separate arrays because sunlight will vary on how it hits the panels particularly early and late in the day.
Setting my efficiency to 100% your estimate is sometime’s under and sometimes over though I can’t set the exact size of my array (9.269 is the best I can get on the calculator and the system is 9.28kW (32x290W panels)). It’s only 11 watts so very minor. I’m not 100% sure on the azimuth so I left the default being a typical truss and rafter prefab roof constructed in the mid 90’s in Sydney. I think what the data shows is there is nothing wrong with the system and it’s performing as expected or even a little better.
Solcast:(at 100%) SolarEdge
Fri 8 47.73 49.89
Sat9 13.71 15.22
Sun10 47.89 45.50
Mon11 47.30 45.31
Tue12 49.90 50.39
Wed13 12.77 14.64
Thu14 3.93 (until 11.10am) 4.18
Improvements I would love to see:
1. I think it would be great if you did offer a way to remember your settings – (I couldn’t care less about data mining and if you say you don’t do it, you don’t do it 🙂
2. A way to numerically set your array size – ie click on the slider and enter a number.
3. A way to enter split arrays – say up to 3 orientations.
Thanks again Dr. Nick:)
Great feedback, I will share this with our development team. Your approach to split arrays is quite sensible!
@Mondo….
I have a split array too.
What I do is do one array first – note its figure. Then do the second array, note its figure. Then add the two for the combined performance. It’s pretty accurate for me.
You can’t average it out as cloud cover will change output for each array during the day.
But as I suggested in my earlier post of March 9th, a comparator/split screen like home loan simulators to compare different numbers would be really good.
Otherwise, just two browsers side by side with the different parameters entered for each array based on their sizes/tilt/azimuth. It’s really about the panels, not the inverter itself.
Regards,
Graham
Come to think of it… just realised a quick workaround is use to split views in Firefox or Chrome…they are just add ons to split the the browsers into two views so you can view the same web page on the two browsers side by side on the same monitor.
For Chrome – it’s called Tab Scissors
I think for Firefox, it’s called Side View…
Couldn’t care less about IE.
Here’s a link to a screenshot of my two systems where you can see two systems at once using Firefox’s Side View on one monitor.
https://drive.google.com/file/d/1g7WCBzGSTdrvBKVOcYPgtmze09-M52yZ/view?usp=sharing
Cheers,
Graham
And this is the screenshot from Chrome’s Tab Scissor View.
https://drive.google.com/file/d/1BCMpMMKyqbiNhH8nFCr7sV9G0_Wb3-9h/view?usp=sharing
The screenshot is from a single monitor view. So, it’s handy for those that don’t have dual displays.