
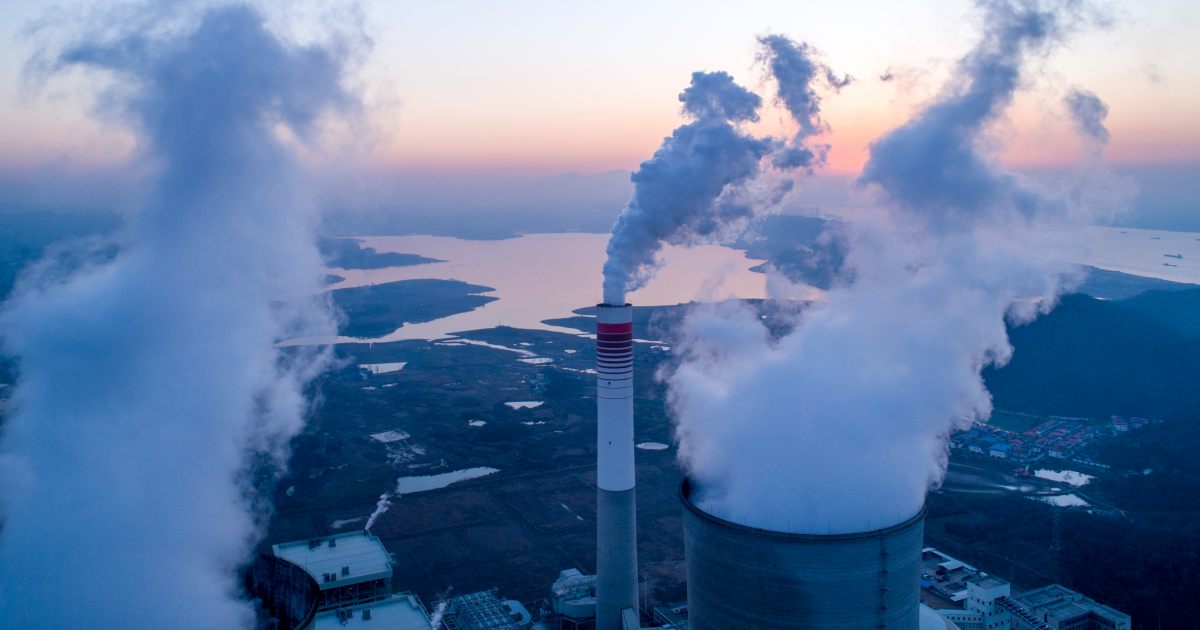
Global energy-related carbon dioxide emissions hit their highest level ever last year according to a report from the International Energy Agency (IEA).
Emissions jumped by 6% (2 billion tonnes+) in 2021 to 36.3 billion tonnes due to a world economy rebound that relied heavily on coal power. The IEA says the increase was the “largest in history” in absolute terms.
While renewables-based electricity generation also saw its largest ever growth, adverse weather and energy market conditions including spikes in natural gas prices resulted in more coal being burned. The switch from gas-to-coal for electricity pushed up global CO2 emissions by well over 100 million tonnes.
“The numbers make clear that the global economic recovery from the Covid-19 crisis has not been the sustainable recovery that IEA Executive Director Fatih Birol called for during the early stages of the pandemic in 2020,” states the IEA. ” The world must now ensure that the global rebound in emissions in 2021 was a one-off – and that an accelerated energy transition contributes to global energy security and lower energy prices for consumers.”
In July last year, Mr. Birol lamented that while many governments were talking of the importance of building back better, i.e. greener, many were “yet to put their money where their mouth is“.
Renewables Generation An “All Time High”
The report notes electricity generation from renewables exceeded 8, 000 terawatt-hours (TWh) in 2021, up 500 TWh on 2020. Output from wind power increased by 270 TWh, while solar PV increased 170 TWh. However, hydro generation saw a 15 TWh decrease due to the impacts of drought, particularly in the USA and Brazil.
Nuclear power electricity output jumped by 100 TWh last year.
“Without increasing output from renewables and nuclear power, the rise in global CO2 emissions in 2021 would have been 220 Mt higher,” says the IEA.
Per Capita Emissions
CO2 emissions overall in advanced economies fell to an average 8.2 tonnes per capita last year; below the average of 8.4 tonnes in China. But many advanced economies rely heavily on China for manufacturing; effectively outsourcing their emissions to the world’s factory.
The report notes while per capita emissions fell in advanced economies, there were wide differences among them. For example, per capita emissions averaged 14 tonnes in the United States.
Australia wasn’t specifically mentioned, but we tend to rank pretty high up on emissions – in a bad way. I haven’t been able to find 2021 figures after a quick search, but according to the OECD, the 2018 Australian average was 22.4 tCO 2 e/ca. The Australian Government’s National Greenhouse Gas Inventory annual emissions data for 2020 indicates 505.5 million tonnes of emissions for that year, which works out to around 19.6 tonnes per capita. 2021 emissions haven’t been finalised, but by the end of the September quarter they had already hit 501.5 million tonnes – with three months left to go.
The IEA notes per capita emissions in other emerging market and developing economies worked out at 2.34 tonnes in 2021.
All the findings from the IEA’s Global Energy Review: CO2 Emissions in 2021 report can be viewed here.
 RSS - Posts


“Australia wasn’t specifically mentioned, but we tend to rank pretty high up on emissions…”
It seems so. Per Our World in Data, including carbon dioxide (CO₂) emissions from the burning of fossil fuels for energy and cement production, but excluding land use change, for selected countries in the year 2020:
Qatar: _ _ _ _ 37.02 t CO₂ per capita
Saudi Arabia: 17.97
Australia: _ _ 15.37
USA: _ _ _ _ 14.24
Russia: _ _ _ 10.82
China: _ _ _ _ 7.41
EU-28: _ _ _ _5.71
https://ourworldindata.org/co2/country/australia
The Our World in Data is apparently sourced from: https://www.globalcarbonproject.org/carbonbudget/21/data.htm
A 139-page report by the former Australian Chief Scientist (Nov 2008 to Mar 2011), Professor Penny Sackett, to the Independent Planning Commission NSW (IPCN) titled Expert Report to the NSW IPC on the Greenhouse Gas and Climate Implications of the Narrabri Underground Mine Stage 3 Extension, was published on the IPCN website on Mar 2, and it included:
https://www.ipcn.nsw.gov.au/resources/pac/media/files/pac/projects/2021/12/narrabri-underground-mine-stage-3-extension-project-ssd-10269/public-submissions/submissions-on-behalf-of-lock-the-gate-alliance/220225-penny-sackett_redacted.pdf
What Australia does matters.
Geoff, it depends on the metric you use. In absolute terms Australia is not a major player in CO2 emissions – the top 10 ‘countries’ (incl. the EU) produce about three-quarters of all CO2 emissions, with China responsible for a third. Australia well and truly trails those nations, being loosely on par with the UK or Turkey.
When comparing on the basis of emissions per square kilometre however – share of sovereign territory \ flora converts CO2 to oxygen, Australia is near the bottom quartile! While older figures, Australia is roughly on par with Kyrgyzstan and Peru.
Australia doesn’t matter and never will unless China, America, the EU, India, Russia and Japan undertake radically change. Regardless of whether you use an absolute measure or a per square kilometre metric, China and assorted EU nations remain amongst the worst of CO2 emitters.
George, every molecule of carbon dioxide matters exactly as much as every other.
Yes and no. If CO2 is akin to body fat then it’s much easier for the guy with 50% body fat to drop a few points than it is for the guy who is 5%. Superficially that’s the per capita argument. If CO2 is more akin to rainfall then there’s a huge difference between 1 mm over 100% over a country, and 100 mm of rain over 1% of said country. A modest amount is necessary for life to function, too much and life ceases to function. CO2 is the same.
If you look at a heat map of Australian emissions, esp. as compared to global emissions, you’ll see Australia doesn’t really rate, with the exception of half a dozen spots – basically the superdense high emission capitals. China by contrast is lit up – at least the eastern half. Remember China produces over 27x the CO2 as Australia yet is only a quarter larger. What about Europe? Also lit up, though not as brightly. What about the US? The eastern half and California are lit up, perhaps on par with Europe.
Feel free to quibble with the source\date, but this is an interesting graphic: https://i.redd.it/hnh8diyo45g21.png
George Kaplan,
“In absolute terms Australia is not a major player in CO2 emissions”
What data do you base that on, George? The evidence/data shows otherwise.
Per BPSRoWE-2021, in the year 2020, in absolute terms:
The top 5 coal producing countries include (in Exajoules):
1. China: _ _ _ 80.91 (50.7% global share)
2. Indonesia: _ 13.88 (8.7%)
3. India: _ _ _ _12.68 (7.9%)
4. Australia: _ _12.42 (7.8%)
5. USA: _ _ _ _10.71 (6.7%)
The top 10 fossil methane gas producing countries include (in Exajoules):
1. USA: _ _ _ _ 32.93 (23.7% global share)
2. Russia _ _ _ 22.99 (16.6%)
3. Iran: _ _ _ _ _ 9.03 (6.5%)
4. China: _ _ _ _ 6.98 (5.0%)
5. Qatar: _ _ _ _ 6.17 (4.4%)
6. Canada: _ _ _ 5.95 (4.3%)
7. Australia: _ _ _5.13 (3.7%)
8. Saudi Arabia: _4.04 (2.9%)
9. Norway: _ _ _ _4.01 (2.9%)
10. Algeria: _ _ _ 2.93 (2.3%)
https://www.bp.com/content/dam/bp/business-sites/en/global/corporate/pdfs/energy-economics/statistical-review/bp-stats-review-2021-full-report.pdf
Australia is the world’s largest metallurgical coal exporter, and second largest thermal coal exporter.
https://publications.industry.gov.au/publications/resourcesandenergyquarterlydecember2021/index.html
Australia is the world’s largest LNG exporter.
https://www.upstreamonline.com/lng/australia-remains-worlds-top-lng-exporter-but-it-could-lose-its-crown-this-year/2-1-1147625
“Regardless of whether you use an absolute measure or a per square kilometre metric, China and assorted EU nations remain amongst the worst of CO2 emitters.”
I’d suggest it’s the fossil fuel producers that facilitate GHG emissions. If there weren’t producers of fossil fuels then global human-induced GHG emissions would be drastically reduced. The data undeniably shows Australia is a major fossil fuel producer in absolute terms. What Australia does matters.
https://theconversation.com/how-to-answer-the-argument-that-australias-emissions-are-too-small-to-make-a-difference-118825
Ultimately, rising global atmospheric GHG concentrations will make it worse for us all. Australia will be one of the countries with much worse consequences, experiencing higher temperatures, more extreme droughts, fire seasons, floods and more extreme weather. IMO, Penny Sackett presents a sobering future.
Two-thirds of global emissions are from 5 ‘countries’ – China (a third of global emissions and rising sharply), plus the US, EU, India, and Russia. It follows that the IEA report is focused on these nations, well Japan is subbed for Russia for some reason but perhaps the #5 and #6 positions swapped?
According to Figure 5 China produced half the emissions of the 5 listed nations. The report then diverts to per capita emissions as if this were somehow relevant – it isn’t.
While the IEA notes coal comprised 40% of the growth in global CO2 emissions, there doesn’t appear to be any breakdown of power generation. And since this is growth since the 2020 crash, it’s not clear if there’s actually been significant growth – the report only mentions CO2 emissions rising by 200 Mt. since 2014 yet measurements of emissions are in Gt. Perhaps one fifth of a significant point of measurement?
My bad – Coal-fired power plants provided half the increase in global
electricity demand in 2021, and Coal’s share of global generation rose above 36%. Since Coal was 37% in 2019 that ‘rose’ is questionable. Sadly no comparable stats are given for non-coal forms of power. Nuclear power output expanded by 100 TWh, Wind & Solar by 270 TWh and 170 TWh respectively.
In China alone demand rose by 700 TWh in 2021. Coal fulfilled 56% of this rise, and renewables 28% of total generation, which sounds good except Hydro + Pumped Storage Hydro + Wind + Solar + Biomass comprised 27.8% of generation in 2019 so while there’s been an increase it’s incredibly small. Most of China’s growth in power generation remains Coal.
Replying to George Kaplan,
There are various types of ‘climate change’ denialism to be found along a spectrum of positions. Those positions include
‘hard versions”,
“soft” versions, ‘
denying that climate change exists at all’,
“taking it seriously but we won’t need to worry about it until 2050”.,
“OZ contribution is so small compared to other countries why should WE get alarmed about it” .
“Countries X, Y Z etc pollute far more than we do, THEY should get their act together”,
“We are still emerging from an ice-age, so naturally things will get warmer over the next few centuries”,
“latte sipping greenies who are all commies you know, deliberately start bush-fires”,
“It’s all a hoax, designed ultimately to take away our freedom, so lets burn down Parliament House so Democracy is saved ”
All the above seem to change every month or so, depending on how many sensationalist media headlines have hit our TV or lap-top screens
One result of all of this is that here in OZ, we have done nowhere near enough over past years/decades to compensate for the ‘add-on’ effects that ill-considered or completely thoughtless human activity has had on naturally occurring cycles.
This article from the Business School at the University of New South Wales gives some insight into why China is on the one hand, shutting down coal power stations in some regions before the end of their useful life, but building new ones in other regions. China has coal fields of it’s own it could mine, but those are so far away from some regions, transporting mined coal to those regions is hugely expensive and the infrastructure to do so doesn’t exist. It’s cheaper in that case for them to import it and have it unloaded nearby to the relevant coal plants.
https://www.businessthink.unsw.edu.au/articles/australia-coal-future-china
Note: the above article, published in Jan 2021 is over a year old
it’s worth noting that:”.., the stations in that region had a median age of 15 years at (their time of) closure.
In contrast, coal plants that closed in Australia between 2010 and 2017 had a median age of 43 years.”
The UNSW article also concludes that: “The Morrison government, and industry, should redouble efforts to rapidly expand renewable energy in Australia. Then we can leave coal behind, and emerge as a renewable energy superpower.”
Whether or not the LNP will find it hard to redouble doing ‘not much at all, and doing it too late anyway” is a moot question. I’m sure that even I could come up with a plan to make a plan to do so. Although by the time we get through some ‘Committee of Enquiry’ to investigate it’s feasibility, we’ll probably need to have another one to see whether quadrupling it is needed. .
Recently, I’ve had some fencing work done at my home. The guy doing the work is a typical very hard-working Australian ‘tradie’. Obviously you get to have conversation with them, and here’s his summation of how he see’s climate change: (I’ve left out all the swear words).
1) anyone who builds or buys a beachfront property, at sea level, or in a canal development that’s been built on reclaimed mudflats is a complete moron.
2) he’s completely ‘p.o.’ because his crew couldnt turn up on his second day of work, due to heavy flooding in their suburban area, the like of which they’ve never seen before. That’s going to delay his scheduling, and he’ll have to reschedule all his other clients who’ve been waiting
3) he’s concerned enough about ”climate change’ to want to buy an EV utility, but the asking price is so high there’s no way he’ll ever be able to afford one.
4) Very annoyed about the fact that he and his family went for a Barrier Reef holiday a couple of months ago, only to find that it’s largely disappeared..