
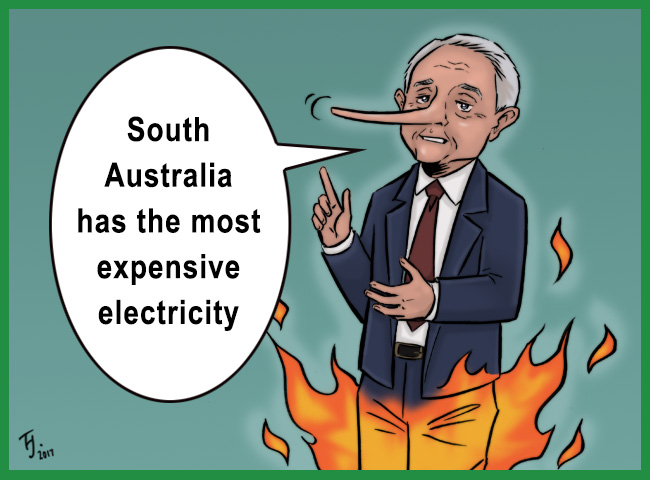
Not true Malcolm! A typical house in SA pays less per kWh for electricity than any other state except NSW.
Grid electricity is not cheap in South Australia. Here in Adelaide it’s never a happy time when I get an electricity bill. My last quarterly bill was $203 for 389 kilowatt-hours of use. All up, that means I paid over 52 cents for each kilowatt-hour of grid electricity.
But my usage isn’t typical. Most South Australians pay much less per kilowatt-hour. I decided to investigate how much typical households pay in each state and territory and gathered information on electricity consumption, fixed costs, charges per kilowatt-hour, electricity bill discounts, and controlled tariffs1.
After crunching the numbers I found typical households in Victoria now pay the most for grid electricity, while those in Canberra pay the least. I also found that of all the states, South Australia had the second lowest cost of grid electricity, which is definitely not what politicians and pundits on TV, in newspapers, and on the internet tell us.
We have heard over and over that South Australia has the most expensive electricity in the nation and how that’s supposed to be the fault of renewable energy. But it is simply not true. It is coal powered Victoria which has the most expensive residential grid electricity while South Australia is the second cheapest state after mostly coal powered NSW.
The average price paid by typical households in Australia, after adjusting for population, comes to 29.4 cents a kilowatt-hour. This is not the highest cost of grid electricity in the world, but it is among the most expensive and the bad news is electricity retailers are about to push prices higher.
Before long I’ll write an article detailing how much extra you’ll soon have to pay for grid electricity so you’ll know how much nose widening surgery you’ll have to schedule to make it easier to pay through it, but the rest of this article is about how I worked out how much representative households in each state and territory pay per kilowatt-hour.
A Typical Household Is Not An Average Household
Finding out how much the typical household pays for grid electricity seems like it should be easy. I could just use the SolarQuotes Electricity Plan Comparison page to find out what people are charged per kilowatt-hour and their daily supply charges. But to do that I’ll also need to know how much grid electricity typical Australian households use.
A typical household is not the same as an average household. By typical, I mean the most common type. For example, the average household has 2.6 people, but the most common household size is 2 on account of how the police frown upon cutting people into portions.
Just what is typical will vary from state to state. While 2 is the most common household size throughout Australia other considerations vary. For example:
- Typical Household has gas — Victoria, NSW, Western Australia, ACT.
- Typical Household is without gas — Queensland, South Australia, Tasmania, Northern Territory.
- Typical household has off-peak hot water — Queensland, NSW, South Australia.
- Typical Household has a pool — Nowhere – not even Queensland.
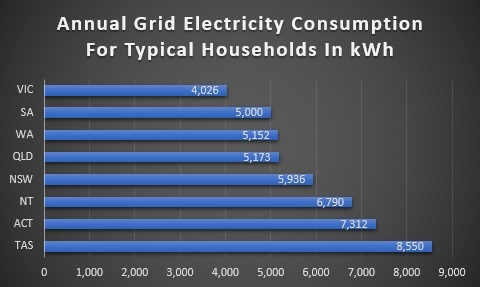
Fortunately, the Australian Energy Regulator (AER) provides figures for annual residential consumption in each state and territory for a typical household or what they call the representative consumer2. And where these aren’t available the Australian Energy Market Commission (AEMC) has taken figures from state governments3. The annual electricity consumption of representative consumers by state and territory are:
What Typical Households Pay Per Kilowatt-hour
Using the yearly electricity use of representative consumers it is possible to determine how much a typical annual electricity bill is. In Western Australia, Tasmania, and the Northern Territory electricity prices are regulated, which means my calculations will be spot on, while other states have competing electricity retailers.
Origin Energy is Australia’s largest electricity retailer, so I have assumed they are the most typically used retailer in NSW, Victoria, Queensland, South Australia, and the ACT. I have used their Maximiser plan, partly because it appears to be their cheapest and partly because Origin has tried to convince me it is “popular” and so it may be a commonly used plan. I have also assumed people will typically want to save as much money as possible and so any conditional discounts, such as for direct debit or paying on time, will always apply.
I only looked at standard plans and not time-of-use. I have assumed 25% of electricity use is on a controlled tariff (also known as an off-peak hot water tariff) in NSW and South Australia, and 20% in Queensland4. Where there is a choice I have assumed the controlled tariff will be the cheapest available.
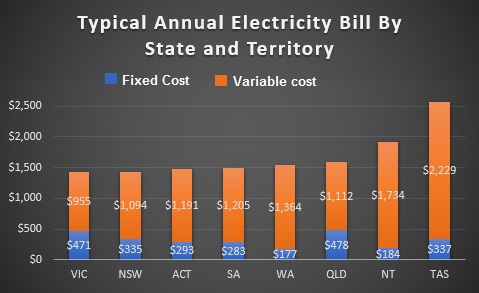
This gives the following as the typical annual electricity bill in each state and territory:
Fixed Costs As A Percentage By State And Territory
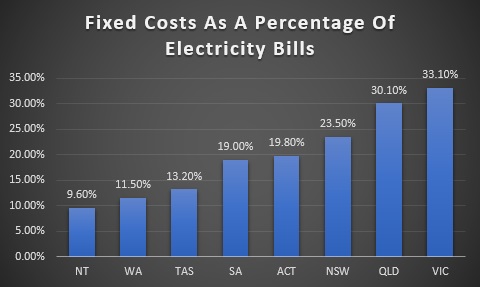
Looking at the above graph, one thing that leaps out like a cat in a horror movie is how much of the typical household electricity bill consists of fixed costs. The percentage by state and territory is:
Cost Of Electricity Per Kilowatt-Hour For Typical Households
By taking the total cost of the typical annual electricity bill and dividing by the kilowatt-hours used, the cost of grid electricity per kilowatt-hour can be determined:
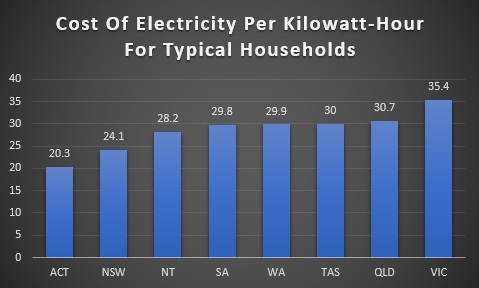
As you can see, rather than having the highest electricity prices in the country as is commonly believed, typical households in South Australia pay the second lowest cost per kilowatt-hour out of all the states.
What is a surprise is that Victoria, which is generally regarded as having low electricity prices, now has the highest cost per kilowatt-hour for typical households in the nation.
For Large Users Of Grid Electricity SA Is Still Not Most Expensive
Not every household will use a typical amount of electricity and if we look at households that use double the typical amount of electricity and keep all else equal, Victoria remains the most expensive state, while South Australia will still be cheaper than Western Australia and Tasmania, but will become more expensive than Queensland while tying with the Northern Territory.
Small users of electricity will get screwed over the most in Queensland and Victoria because of high fixed costs in those states.
Controlled Tariffs Are Important
Controlled tariffs are generally used to power hot water systems and are common in Queensland, NSW, and South Australia. Because they are common it is perfectly reasonable to include them in calculating the cost per kilowatt-hour paid by typical households.
If it is instead assumed that households don’t use controlled loads, or off-peak hot water as it is often called, then South Australia does become the most expensive state for grid electricity, followed by Victoria and then Queensland.
Australia’s Average Typical Electricity Price
It is possible to take the average price per kilowatt-hour for grid electricity in each state and territory, adjust it for population, and determine the average typical electricity price Australians pay. It comes to 29.4 cents per kilowatt-hour. Because this is an average of typical prices it will be slightly higher than the straight average paid by Australian households, but not by much. We don’t have the highest electricity prices in the world, but they’re definitely not cheap.
The United States has similar levels of grid reliability as Australia and their average cost of residential electricity is 17.1 Australian cents per kilowatt-hour, while in Canada it’s around 13 Australian cents5.
South Australia Beats All States Except NSW
Despite the fact we hear it over and over in anti-renewable arguments, the belief that South Australia has the highest household electricity costs in the country is simply not true. The state with the highest residential cost of electricity is Victoria, which has the most carbon intensive grid in the country, and until just recently, possibly the world.
Some of the confusion is understandable. South Australia’s electricity prices have been high in the past and the variable cost of electricity on a standard tariff is the highest in the country. But a combination of three factors:
- Low fixed costs in comparison to all other states except Western Australia.
- A large part of household electricity use is on a lower cost controlled tariff.
- Greater electricity increases in other states.
Have combined to make South Australia’s residential electricity the second cheapest of all the states.
Now that I’ve written this article I’m sure no one will make the mistake of saying South Australia has the most expensive electricity ever again.
Footnotes
- Controlled tariffs are often called “off-peak hot water” as heating water is what they are usually used for. They are common in Queensland, NSW, and South Australia. ↩
- If you download the AEMC PDF you will find the information on pages 67 and 68. ↩
- Unfortunately, the figure provided for Western Australia was for a 4 person household, which is not the typical size. So I used a figure for a 2 person household provided by the Australian Government Energy Made Easy Benchmark site. This was from 2011 and so not as up to date as the other figures, but should still be reasonably accurate. ↩
- Controlled tariffs, or off-peak electricity in these three states is mostly used for hot water and Queensland uses less hot water than the other two states either because the climate is warmer or because Queenslanders disapprove of bathing. ↩
- I’d be happy if any experts on Canadian electricity prices could refine this figure further. I added in their GST and HST and attempted to allow for Provincial taxes. ↩
 RSS - Posts


Well. That is interesting.
you must live in a tent.
I am one house 3 people 5KW solar max.from a 6KW system
Peak 986KWH
Next peak 880 KWH
Controlled load 475KWH
Feed In 533KWH.
Actually, when it comes to grid electricity I am a bit of a hog. It is Finn who lives in a luxurious eco tent:
https://www.solarquotes.com.au/blog/got-33-power-bill-solar-even-crappy-8c-buy-back-rate/
Ronald. I’m a bit uneasy about your methodology
“I have used their (Origin’s) Maximiser plan. ……….I only looked at standard plans and not time-of-use”
In NSW, Maximiser is a Time Of Use plan. (There are actually three “Maximiser” Plans, ORI270498MR – TOU with Controlled Load 1; ORI270495MR – TOU with Controlled Load 2; ORI270496MR – TOU with Controlled Loads 1 and 2)
Of the 126 plans currently available for my suburb on the Energy Made Easy site the cheapest fifty are all TOU plans. I suspect there may no longer be any “standard” (ie single rate) plans available in NSW. AGL used to have AGL199991MR (AGL Fixed), but this was withdrawn in December 2016). What is the actual Offer Id of the product you used for NSW costing?
Once you base your costings on TOU, then you are on a slippery slope drawing any conclusions because the same quantity of electricity will have a different price depending on the time(s) during the day that you used it.
What I’d prefer you to do is to :
1) set up three scenarios – low, medium and high daily use using representative quantities for Peak, Shoulder, Off-Peak and Controlled Load. 2) choose a suburb in each of the capital cities and identify the cheapest product for each of low, medium and high usage.
3) compare the low, medium and high usage results across the States.
If you follow that methodology you do not need to worry about how many people are in each household:- you are simply comparing like-for-like usage, using the cheapest Offer available for that usage, in each State.
Hello Harry. When I go to the Origin Energy site and look up their “Maximiser” plans for NSW they offer ones with a standard tariff. I used the Origin site to get the information straight from the horse’s mouth. Their one for the Endeavour Distributed Network Service Provider area is apparently called ORI270459MR.
Ah Ronald, I owe you an apology.
I’ve been mislead by the Energy Made Easy web site.
Let me explain – for the benefit of anyone else intending to make use of the site.
When you go to the site you will be asked a set of questions: where do you live? etc To estimate your bill under each of the Offers available, the site asks for details of your last bills. It asks whether you are on Time Of Use (TOU), or whether you are on Single Rate. I _assumed_ that was a QA question, to make sure that if you are on TOU you will enter all three of Peak, Shoulder and Off-Peak usage, not just one of them.
However, it doesn’t work like that. If you say you are currently on TOU, then Energy Made Easy will give you _only_ TOU Offers. It will not give you any Single Rate Offers.
If you want Single Rate Offers, you’ll need to re-run the query and say you are currently on Single Rate (and provide a composite usage figure). I spent a few hours this morning doing just that. I’ve found that – for my usage (in NSW) – the cheapest few are still TOU Offers, but there is little to choose between them and the best of the Single Rate Offers.
So my advice to anyone using the site is to make sure you run the query twice, to ensure that you get all the Offers available.
No problem, Harry. I figured wires must have gotten crossed somewhere.
And thanks for the warning.
My May account with Momentum Energy (no gas, just electricity) was 257.71, total kWh used was 1045.286. The total bill, as above, included 1.06 dollars per day “daily charge”, Peak step 1 electricity charge is .189600 per kWh, Peak Step 2 electricity charge is .21600 per kWh. If you work out the total cost per kWh, you will find that it is down there in the bottom three states
That was May 2016 actually. The 90 Day Bill from 1/12/16 to 28/2/17 was 527.64 all up. Electricity supply Step 1 went up from 18.9 cents per kWh, to 19.06 cents per kWh. The step 2 rate went down to 21.5 cents per kWh. Total kWh used was 2072.8 kWh. Once again, divide that up your own way, and Victoria still has one of the least expensive rates in Australia. A slight rise in daily usage charge, but slightly lower kWh rate. BTW: Strangely enough, a letter arrived from Momentum in January advising that my electricity bill would not be increasing during the whole of 2017. Pretty good value from my point of view.
I wonder how it is possible for the PM to say “SA is most expensive” and Ronald to say “SA is nearly the cheapest”.
Are they comparing like with like?
I’m guessing that the PM hasn’t worked out the figures for himself, like Ronald has, but is quoting some authority; such the Australian Stock Exchange (ASX) for energy futures, or the Australian Energy Regulator (AER) for historical energy costs.
The AER publishes a weekly report. The most recent (week-ending 29-04-2017) is at :
aer.gov.au/wholesale-markets/market-performance/electricity-report-23-%E2%80%93-29-april-2017
Figure 9 in this report shows quarterly base future prices Q2 2017 to Q1 2021. (Prices supplied by the ASX)
This shows that SA prices are higher than for any other state
Table 1 in this report is Volume-weighted average spot prices by region ($ per MWh)
This shows for the current financial year the prices have been:
SA 125
Qld 106
NSW 88
Tas 69
Vic 62
It would seem that the PM is talking about wholesale prices (which will feed through into future retail prices), and Ronald is talking about current retail prices.
Given that they are talking about different things, each one can be correct
What a load of crap is this article. You can crunch number and prove what ever crap you want to prove but $0.38 per Kwh is the real number that is displayed on my bill. By the way it is not the greenhouse gas that we fart matters but the implication of high energy cost on technological innovation. More than a million job opportunities and billions of dollars that are raked in by crypto nerds around the world by cheap electricity is lost by us Aussies. Students in universities are putting off projects bcoz they cannot afford to experiment on equipment guzzling 1-2kwh hour of electricity. Oh but then we are the greens why should we care about someone inventing anything in australia bcoz we can always get it from out commie masters from china.
Your argument would be ok if only you stuck to the facts and particularly the fact that wind and solar are cheaper forms of energy than coal. Furthermore coal comes with additional costs that must be paid by households. The most obvious is the health cost which according to a NSW Government study is around $2000 per household. This covers the cost of the health department in dealing with the health problems caused by air pollution. It does not include the individual cost to those made illor who have died from respiratory disease, cancer or heart attacks or their loss from being unable to work.There are many such costs of coal burning that are not included in calculations of different power prices. Just think of it as a GST on coal that is bigger than the cost of the coal power generation itself.
do you realise that ALOT of SA electricity comes from Victoria ….
hmmm no wonder they pay less …. SA pays for their left over
SA now exports a lot of power to Victoria –
https://www.adelaidenow.com.au/news/south-australia/south-australia-exporting-power-to-victoria-as-eastern-state-imports-tumble-tenfold/news-story/f59c7913f699de8e77ab0bee5ada193d
https://www.theguardian.com/australia-news/2018/jun/05/south-australia-rides-renewables-boom-to-become-electricity-exporter