
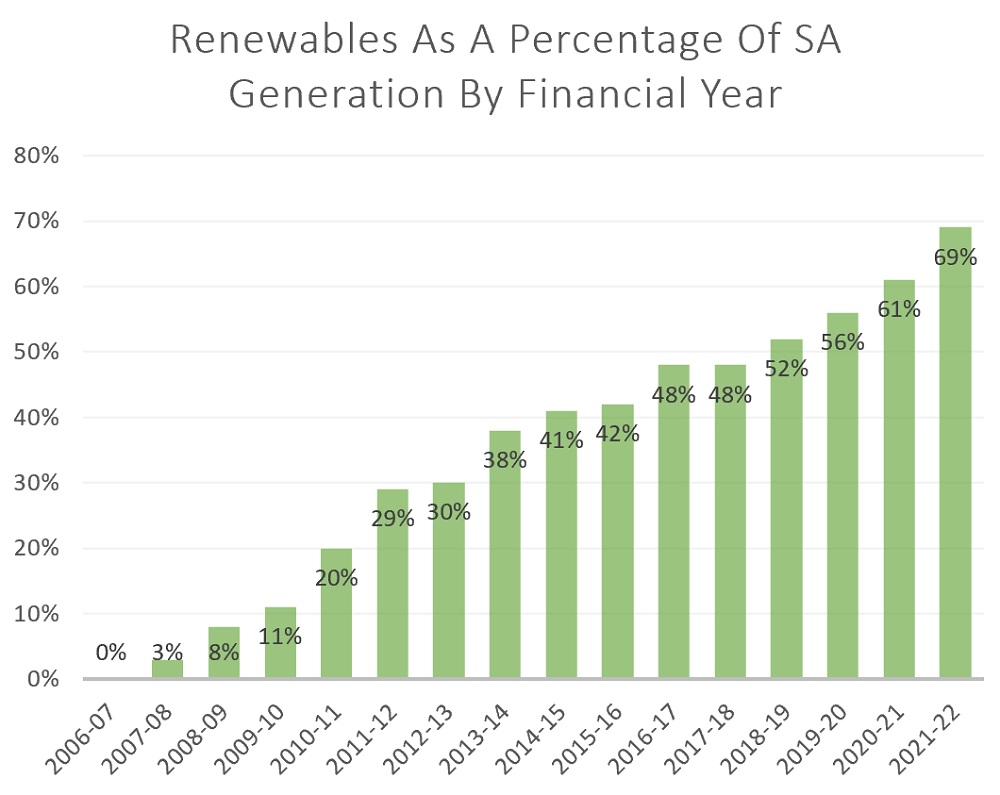
Recently I wrote about South Australia going from zero to 70% renewable energy generation in 16 years, resulting in:
- reduced greenhouse gas emissions
- improved air quality
- lower electricity prices than we’d have without those renewables
But – although our electricity prices would be much higher without renewable energy, electricity prices – overall – have still trended up over those 16 years. And that’s because many things affect electricity pricing.
A lack of competition is one factor pushing up prices, but the main influence is the rising cost of natural gas. Its price began to increase in 2015, recently reaching record highs. The cause of the recent increase was a decision made in Moscow. This decision affected us because we decided to expose most of Australia to international gas prices. That decision is all on us1.
Since the closure of the state’s last coal power station in 2016, natural gas has provided almost 99% of South Australia’s non-renewable generation. Last year it provided just under one-third of the electricity generated in the state. Because gas is a very flexible form of generation, it often acts as a price setter and, thanks to the way Australia’s wholesale electricity markets work, increases in the cost of gas tend to push up prices paid to all generation. This applies even if the generation cost of other sources decreases.
South Australia’s rapid increase in renewable capacity has helped limit the increase in its electricity prices. It’s easy to see it is helping when you look at this graph. See how often wind and solar power have supplied more electricity than the state consumes over a spring week:
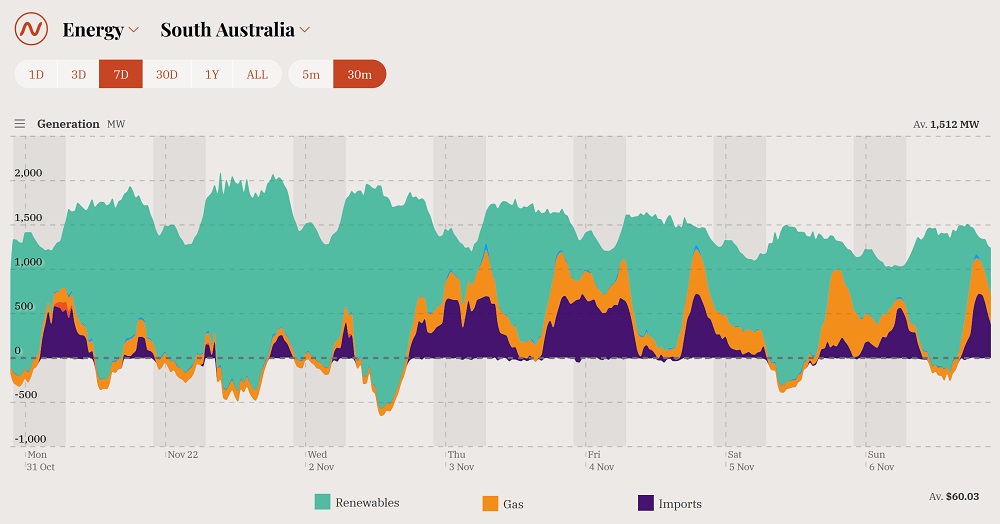
This graph is from OpenNEM. The blueish-green represents wind and solar energy generation, and when it falls below the dotted line, it supplies more electricity than the state consumes. (The surplus is exported to Victoria to help them catch up to how awesome SA is.) During these periods, wholesale electricity prices are normally either low, zero, or negative.
When renewables supply more electricity than the state needs, gas generators can’t normally set the price and prices can fall very low or go negative.
Below, I’ll use inflation-adjusted figures to show what happened with South Australia’s wholesale electricity prices as renewable energy generation increased. Then I’ll do the same for the state’s gas prices and show how they have an oversized effect on wholesale electricity costs.
Renewable Energy Should Lower Prices
South Australia’s renewable generation percentage has grown faster than anywhere else I can think of:
On our electricity bills, we pay a wide range of costs that include transmission, distribution, and retailing. But I’m just going to focus on the wholesale price of electricity2, which is what generators are paid for the electricity they provide to the grid.
Wind and solar generation lowers the average price of wholesale electricity in three main ways:
- Zero fuel cost: they will accept — or bid in — a lower price for electricity than fossil fuel generators that have to pay for fuel.
- Lower cost: new renewables, including energy storage, is now cheaper to build and operate than new fossil fuel generation.
- Increased Competition.
But the wholesale price of electricity depends on what else is going on in the electricity market.
Prices Look Like They’ve Gone Up
Here’s a graph kindly provided by the Australian Energy Regulator (AER) of average wholesale electricity prices in the National Electricity Market or NEM.
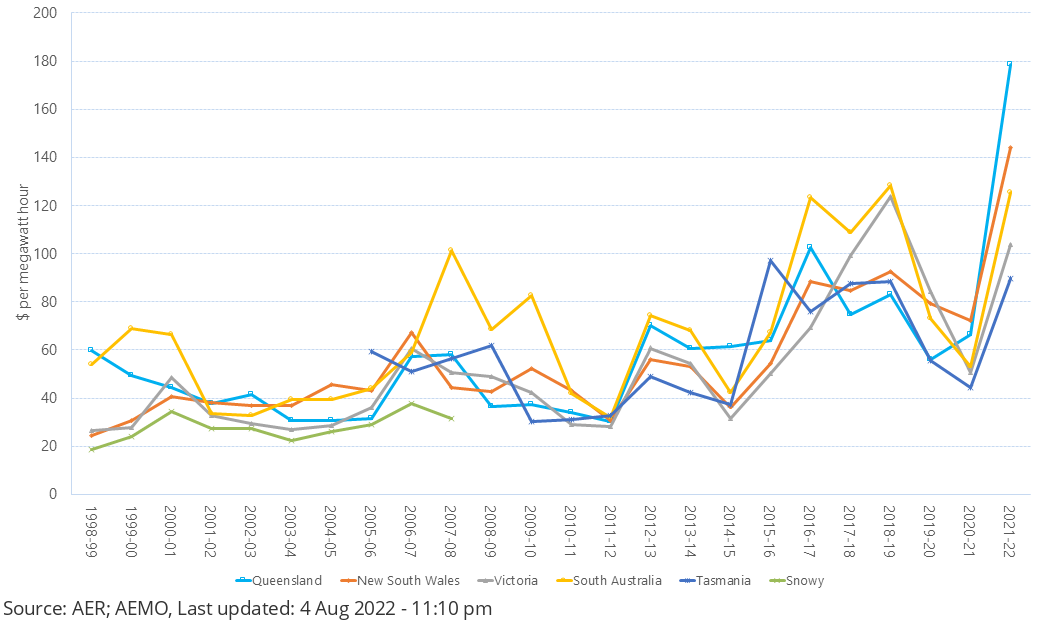
This is, technically, a graph of “Annual volume weighted annual 30-minute prices by region”. But we can call it “average wholesale electricity prices” just so long as no one tells the AER. Prices are given in dollars per megawatt-hour. For cents per kilowatt-hour, divide the dollar figure by 10.
As you can see, even ignoring the insane increases this year, South Australia’s wholesale electricity prices — the yellow line — have, overall, headed up as renewable energy capacity has increased.
But this does not take into account inflation.
The 5.4 cents per kilowatt-hour in the 1998-99 financial year is around 9.8 cents in today’s money, which is quite a difference. So I’ll make a graph of inflation-adjusted SA prices. Adjusting for inflation doesn’t mean prices haven’t gone up, but you will be able to see how much they have gone up in today’s money.
Adjusting For Inflation
I will use the AER’s figures for SA average wholesale prices but adjust them for inflation. I am going to round the wholesale prices to a tenth of a cent, which introduces a small inaccuracy. But I’m willing to put up with that if you are. After all, my therapist tells me I should be easier on myself.

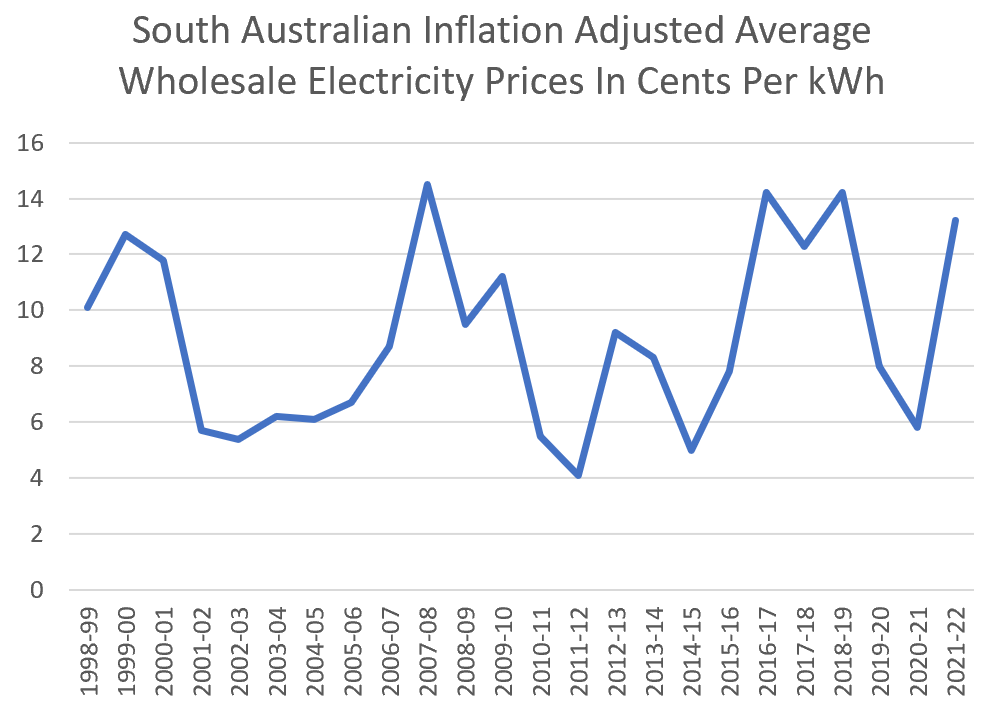
After adjusting for inflation, SA’s average wholesale electricity price over the past 24 financial years looks like this:
If I combine this with the earlier graph showing renewable energy generation at 0% in the 2007-08 financial year and going all the way to 69% renewables last financial year, it looks like this:
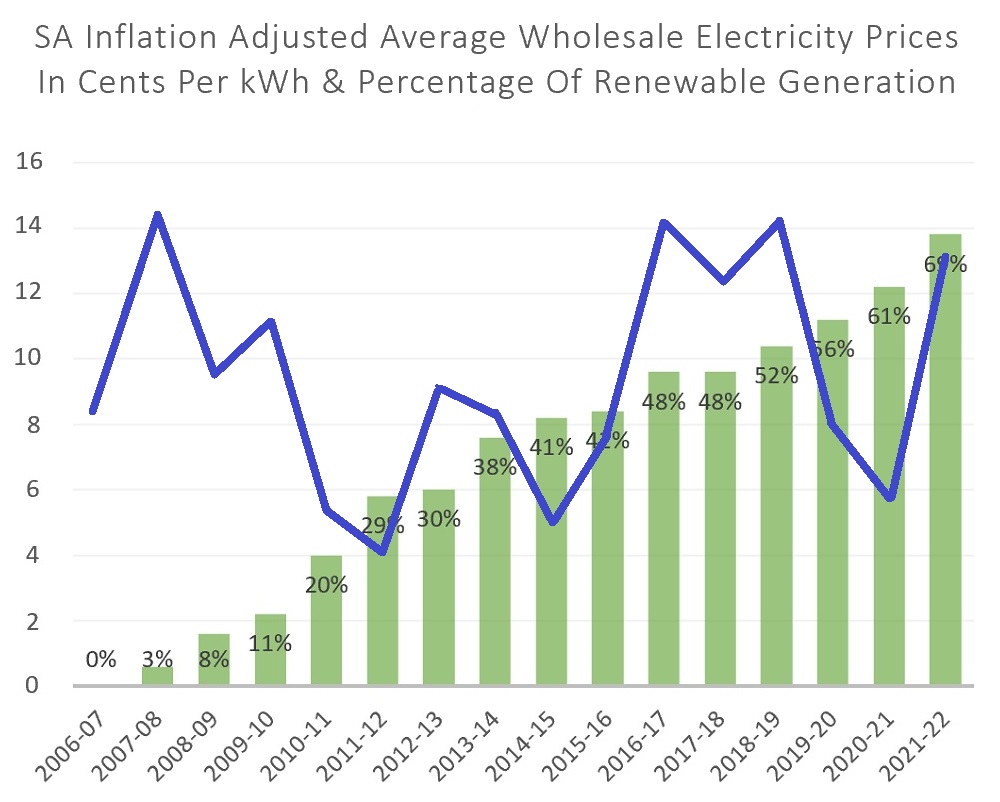
The average inflation-adjusted wholesale price for the first eight years is 7.8 cents. The average price of wholesale electricity over the next eight years was 10.1 cents. This makes it look like wholesale electricity prices have gone up as renewable energy production in South Australia has grown.
The reason it looks this way is because they have.
But this does not mean expanding renewable generation raised electricity costs.
Gas Prices Are Way Up
Here’s a graph of natural gas prices from the AER. This time South Australia3 is represented by the green line for Adelaide. As you can see, natural gas prices haven’t just risen; recently they’ve been “Bang! Zoom! Straight to the moon!“:
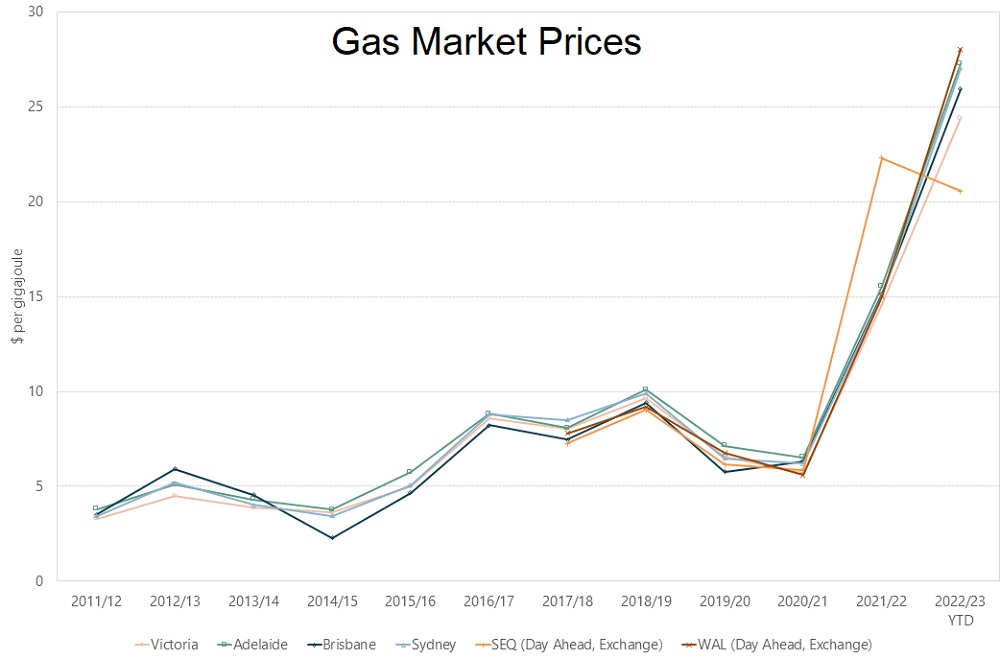
(Graph: AER)
If I adjust the AER figures for inflation and put them on the same graph as wholesale electricity prices, I get this:
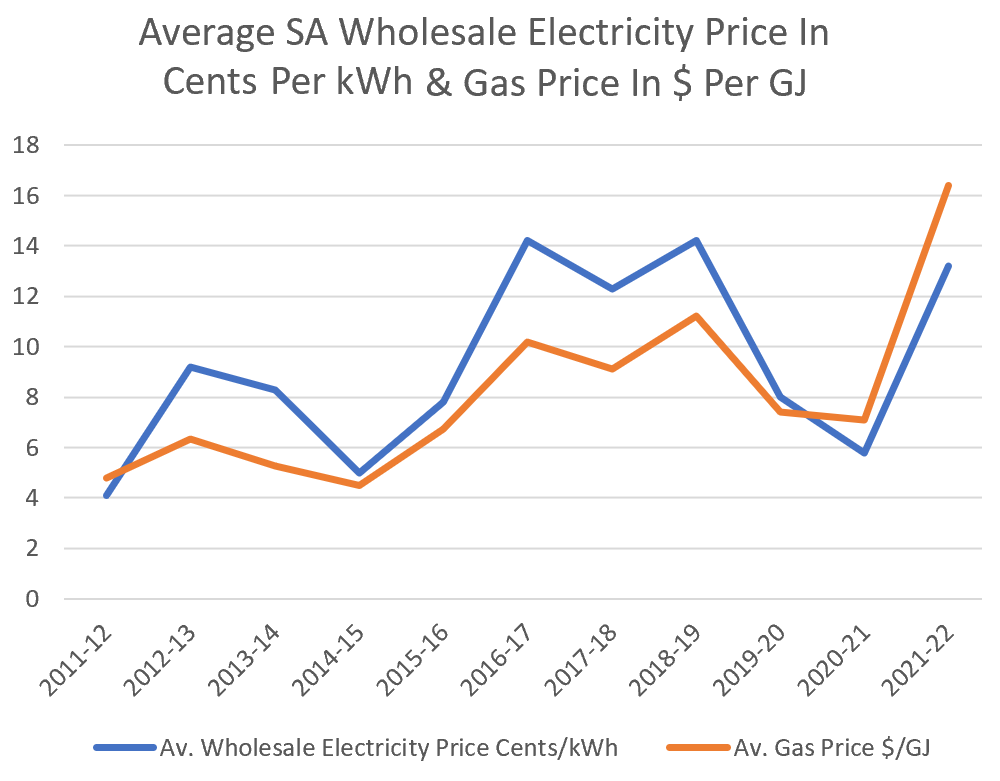
As the graph shows, the price of wholesale electricity and gas are highly correlated.
For the 12 years shown on the graph, state electricity generation from gas has ranged from 52.6% in 2017-18 to 29% in 2021-22. Because gas turbines are easy to start and stop, gas plays an outsized role in setting electricity prices. This means rises and falls in the cost of gas have a far stronger effect on wholesale electricity prices than the percentage of electricity gas generates.
Getting Off Gas
South Australia is rapidly reducing the amount of natural gas it uses to generate electricity, and the same is true for Australia. It’s simply too expensive compared to renewables plus energy storage.
The ability of gas to set prices will decrease as renewable energy capacity continues to expand, long-distance transmission capacity increases, and large amounts of battery storage become available. Victoria and Queensland have also committed to building large-scale pumped hydroelectric energy storage facilities, which will help when they — eventually — come online.
I also expect a natural gas glut in the future that will dramatically lower its price. The world is too uncertain a place to predict when this will happen, but my guess is it will happen sooner than most think.
Once gas is no longer a major influence, we will be in for a period of — hopefully — permanent low wholesale electricity prices and considerably lower electricity bills. Solar feed-in tariffs will also decrease, but you can’t have everything.
In the meantime, as long as wholesale electricity prices are high, it gives plenty of incentive to build more renewable capacity as well as energy storage. This means — in a roundabout way — high wholesale costs aren’t entirely bad. But I would have preferred to provide the incentive without transferring billions from consumers to fossil fuel generators.
Footnotes
- You could argue the responsibility is mostly on fossil fuel companies since that’s who politicians handed over most of their decision-making on the matter to, but I would argue it represents a lack of responsibility on behalf of our elected representatives. ↩
- Specifically, I’m focusing on wholesale market prices. Wholesale electricity is also sold through contracts, but because their details are generally secret, I have to stick with using market costs. ↩
- While not all of South Australia’s gas generation takes place around Adelaide, it’s still appropriate to use the Adelaide price. ↩
 RSS - Posts


I don’t see how gas can ever cease to become a major influence in firming generation until the grid has been radically overhauled with full state interconnection and that is going to take decades.
You lot in SA might get away with a majority of renewable generation for a short period on some days with your tiny population but when I look at my NEM ap today I am frightened at the huge amount of soon to be retired coal is still contributing at 64.8% (3pm).
There is almost no wind today 2.4%, solar is booming at 24.7%, hydro at only 5.3% and gas just ticking over at 2.4% because it is too dear to take some of the load off polluting cheap (VIC) coal and is in short supply due to stupid Govt. indecision in the past and refusal to allow more to come online.
With the private billers and generators enriching their shareholders I am hoping we don’t get a serious coal breakdown anytime soon causing a need for more expensive gas in the pie chart or power cuts.
The only savior for us in VIC is Dan’s promise to bring back the SEC if returned, but the buyout price will be huge so we will keep paying one way or another.
Eddy, We have ‘got away’ with 70% of renewable generation over the past 12 months. This stuff works, it’s been thought through, and we will get to 100% soon enough.
What would happen though if their was no imported supply (coal and gas) in the short to medium term. A trial of turning off the inter connector might warranted.
The increases are from 2006. Gas prices didn’t spike until 2021. The base correlation exactly matches the renewable installation rate.
Eddy,
“I don’t see how gas can ever cease to become a major influence in firming generation until the grid has been radically overhauled with full state interconnection and that is going to take decades.”
By adopting a much more ambitious attitude then a faster transition can occur, like what Professor Blakers is suggesting:
https://theconversation.com/theres-a-huge-surge-in-solar-production-under-way-and-australia-could-show-the-world-how-to-use-it-190241
Australia’s coal-fired generators are going broke as more renewables “eat their lunch”.
https://reneweconomy.com.au/solar-nears-60pct-of-grid-generation-for-first-time-taking-biggest-bite-yet-out-of-coals-lunch/
Bruce Robertson, an LNG energy finance analyst with the Institute for Energy Economics and Financial Analysis, said new gas projects were now at risk from “permanent demand destruction”.
https://www.theguardian.com/australia-news/2022/jul/07/australian-fossil-fuel-megaprojects-at-risk-from-record-high-global-gas-prices?
Eddy, it’s currently about peak generation time for solar and NSW is showing 52% coal, 42% solar, QLD 59% coal, 36% solar, VIC 75% coal, 10% solar, and TAS 93% hydro because well they got dams built before they became non-PC. I’m not bothering to mention wind because that’s 0%-10% depending on state.
Look at the 48 hour summary however and the story is totally different – NSW is 70% coal, 13% solar, QLD is 73% coal, 11% solar, VIC is 73% coal, 5% solar, and TAS is still 92% hydro. Again I won’t bother mentioning wind because that’s a mere 6%-9%.
Given peak demand and peak solar performance do not correlate, and that wind is intermittent, I agree that the future of grid power is grim. Based on predicted price hikes however switching to solar + battery, or even going so far as to disconnect from the grid seems increasingly viable and desirable – say 2 years ’til grid collapse.
Too bad, so sad, sucks to be you, for those who can’t enjoy a ‘private power grid’ due to insufficient finances, apartment living etc, as they’ll be the one footing the bill for major electricity costs.
Or state governments could opt to return to low cost public ownership of power, but I don’t see that happening because the Left want a renewable energy system, most parties support privatisation, and the few that might support public ownership are written off as fringe etc.
For many years I couldn’t help the feeling that when renewables reach a saturation level we could eventually be screwed over the same way we’ve been with the fossil purveyors. Isn’t that how life works and the shareholders come looking for their pound of flesh?
I have solar and it works pretty well, but it could have been with better advice and I can’t thinking that there are too many installations on inappropriate rooftops.
Hi Ronald
You’d think that if NG only contributes 30% of SA’s grid energy, then it should only count for 30% of it’s cost increases. Despite your ‘wholesale price’ arguments.
Glad to see you acknowledge that at the present time NG is far more valuable than PV & wind at times (e.g. at night) – so quite rightly commands a higher price then. Saves you from rolling blackouts, State-blacks, etc. Or importing filthy brown-coal-generated electricity from across the border.
I’ll believe VRE can give us lower prices when I see it (when we are no longer reliant on fossil fuels, day and night). i.e., when all extra transmission infrastructure costs, overbuild costs, and storage infrastructure costs are brought to account.
Oh – I may be ‘pushing up daisies’ by the time that happens.
Don’t make me produce graphs showing the effect of gas price increases on wholesale electricity prices in states where they get about 4% of their generation from gas. I don’t want to have to show them to you because… I’m really sick of making graphs. In fact, that’s it. No more graphs for the rest of the week! Maybe next week I’ll do something.
Ian Thompson,
“You’d think that if NG only contributes 30% of SA’s grid energy, then it should only count for 30% of it’s cost increases.”
Your statement indicates to me you don’t understand about buying & selling electricity in the national electricity market. See the AEMC’s Fact Sheet: How the spot market works, dated 11 April 2017.
https://www.aemc.gov.au/sites/default/files/content/d6cc8e9d-6a9f-4648-bef7-b25cad5df460/5-Fact-sheet-How-the-spot-market-works.pdf
The market has transitioned from six 5-minute bidding intervals with an averaged 30-minute settlement period, to a series of single 5-minute bidding intervals aligned with 5-minute settlement periods, on 1 Jul 2021.
https://www.aemc.gov.au/sites/default/files/content/18f019ff-de8c-40f3-836f-1bf3c8e43d2b/3-Info-Sheet.pdf
The last successful generator that bids with the highest price sets the price for all the other successful lower-priced bid generators (for each 5-minute bid period).
From the RBA, Aug 2022:
https://www.rba.gov.au/publications/smp/2022/aug/box-a-recent-developments-in-energy-prices.html
I have seen a digital wall panel in a local doctors surgery which displays the electricity being produced by solar panels and the household usage. I know you can get apps but I think a visual display in the living area would be a reminder for everyone in my house as to what is going on with our electricity. I would like to get one but cannot find one anywhere. Has anyone else seen these and know where I could purchase one? Thanks.
I don’t know of special-purpose display system/s like the one you mention. However, when I installed my solar PV system I also purchased the Solar Analytics monitoring system in order to monitor usage and generation. You can either pay a monthly/quarterly subscription fee or purchase a lifetime subscription. The Solar Analytics app has other useful functionality, including one which allows to enter your current electricity retail plan charges and FIT etc and thus monitor your electricity costs; an additional benefit is it is also able to compare the cost of your current retail plan to available retail plans based on your usage.
I would imagine there would be other products like Solar Analytics in the marketplace.
However, after having a Tesla Powerwall 2 installed about a year after the solar PV system, I have found the Tesla app to be more useful in monitoring generation and usage than the Solar Analytics app, but this may be just a personal preference rather than any qualitative differences between the apps.
I imagine you could easily have a permanent display of the generation and usage on a (cheap?) tablet mounted on your wall of the Solar Analytics (or Tesla app other app) display of generation and usage information.
Good luck in your search.
If you have a Fronius inverter, then Fronius is selling a Smart Meter, quite expensive at $750, which gives you production and consumption.
Andrea: Fronius sells a Smart Meter for about $750, which measures production and consumption and is a bit too expensive.
A Fronius inverter alone will give you production on your mobile and you know what is running in your home, like dishwasher or washing machine (2,000W each), H/W at 2,400W and aircon and you can work it out in your head.
Showing late spring rather than the year on the OpenNEM plot of SA power is a bit of cherry picking.
Also does it not show curtailment? This is a hidden cost of Solar and Wind, for example 40GWh were wasted on 14 Nov 2021. Storage is the answer but the 252MWh of batteries will do little to ease the situation.
https://reneweconomy.com.au/south-australia-curtailed-nearly-as-much-wind-and-solar-on-sunday-as-it-used/
The openNEM site only gives that kind of detailed information on the past 7 days, so that was the only time that was available, I’m afraid. The amount of power available for export was within the state’s interconnector transmission capacity so, hopefully, production wasn’t curtailed anywhere. But while curtailment does seem a waste, it is a cheaper option than trying to store or transmit all renewable production. Maybe one day South Australia will start using excess renewable energy to produce hydrogen for fertilizer and possibly things that don’t make sense.
Ronald,
Thank you for replying.
Storage is expensive (about AU$1,000/kWh* in Q1 2021) but required, it is a balance between curtailment in Spring/Early Summer and blackouts in Winter and mid Summer.
Hydrogen may be a good idea. I am not sure about electrolysis, but not many industrial processes work well with a intermittent power being supplied to a billion dollar factory. Aluminum process is take for a few hours break, and possibly desalination plants.
Dave
Ref:
*https://www.nrel.gov/docs/fy22osti/80694.pdf
see Figure 19: 4hr storage about AU$740/kWh but 1092/kWh for 2hours.
So the one day curtailment of $40GWh on 14 Nov 2021 would cost ~$40b to store.
Dave Duncalf,
“Storage is the answer but the 252MWh of batteries will do little to ease the situation.”
Dave, give it time.
BESSs currently operational in SA include:
* Hornsdale: 150 MW / up to 194 MWh, operational 2017
* Dalrymple North: 30 MW / up to 8 MWh, operational 2018
* Lake Bonney: 25 MW / up to 52 MWh, operational 2019
What I can see are BESSs approved and in development in SA include:
* Lincoln Gap: 10 MW / up to 10 MWh, approved, construction complete, commissioning delayed
* Torrens Island: 250 MW / up to 250 MWh, approved, construction commenced, operational in 2023?
* Tailem Bend: 41.5 MW / up to 41.5 MWh, approved, construction commenced, operational in 2023?
* Robertstown: 250 MW / up to 1,000 MWh, approved, design/procurement/pre-construction phase, operational in 2025?
* Goyder South: 900 MW / up to 1,800 MWh, approved, Stage 1 construction commenced, Stage 1 operational by 2024? Stages 2 & 3 subject to progress of EnergyConnect interconnector
https://reneweconomy.com.au/big-battery-storage-map-of-australia/
“Storage is expensive (about AU$1,000/kWh* in Q1 2021) but required…”
It varies with the storage duration. Per GenCost, a 1 hour duration battery cost is estimated to be 2021-22 $1,000+/kWh (worst case), whereas an 8 hour duration battery cost is estimated circa 2021-22 $400/kWh (average). Pumped hydro is cheaper per kWh with longer duration storage capacity. See CSIRO/AEMO’s GenCost 2021-2022: Final Report, dated Jul 2022, including Figure 2-2 Capital costs of storage technologies in $/kWh (total cost basis).
https://www.csiro.au/en/research/technology-space/energy/energy-data-modelling/gencost-2021-22
Geoff,
I can not explain the difference between NREL and CSIRO battery storage costs. $740 vs $400 for 4hr storage. I converted USD to AUD using 0.65.
Your numbers indicate a total battery storage by 2025 to be 2.140GWh by 2025. (Includes only phase 1 of Goyder). Still only 5% of the 14 November (40GWh) curtailment.
We need PSH but looking at Kingston (2GWh) it will take 8-10 years of development.
Dave,
“I can not explain the difference between NREL and CSIRO battery storage costs.”
I’d suggest the project planning environments are perhaps significantly different.
“We need PSH but looking at Kingston (2GWh) it will take 8-10 years of development.”
ICYMI, there’s one PHES project in SA also in development:
* Baroota: 200-270 MW / up to 8-hours storage, approved Feb 2019, operational by 2025?
https://riserenewables.com.au/projects/baroota-hydro-mid-north-port-pirie-energy-electricity-project/
Other announced SA PHES projects seemed to have stalled, including Goat Hill, Cultana, & Middleback.
Not all PHES projects will likely take “8-10 years of development.” For example:
* Central West: 325 MW / 2,600 MWh, NSW DPIE SEARs issued 10 Jun 2022, currently proponent ATCO at prepare EIS, best case approval perhaps mid- to late-2023?, expected 3 year construction period?, best case operational perhaps by 2026/7?
https://pp.planningportal.nsw.gov.au/major-projects/projects/central-west-pumped-hydro
* Lake Lyell: 335 MW / 2,680 MWh, geotechnical investigations in progress, so far proponent EnergyAustralia has not made a development application to NSW DPIE, best case operational perhaps by 2027/8?
https://www.energyaustralia.com.au/about-us/what-we-do/new-energy-projects/lake-lyell-pumped-hydro
Hi Ronald
Interesting, but people need to understand that if the current quest for renewable energy continues costs will inevitably rise to greater levels. Wind a solar farms need to be renewed after 20 years pushing up costs again. To get reliable energy from renewables, which I doubt is achievable costs will sky rocket again. Australian need to consider nuclear energy which is the most cost effective and reliable source of energy according to many credible reports worldwide. Clary
SA may not be an industrialized state since Holden closed and may not be smelting steel or aluminium, where the energy cannot be supplied cheaply enough by batteries 24/7/365. Germany is an example of an industrialized country with lots of renewables and nuclear, but still does not have a base load without Russian gas.
Gas is better than coal, but still produces CO2. It is not welcome here to say it, but it a price is worked out how much it costs to remove one tonne of CO2, then nuclear is cheapest. Renewables still need base load in the background, unfortunately.
Dominic Wild,
“Gas is better than coal, but still produces CO2.”
https://reneweconomy.com.au/gaslighting-on-emissions-ieefa-says-burning-lng-worse-than-coal-for-climate-19615/
Satellites are now discovering that methane emissions are much higher than was previously understood.
https://www.smithsonianmag.com/science-nature/a-new-generation-of-satellites-is-helping-authorities-track-methane-emissions-180979181/
“It is not welcome here to say it, but it a price is worked out how much it costs to remove one tonne of CO2, then nuclear is cheapest.”
Evidence/data, Dominic?
Dominic, it seems to me you are disagreeing with the findings in:
* GenCost 2021-22: Final Report, dated July 2022 – see Figure 0-1;
https://www.csiro.au/en/research/technology-space/energy/energy-data-modelling/gencost-2021-22
* Lazard’s Levelized Cost of Energy, Version 15.0, dated 28 Oct 2022 – see unsubsidized analysis
https://www.lazard.com/perspective/levelized-cost-of-energy-levelized-cost-of-storage-and-levelized-cost-of-hydrogen/
“Renewables still need base load in the background, unfortunately.”
Have you done the detailed energy supply-demand analysis yet, Dominic? No?
https://www.solarquotes.com.au/blog/co2-solar-land-clearing/#comment-1504153
What evidence/data/competency-basis do you have to support your statements, Dominic?
Meanwhile, half of France’s 56 reactors are out of action due to scheduled or emergency maintenance measures.
https://reneweconomy.com.au/france-electricity-prices-surge-past-e1000-mwh-as-more-nuclear-reactors-shut-down/
Geoff, you are not proposing gas as an interim solution to get away from coal due to Methane leakage, despite Greta Thunberg supporting gas and nuclear for that reason.
The only article I ever read about nuclear vs. renewables was unfortunately by the nuclear industry itself and I cannot remember if it considered a cost/tonne of CO2 removed.
France produces 80% of its energy via nuclear and like Sweden and many others should be seen as a CO2-removing success. With the Greens in Germany demanding the shut down of reactors, Germany will have to import energy from France, what an irony!
I am afraid I cannot quote scientific papers, but I have seen the cornucopia of wind mills in Germany and PV on church roofs and seen the reactors in the Rhine valley and having lived there know that in Winter it is possible too have very little sun and wind for up to five days. I can image that it is impossible to smelt steel and alu via batteries for five days and Germany is supposed to have a few minutes of battery power for the whole country. Germany has very little base load without Russian gas and one does not need to study scientific reports to know that.
Dominic Wild,
“Geoff, you are not proposing gas as an interim solution to get away from coal due to Methane leakage, despite Greta Thunberg supporting gas and nuclear for that reason.”
Gas is a transition fuel to +4 °C of warming, and consequently civilisation collapse. It’s not a transition to +1.5 to +2 °C of warming.
Greta Thunberg re existing nuclear power plants said: “If we have them already running, I feel that it’s a mistake to close them down in order to focus on coal.”
https://twitter.com/maischberger/status/1579830471491342336
Dominic, where has Greta Thunberg said she supported further development of gas? Or did you just imagine it?
“… I cannot remember if it considered a cost/tonne of CO2 removed.”
So you have no evidence/data that supports your earlier statement that “nuclear is cheapest.” then, Dominic?
“France produces 80% of its energy via nuclear…”
Incorrect. Per the World Nuclear Industry Status Report – 2022, within the France Focus section, on page 82:
“With the Greens in Germany demanding the shut down of reactors, Germany will have to import energy from France, what an irony!</i?"
Not with half of France’s 56 reactors currently out of action. Did you miss this inconvenient detail in my previous comment, Dominic?
France could be importing power from other countries this winter instead!
Geoff Miell,
I would like to see evidence of industrial or household leakage of methane causing an unacceptable temperature rise, as the thawing of permafrost causes huge sink holes to develop in Siberia and dropping of buildings in Canada and that seems to be the major cause of “natural” methane emissions. I certainly agree with you that coal and gas cause CO2 and any non-CO2 producing method should be supported.
Greta Thunberg seems to have given tacit approval to nuclear and gas as a lot of countries reverted back to coal due to the Russian gas embargo.
So I am wrong because I can only remember 80% as France’s percentage of nuclear generation and you tell us 69%, so I stand corrected, but we are getting into hair splitting here. Saudi Arabia, perhaps not an industrialized country and Italy do not have nuclear reactors, every other larger industrialized country has one for base load – not an argument to just copy! Austria converted a completed reactor into a museum piece due to an anti-nuclear referendum result.
Running an alu smelter like Tomago off batteries is not feasible economically because of the intermittent nature of wind and sun plus:
. cost of storage,
. cost of extra power lines to shift surplus or import,
. subsidies, and
. base load.
I am not arguing against your statement, that half of France’s reactors are out of action at the moment and why would I find it “inconvenient”? We know it only too well that our ageing 20 year-old coal plants behave in the same way. What is the life time of wind mills and solar panels, is it 20 or 25 years or do they last forever? Any other nation needing to repair some of the 445 reactors in operation world-wide?
Geoff,
“Gas is a transition fuel to +4 °C of warming”, Do you have a reference for this? My understanding is RCP 8.5 (w/m^2) is the high (extreme) scenario (increasing coal) give 4.3 °C of warming and not likely. RCP 4.5 was the likely scenerio although some* suggest RCP 3.4 ( 3.4 W/m^2 or 2.0–2.4 °C_ is more likely.
It helps no one using the EXTREME scenario, which many papers do.
Dave
Ref: https://osf.io/preprints/socarxiv/m4fdu/
Dave Duncalf,
““Gas is a transition fuel to +4 °C of warming”, Do you have a reference for this?”
See my reference to quotes from climate scientist Professor Kevin Anderson at: https://www.solarquotes.com.au/blog/electrify-road-transport-australia/#comment-1476885
“My understanding is RCP 8.5 (w/m^2) is the high (extreme) scenario (increasing coal) give 4.3 °C of warming and not likely. RCP 4.5 was the likely scenerio although some* suggest RCP 3.4 ( 3.4 W/m^2 or 2.0–2.4 °C_ is more likely.”
See the YouTube video titled SR Australia – Social and Earth System Tipping Points | Prof. Will Steffen + Dr. Nick Abel, published 3 Apr 2022, where climate scientist Prof Will Steffen shows a slide with a table of projected temperature rise derived from the IPCC AR6 SPM 2021, from time interval 0:19:12.
See also Table 1 in the Earth System Dynamics paper titled Climate model projections from the Scenario Model Intercomparison Project (ScenarioMIP) of CMIP6, which shows the calendar year best estimate (and 5-95% probability range in square brackets) at which warming levels (relative to 1850 1900 era) are reached per various trajectory scenarios (SSP1-1.9, SSP1-2.6, SSP2-4.5, SSP3-7.0 and SSP5-8.5). The table shows both the SSP3-7.0 & SSP5-8.5 scenarios will likely reach +4.0 °C warming threshold before 2100.
https://doi.org/10.5194/esd-12-253-2021
Meanwhile, James Hansen & colleagues stated in their August 2022 Temperature Update:
http://www.columbia.edu/~jeh1/mailings/2022/AugustTemperatureUpdate.22September2022.pdf
Roger Pielke Jr is not a climate scientist.
https://www.desmog.com/roger-pielke-jr/
Hi Dominic
I agree with you – I’d rather see us using NG, rather than coal – if this is (as I expect) necessary to ensure energy security. Better efficacy, too!
I feel Geoffrey Miell’s comments are out of touch – see more recent link below:
https://research.noaa.gov/article/ArtMID/587/ArticleID/2769/New-analysis-shows-microbial-sources-fueling-rise-of-atmospheric-methane
Perhaps global warming is increasing microbial sources – and our focus should really be there, as this is where the large increases in CH4 are coming from?
I am also concerned the rush to EV’s is unsustainable – do we have enough lithium?
https://www.weforum.org/agenda/2022/07/electric-vehicles-world-enough-lithium-resources/
If all our lithium goes to EV batteries, what will be left to provide all our desperately needed BESS’s? Or is Geoffery planning his entire ideology on the basis of yet another new (as yet unavailable) battery chemistry? On what timeframe, Geoffrey? Skip through 2030?
Geoffrey has presented a forward look at new BESS implementations in SA – due to come online by 2025? 2030?. I find these will barely support SA’s demand for power, should the wind ever drop at night time, and fail to support SA’s energy demands for more than 3 hours under similar circumstances – even at today’s demand levels. is SA going to go backwards in demand, when all gas ovens, space heaters, and HWS’s become electrified? Also add in EV charging demand? Or, does Geoffrey propose all EV’s become V2G – what a tremendous control problem – what a costly and inefficient distribution of inverter resources?
And this has supposedly all been thought through (Finn)?
Ian Thompson,
“Perhaps global warming is increasing microbial sources – and our focus should really be there, as this is where the large increases in CH4 are coming from?”
Thanks for the link. The NOAA article concludes with:
Looks to me like a positive feedback loop may have begun – another Earth System ‘tipping point’ passed.
Glaciologist Prof Jason Box tweeted on 30 Jul 2014:
https://twitter.com/climate_ice/status/494146188514693120?lang=en
“I am also concerned the rush to EV’s is unsustainable – do we have enough lithium?”
Does Australia have enough ongoing diesel fuel supplies, Ian?
https://crudeoilpeak.info/only-3-4-years-to-replace-save-45-of-australian-diesel-imports
Do we have enough ongoing petroleum fuel supplies? US petroleum geologist Art Berman suggests: “World oil production to decrease from 101 mmb/d in 2023 to 80 mmb/d in 2040”
https://twitter.com/aeberman12/status/1574818535888617473
Saudi Arabia’s crude oil production has peaked and may be beginning to decline. It seems Saudi Arabia’s oil production can’t be sustained near or above 11 Mb/d for very long. Set for 10-year chart: https://tradingeconomics.com/saudi-arabia/crude-oil-production
It seems Russia’s oil production can’t be sustained above 11 Mb/d for very long either. Set for 10-year chart: https://tradingeconomics.com/russia/crude-oil-production
Russia was a major diesel fuel producer before its invasion of Ukraine. Less diesel from Russia has exacerbated global diesel supply shortages.
Yes, Geoffrey Miell – I did read and accept the comment “Fossil fuels may not be the primary driver of the increase in atmospheric methane…”.
However, I also read “Our analysis indicates that methane emissions from fossil fuels are unlikely to be the dominant driver of the post-2006 increase,” said Lan. “The long-term change can’t be explained by a reduction in the rate at which the atmosphere degrades methane either”.
Also thought the microbial contribution may be being exacerbated by climate change – however I’d think it risky to state this categorically as a “tipping point”, as you do. This started in 2006, according to the author.
I wasn’t disputing the fact that we may be running out of diesel fuel – only pointing out we may not have enough lithium to support your restrictive and limiting agenda. By anyway, Geoffrey – you have presented a list of additional problems – but have failed to offer any solutions.
How about this: We work with the long-discovered notion of N2N (i.e., use NG, until we have enough nuclear to dispense with the NG option). Use VRE when we can. We CAN use NG as a diesel replacement for the interim – it was done many years ago on numerous Perth buses. Use our lithium for EV cars, and don’t misuse it on numerous expensive BESS installations. Replace coal, with the far more flexible NG. Stay with NG for space-heating, gas ovens, gas HWS, etc., instead of squandering waste heat (but, this doesn’t preclude the more expensive reverse cycle heating/cooling options, that not all can afford).
Geoffrey – if you only present problems, but no solutions, then we’ll all get despondent and do nothing useful. We’ll simply give up.
Ian Thompson,
“…I’d think it risky to state this categorically as a “tipping point”, as you do.”
Ian, did you miss the word MAY in my statement: “Looks to me like a positive feedback loop may have begun…“? If the carbon isotopic analysis can determine whether the increasing methane rate is due to fossil fuels, then we/humanity can do something about it. If it’s due primarily to biological processes then we could have a much bigger problem.
“…only pointing out we may not have enough lithium to support your restrictive and limiting agenda.”
Do you have evidence/data to support your question, or are you just expressing a ‘thought bubble’, Ian?
Per USGS, global lithium reserves, as at Jan 2022, was 22 million tons, and identified lithium resources have increased to 89 million tons.
https://pubs.usgs.gov/periodicals/mcs2022/mcs2022-lithium.pdf
The real question I see is: Can the rate of lithium production scale up to what is required to decarbonize ASAP to mitigate adequately for both the climate crisis & declining global petroleum fuel supplies?
“We CAN use NG as a diesel replacement for the interim”
That boat has sailed. Gas is NO LONGER CHEAP.
“Replace coal, with the far more flexible NG.”
Do you want more expensive electricity, Ian? Per AER, gas average prices in Q2 2022 were:
Brisbane: $28.81/GJ
Adelaide: $29.74/GJ
Victoria: $28.83/GJ
Sydney: $28.87/GJ
https://www.aer.gov.au/wholesale-markets/wholesale-statistics
Per gas analyst Bruce Robertson, for every $1/GJ increase in the price of gas, the price of electricity rises by $11/MWh.
“Stay with NG for space-heating, gas ovens, gas HWS, etc.”
Heat pumps for space heating & hot water, & induction-cooktops & electric ovens are far cheaper & cleaner to operate, compared with gas appliances.
https://thefifthestate.com.au/columns/spinifex/home-electrification-in-one-chart/
Have you done the detailed energy supply-demand analysis yet, Dominic? No?
https://www.solarquotes.com.au/blog/co2-solar-land-clearing/#comment-1504153
The supplied link has nothing to do with supply-demand analysis, it talks about land clearing for coal and solar.
I can imagine France’s nuclear reactors needing shutdowns, they are probably just as old as our coal plants. Especially after Chernobil and Fukujima, the Greens would have lobbied to stop the building of new reactors like in Germany with their premature shutdown.
World-wide, the 440 reactors produced 2,500 TeraWh in 2021 and removed 2,5 Gigatonnes of CO2 in comparison to coal production, where each kWh means one kilo of CO2 is produced. Gas is only a bit better and the methane the satellites are picking up is most likely from the thawing tundra and permafrost in Siberia and I hope not us leaking it.
Politician Colin Carpenter in WA was told by the multinational gas companies, that all gas was to be exported, but he demanded 15% for domestic use, so they walked out but came back. Looks like in the ES, your politicians did not possess the necessary spine to negotiate with the multinationals, which magically seem to pay very little tax anyway.
Dominic Wild,
“The supplied link has nothing to do with supply-demand analysis, it talks about land clearing for coal and solar.”
The link I provided directs to “Comment-1504153,” which is a comment (below Ronald’s post headlined I’ve Calculated CO2 Emissions From Solar Farm Land Clearing: It’s Bugger All.) by me addressed to you, dated October 27, 2022 at 6:47 pm, in response to your comment: “One cannot smelt steel and alum via batteries and our industry will find that out.” I referred to Blakers & team having done a supply-demand analysis (with links).
“World-wide, the 440 reactors produced 2,500 TeraWh in 2021…”
Reference, Dominic?
Per World Nuclear Industry Status Report 2022, in the Executive Summary:
Renewables (wind & solar) are cheaper, faster to deploy, & now provide more energy worldwide than nuclear.
Ron perhaps the strong trends emerging at COP27 with a global resurgence in emissions free nuclear power generation technology, might help us here in Australia to both lower electricity prices; and simultaneously reduce GHG emissions to insignificat levels:
Press Relaases COP27 10/11/2022:
“Nuclear power is making a comeback—and in a strong fashion.” So said IEA executive director Fatih Birol on the renewed interest in nuclear power across the globe.
Birol, executive director of the International Energy Agency (IEA), spoke during a discussion on nuclear power at COP27, focusing on its potential to help achieve net zero emissions.
The discussion was led by IAEA Director General Rafael Mariano Grossi at the #Atoms4Climate pavilion, the first-ever nuclear-themed pavilion in the history of the United Nations Climate Change Conference.
Has anybody got any good ideas on this subject?
Lawrence Coomber
I suspect the major energy consumers and corporations smelting aluminum or steel, which have been heavily subsidized in the past with their energy costs, will continue to lobby the government for low energy costs with the threat of shutting down due to international competition. I believe we have accused China in the WTO of dumping aluminum.
Those corporations will install a few mills and panels and mount a massive PR campaign to show their green credentials, but I suspect will still rely on subsidized CO2-producing energy in the main. Just saw an ad by Volvo claiming their cars are made with “green” steel and I wish them luck that they stay profitable.
Corporations certainly support universities with tax-deductible research grants into various “green” manufacturing methods. One idea was to convert surplus renewable energy into hydrogen and to feed it into the existing gas network. As usual, once the bean counters have done their cost/benefit analysis, it does not get implemented if it does not get subsidized by the taxpayer.
One must feel sorry for the non-corporate sector without the lobbying power, which was hit with massive energy cost increases due to gas. SBS interviewed the manager of a small foundry and the increases he mentioned were just unbelievable.
Using SA with its lack of industry (mine sites use diesel) and low population may not be the best example to list the advantages of renewables. It reminds me of Greenpeace installing a “green” village in India. Politicians were invited to the opening, but were met with demands for “useful energy” as refrigeration and electric cookers were prohibited. The batteries provided just enough electricity for lights at night.
Cooking with wood, or worse dung, can lead to respiratory ailments and as snake serum needs refrigeration, any snake bite means certain death. I hope I am right to say that about 300 Mio. Indians are still without “useful energy” and more coal-fired plants are being added to the 400 existing ones in India.
China is alleged to be running 1,100 plants and there are 1,900 coal-fired plants worldwide.
Dominic Ian Geoff.
We have squandered 42 years of prime time to act globally, and decisively to avoid all of the current drama and hysteria about where we must focus as global communities, to achieve the global standard “Energy Generation Technology Imperative” of Clean; GHG Neutral; Massive; Low Cost; Scalable; Low Footprint; Safe and Enduring Power; in Perpetuity – moving forward.
And this is precisely where we as global citizens have all ended up; because we dismissed, and continue to dismiss out of hand and ignore, the world’s best and brightest energy scientists/physicists warnings, about Global Energy Generation Technology Imperatives, critical to mitigating in its tracks; escalating GHG that are now holding to ransom, modern living standards as we know them being sustainable, by mitigating future negative climate circumstances taking hold.
Most would not be familiar with this 1979 Australian Senate Submission document [link below] from one of the world’s most eminent Nuclear Physicists [Australian]. I knew him quite well from 1978 when he was the Dean of the ANU Science Faculty Canberra, and we discussed all this stuff often [including GHG’s]. But we ignored it entirely at the highest Government levels.
My experience with Nuclear Generation came about during my Australian Naval Engineering days in the 60s exercising with the USN and in particular USS Enterprise, the USN first Nuclear Aircraft Carrier [6 Westinghouse Nuclear Reactors]. Navy Nuclear Reactors were efficient, safe and clean and soon were deployed in mainland power stations, and so began the United States Nuclear Power Generation industry.
Sir Ernest gave us the knowhow and the tools to survive and thrive – in return – we gave him the boot.
https://img1.wsimg.com/blobby/go/c1f75125-6391-46bd-9eb0-3837f7e64ebc/downloads/Ernest-Titterton-Nuclear-Power-Generation-Futu.pdf?ver=1668570555150
Lawrence Coomber
Not wishing to talk politics amongst friends, but IMHO Gough Whitlam wisely decided to not allow nuclear power generation for the simple reason, that it would start a nuclear SE Asian arms race. Did that argument then sink Sir Ernest Titterton?
But since then Indonesia built one and the Greens there tell me it is built close to a fault zone?
Now it has become a political football with the Libs suggesting at least to talk about it.
Dominic Wild.
“But since then Indonesia built one…”
Nope, it seems so far planned only. Per WNA, dated Aug 2022:
https://world-nuclear.org/information-library/country-profiles/countries-g-n/indonesia.aspx
I’d suggest current western sanctions on Russia are likely to stunt/disrupt Russia’s nuclear power technology exports.
“Now it has become a political football with the Libs suggesting at least to talk about it.”
Published on 9 Jun 2021, Professor of Economics at the University of Queensland, John Quiggin, in his op-ed headlined Nuclear power is a stalking horse for gas, concluded with:
https://independentaustralia.net/environment/environment-display/nuclear-power-is-a-stalking-horse-for-gas,15174
Geoffrey Miell
You forgot to mention the statement in your link: “Indonesia has a greater depth of experience and infrastructure in nuclear technology than any other country in southeast Asia”.
Nor the fact that they have 3 nuclear research reactors.
Or the following (from your link):
“In mid-2010, three sites were being considered for main plants:
Muria (central Java, actually 3 locations);
Banten (west Java); and
Bangka Island (off southern Sumatra to NE, 2 locations: West Bangka
and South Bangka).
All are on the north shores, away from the tectonic subduction zone.”
Fairly significant oversights I’d think, if someone wanted to present a balanced perspective.
I keep thinking Lawrence’s “[the Global Renewable Energy Generation Technologies Group]” are thinking in terms of Tonka Toys in a school sandpit – and have no concept at all of the “heavy lifting” required for Global Decarbonisation.
Part 1 of 2
No Dominic – Sir Ernest was only rejected by Australians.
His expertise along with others lives on, and is currently responsible for nearly half of all electricity generation globally.
But that is nowhere near enough moving forward to the next New Age Energy Intensive Technologies Era. My spreadsheet shows we need to generate at least 40 times the current global power generation per annum by 2075 to ensure all global citizens can exist at a modern standard of living in all things, within just and prosperous societies.
Remember this important point [only numbers people get it]. Everything that every person on earth sees around them – decays and needs to be replaced. About 100 years is the limit for most things. Think about it. Then ask yourself; where does the energy come from in all its forms, for renewal of everything we have ever produced this last 150 years for example?
Tip: Think about iron and poly water pipes everywhere; elastomer insulated copper electricity cable everywhere. On and on the list goes. The principle applies to all material things. All buildings on earth will have to be replaced sometime by about mid next century at the latest.
The sheer scale of future Global Energy Generation needs is impossible for we ordinary citizens to contemplate or visualise. Leave this subject to the worlds best and brightest demographers to evaluate is my suggestion.
So with that and other points in mind where does critical thinking need to lead us?
There is a distinct and widening chasm between those globally recognised leaders: and in particular those who are: [intensely engaged scientists; physicists, chemists; researchers ; academics and engineers in the global energy science sector]: and those who are not.
Lawrence Coomber
Lawrence Coomber,
“Sir Ernest was only rejected by Australians.
His expertise along with others lives on, and is currently responsible for nearly half of all electricity generation globally.”
In what way, Lawrence?
Per World Nuclear Industry Status Report 2022, published 5 Oct 2022, on page 16:
https://www.worldnuclearreport.org/World-Nuclear-Industry-Status-Report-2022-870.html
See also Our World In Data, Share of electricity production by source, World at: https://ourworldindata.org/grapher/share-elec-by-source
“All buildings on earth will have to be replaced sometime by about mid next century at the latest.”
Have you ever been to Europe, Lawrence? I’d suggest there are more than a few habitable buildings there that have been in continuous service for centuries already.
I think you are over estimating how much energy people require for a modern standard of living. If people require that much then I don’t have a modern standard of living. This includes energy for gradual replacement of my share of infrastructure.
Part 2 of 2
Of the two groups; the noisiest are the most vibrant and active: and consequently attract the lion’s share of media attention, and therefore get to establish and expand the broader mass public discourse and momentum around global energy science subjects. That’s understandable.
Both groups; and to be more precise [the Global Renewable Energy Generation Technologies Group] and the [Global Nuclear Reactor Generation Technology Group] of course are heading in different directions and for different reasons, but each group remains steadfast in lock step with its own group reasoning.
There is nothing surprising about this situation, but in the current times both groups are left increasingly exasperated because unlike many other subjects, this one [GHG and modern lifestyle development and maintenance for all global citizens] is under threat and time is at a premium moving forward. How then is the correct path forward determined, and by whom?
All impasses are resolvable. This one is no exception, and it will be decided by the well-known and immutable maxim that we all know: “Show me the money.”
Global Technology Corporations and new Consortiums are already forming up, and they alone and their financiers, will determine the group whose views we will all ultimately embrace as the key to reducing GHG’s emissions to insignificant levels, whilst simultaneously providing all global citizens, families, communities, states and nations with: Massive; Low Cost; Clean; Safe; Low Footprint; Modular; Scalable; Reticulated Power: sufficient to power a wide array of new age energy intensive businesses and industries critically important to providing for a modern standard of living for a rapidly expanding global population [> 10 Billion by 2050].
RE Tech will not be able to underpin Global Change moving forward.
https://world-nuclear.org/information-library/nuclear-fuel-cycle/nuclear-power-reactors/generation-iv-nuclear-reactors.aspx
Lawrence Coomber
Unfortunate news on the cost of new small-scale nuclear reactors:
https://ieefa.org/resources/small-modular-reactor-update-fading-promise-low-cost-power-uamps-smr
Ian: Don’t be spooked by “heavy lifting”- that’s what we are wired to do.
We have established a very solid development platform for the current crop to work from.
There has been no more determined and persevering ‘’heavy lifter” in the global history of Low Carbon Energy and Power Generation Science development and implementation than Hyman G Rickover: who is considered to almost single-handedly have created the United States Nuclear Navy, and springing from the success of the Navy low footprint and compartmentalised format; the implementation of shore based Public Nuclear Power Generation Utilities throughout North America and most other nations.
He met heavy resistance from all sectors: Government and Public. At a US senate hearing he explained his challenges ahead as: “Good ideas are not adopted automatically – they must be driven into practice with courageous impatience.”
There is uncanny similarity in his submission, to that of Sir Ernest Titterton, on the same subject, and also at a senate hearing. They knew each other from the 1940’s.
Rickover kicked every hurdle over and his legacy was assured. Interesting is that Australia is poised to become the beneficiary of Rickover’s single minded determination, by most likely acquiring some Virginia Class Nuclear Submarines from the US Navy. Rickover’s handprints are all over these Submarines.
There is a certain irony in this. Australia’s Sir Ernest was given short shrift, but his American mate was the architect of our next Nuclear Submarine acquisition. And on this point – I like your Tonka Toys analogy Ian.
Learn about Rickover. https://en.wikipedia.org/wiki/Hyman_G._Rickover
Rickover like Titterton were both conscious of Carbon Emissions, and both stressed that low-carbon economies (LCE) or decarbonised economies as economies based on energy sources that produce low levels of carbon dioxide emissions.
Lawrence Coomber
Lawrence Coomber,
“Interesting is that Australia is poised to become the beneficiary of Rickover’s single minded determination, by most likely acquiring some Virginia Class Nuclear Submarines from the US Navy.”
A look at the build schedule for the Virginia Class Nuclear Submarines suggests we/Australia might be waiting ‘awhile’ to get our hands on at least one.
The Block IV program, like the:
* Vermont SSN-792, was laid down in Feb 2017, launched on 29 March 2019, and commissioned on 18 Apr 2020 – major build to operational status circa 38 months;
* Oregon SSN-793, was laid down on 8 July 2017, launched 20 Jun 2020, and commissioned on 28 May 2022 – circa 58 months;
* Montana SSN-794, was laid down on 16 May 2018, launched 8 Feb 2021, and commissioned on 25 Jun 2022 – circa 49 months;
* Hyman G. Rickover SSN-795, was laid down on 11 May 2018, launched 26 Aug 2021, not yet commissioned – 54 months & counting;
* New Jersey SSN-796, was laid down on 25 Mar 2019, launched 14 Apr 2022, not yet commissioned.
The pattern seems to be one to two new subs per year being commissioned for the US Navy. There are 5 additional Block IV boats at various stages of construction, and 5 Block V boats are currently on order.
The Naval Submarine League believes that up to 10 Block V boats could be built, with the possibility of another 5 in the so-called Block VI and 5 in Block VII.
https://en.wikipedia.org/wiki/Virginia-class_submarine
I’d suggest the US build programme is fully occupied for the US Navy’s requirements until late into the 2030s at least.
Meanwhile, the UK’s Astute-class build programme is due to be completed circa 2026. Each of these boats seem to take around a decade to complete.
https://en.wikipedia.org/wiki/Astute-class_submarine
Geoff:
Again I remind you: GHG Emissions are a Global challenge. Not just an Australian challenge. Electrifying all nations of Africa through Intense Modernisation Development requires massive electricity resource availability. That’s a Global challenge not just an African challenge. Electrifying all other energy staved nations and states [over half the world’s population] through Intense Modernisation Development again, requires massive electricity resource availability. That’s a Global challenge also.
Global Corporations understand the challenge. Governments role is to follow Global Corporations demands of them and enact complimentary and meaningful policy initiatives. Those two things rolled together achieve two critical outcomes simultaneously: 1/ Provide massive clean low cost safe power to get the Modernisation Development work underway and 2/ Simultaneously reduce GHG to insignificant levels whilst the Modernisation continues.
The smart numbers guys understand all this. You don’t.
CONSTELLATION [MEDIA RELEASE 24/11/2022]
Constellation (Nasdaq: CEG) is the nation’s largest producer of clean, carbon-free energy and a leading supplier of energy products and services to millions of homes, institutionals, the public, and businesses, including three fourths of Fortune 100 companies.
Our fleet of nuclear, hydro, wind and solar facilities has the generating capacity to power the equivalent of 15 million homes, providing 10 percent of the nation’s carbon-free electricity.
Our fleet is helping to accelerate the nation’s transition to clean energy with more than 32,400 megawatts of capacity and annual output that is nearly 90 percent carbon-free. We have a goal to achieve 100 percent carbon-free power generation by 2040 by leveraging innovative technology and enhancing our diverse mix of hydro, wind and solar resources paired with the nation’s largest nuclear fleet.
Lawrence Coomber
Lawrence Coomber,
“Again I remind you: GHG Emissions are a Global challenge. Not just an Australian challenge.”
It’s clear to me you haven’t been paying attention to anything I’ve stated in this thread & numerous other multiple threads here at this blog. For example: https://www.solarquotes.com.au/blog/electrify-road-transport-australia/#comment-1459131
“Global Corporations understand the challenge.”
Do they, Lawrence? I doubt that – rhetoric, not deeds. IMO, many corporations are behaving as if they don’t.
https://reneweconomy.com.au/australian-business-leaders-still-baulking-at-1-5c-target-despite-their-net-zero-promises/
Many governments (including Australian federal & states) are still approving more fossil fuel developments – I’d suggest that’s civilisation suicide!
https://australiainstitute.org.au/post/new-paper-exposes-five-wealthy-countries-whose-fossil-fuel-production-threatens-chances-of-keeping-1-5oc-hope-alive/
“The smart numbers guys understand all this. You don’t.”
IMO, coming from a nuclear fantasist that apparently refuses to accept the accumulating & compelling numbers/data/evidence that’s inconvenient for your illusory ‘nuclear will save us all’ narrative.
A recent article suggested why Japan can build a nuclear power station in four years vs. America with a ten-year build time. America has expanded the bureaucratic paperwork to such an extent, that build times have blown out. And that info will explain the time blow-out mentioned in regards to nuclear subs.
When it comes to the cost of nuclear, it is clear both sides forget inconvenient items. Let me list a few for renewables:
1 Areas required for sun and wind generation and cost, remembering that generation should be close to consumers
2 If not close, costs of power lines, either additional capacity or new
3 Cost of subsidies for renewables
4 Cost of storage with batteries
5 Cost of replacement of panels and mill blades in landfill or recycling is not an argument, as shutting a reactor is also a cost
Dominic Wild,
“A recent article suggested why Japan can build a nuclear power station in four years vs. America with a ten-year build time.”
What article, Dominic?
Japan’s Strategic Energy Plan, published Oct 2021, emphasizes the importance of renewable energy sources, but utilization of nuclear power is
included as an option to achieve the goal. However, the basic policy of “reducing its dependence on nuclear power as much as possible” remains unchanged, and there is no explicit mentioning of building new nuclear power plants. See the World Nuclear Industry Status Report-2022”
Japan is concerned about the ongoing risks of tsunamis, and now military attacks on civilian nuclear power plants (following the Russian attacks on Chernobyl and Zaporizhzhia nuclear power plants).
“When it comes to the cost of nuclear, it is clear both sides forget inconvenient items.”
It seems to me that you refuse to accept the overwhelming evidence/data that nuclear power is very expensive at an estimated LCOE of AU$140-330/MWh for SMRs, compared with renewables with integration costs.
https://www.solarquotes.com.au/blog/gencost22-renewables-csiro-mb2548/
See also Lazard’s Levelized Cost of Energy Analysis, version 15.0 (2021)
https://www.lazard.com/perspective/levelized-cost-of-energy-levelized-cost-of-storage-and-levelized-cost-of-hydrogen/
Geoff:-
Lesson 1 in Global GHG Emissions Mitigation.
Let’s start with Africa:
Africa urgently needs massive electricity generation to grow and develop.
600 million people on the continent currently have no access to meaningful capacity power.
Electricity is an absolute necessity for Africa to improve its ability to achieve and advance the United Nations’ Sustainable Development Goals (SDGs) that demand eradicating poverty and hunger, provide for good health, modern education, clean water and sanitation, modern employment opportunities, and posterity pathways through economic growth – all of which require stable and affordable massive energy access.
The critical question asked by African leaders, government officials and representatives at COP27 in Sharm El-Sheikh, Egypt, was whether impoverished African nations can achieve these fundamental SDGs without using fossil fuels.
The global expert scientific community’s answer was a resounding NO.
As the developed world backtracks on energy strategies that supported their previous decades of industrialisation – while counting the environmental and societal cost of the economic impact – we could argue that Africa carries the benefit of hindsight. This retrospect leaves Africa as a blank energy canvas ripe for a case study of a Consolidated All African Nations – Nuclear Energy solution.
Starting with an All African States [Nuclear Powered] homogeneous high speed rail network – eliminating over 75 percent of current vehicular road use for [people and freight movements] across the entire continent.
Lawrence Coomber
Lawrence Coomber,
“This retrospect leaves Africa as a blank energy canvas ripe for a case study of a Consolidated All African Nations – Nuclear Energy solution.”
Lawrence, methinks you are living in fantasyland!
Firstly, if African nations cannot already afford fossil fuels to provide adequate energy for their needs now, then they certainly cannot afford more expensive (& much slower to deploy) nuclear energy technologies.
https://www.lazard.com/perspective/levelized-cost-of-energy-levelized-cost-of-storage-and-levelized-cost-of-hydrogen/
Secondly, per the PNAS perspectives paper titled Climate Endgame: Exploring catastrophic climate change scenarios, published 1 Aug 2022, a business-as-usual GHG emissions trajectory means vast swathes of the landmass of planet Earth (including Africa) will likely become unlivable within 50 years.
Fig 1 shows the overlap between future population distribution and extreme heat (MAT >29 °C):
https://www.pnas.org/cms/10.1073/pnas.2108146119/asset/6fb2b07d-d899-441e-8c1c-1795d738c124/assets/images/large/pnas.2108146119fig01.jpg
Nuclear is too slow to deploy to make any difference for humanity’s need to rapidly reduce greenhouse gas emissions. An inconvenient truth.
New nuclear costs around 20 Australian cents per kilowatt-hour to get built overseas. The estimated cost of electrical energy from nuscale SMRs is now around 12-13 US cents per kilowatt-hour and assumes things go well. As this is twice what generators typically receive on average in Australia these are not going to be built here. We are going to use renewable energy plus energy storage because it’s far cheaper.
What is true for Australia is super true for Africa. They can get access to more energy per dollar spent by staying away from nuclear. Africans will end up poorer if they try to get their electricity from nuclear reactors rather than solar panels, wind turbines, and hydro — with help from batteries.
Hi Ronald, Finn
With the greatest of respect, my initial thoughts were “something is wrong with this argument”.
To quote Steven Pinker’s book “Rationality”, “Correlation does not imply causation”. i.e., the fact that NG prices correlate well with Wholesale prices, does not define a cause (despite all the Pollies chanting the fault is with Putin, causing gas prices to peak…). In fact, I note Wholesale price is an outcome of Market forces (i.e., supply and demand) – and less about costs. Geoffrey, I may not understand NEM marketing, but I feel you are simply ignoring causation.
One DNSP mentioned about 20% of their price to the customer was from Wholesale prices, but about 60% was from intra-structure costs (maintenance, fixed costs, depreciation of capital assets, etc.) – a full 3 times that of the Wholesale component.
So – NG prices have gone from about $5 to $25 over recent history – an increase of about $20/GJ. But, 1 GJ is about 278 kWh – so in our lexicon the price increase has been about $20/278 = 7.2 cents / kWh.
However, we will need about 2.5 times as much NG, to make each kWh of electricity – therefore the cost to the NG Power Station becomes about 18 cents/kWh of energy exported. Less, if you account for inflation.
However, SA cannot claim this cost increase on every kWh of energy produced – as you loudly claim 70% is from renewables. So the nett increase is 30% of 18 cents, = 5.4 cents/kWh of electricity sold.
Not small, but hardly an argument to explain SA’s 50% (or more) price premium.
No – I’m inclined to the opinion SA’s high electricity costs are more to do with increased infrastructure costs (60% impact) – almost certainly due to the increased implementation of VRE. The fact that a 1.5GW NG Power Station capacity is required to run at only 0.08GW is a case in point – those stations STILL have to cover their fixed costs. Plus, same for heavily underutilised “poles and wire (and battery)” depreciation.
Hi Ian
Because natural gas generators often act as price setters in our wholesale electricity markets they have an effect on electricity prices that is way out of proportion to the amount of electrical energy it provides.
You can see this in NSW where wholesale electricity spot prices are clearly influenced by gas prices despite gas only supplying around 4% of generation.
Yes – indeed Ronald – exactly my point (although I was demonstrating SA’s position, which was the topic?).
The reason why gas generators demand (require?) high prices is not only the gas feedstock costs (after all, a CCGT doesn’t know if it is being fed cheap gas, or expensive gas) – but also because:
1. The NG generated gas is (much) more valuable – it can provide emergency supply continuity, when VRE is unable to, and
2. NG generators have a variety of fixed costs – which are higher if they are required to be sized to maintain a high capacity to cover VRE at certain times (e.g. at night, batteries all flat, low wind generation). Yet, wherever possible they are required to be only on standby or generating low power (e.g. SA’s 0.08GW). Of course, to recover these fixed costs it becomes necessary to charge a high unit cost ($/kWh). The exact same situation would occur, if you were to buy a luxury car but only drive it 5 km to church once a week every Sunday. The cost/km would be MASSIVE.
My feeling is that no matter how we “cut it”, changing our generation technology is going to cost us a lot of $. Partly because, if the VRE alternative was a so much cheaper alternative, why would we not have developed and had it 40-80 years ago? I mean, we’ve had batteries and windmills for yonks.
But I have no problem with higher prices if they are a “necessary evil” to deal with the climate change crisis. But – let’s be honest about it.
Clearly, Lazard’s show rooftop PV to be more expensive than nuclear – and that is BEFORE you add in the storage requirement (and, I don’t know that they’ve included the extra transmission line infrastructure). Yet, we can save ourselves some $ by installing rooftop PV – an inevitably expensive means to generate energy.
In my view, the “cheap, cheap, we throw in steak knives, the Sun doesn’t send bills” mantra is simply cheap political clap-trap. Maybe necessary to swing votes, but does not impress me.
Geoff Miell
My figures of 440 world-wide reactors with 2.5TWh of production come very close to your figures of 410 reactors with 2.6TWh, so we have once again entered the arena of hairsplitting.
The aluminum smelter Tomago requires 950MW or 10% of NSWs total. Google comes up with a cost of between $2 to $4 Mio for 2-3MW wind mills, so if we use a figure of $3 Mio for 3MW or one Mio Dollars/MW, the build cost to run Tomago off wind some of the time comes to $950Mio.
To run Tomago off the sun some of the time, Google comes up with a figure for large scale solar of $2.41/Watt, so the build cost comes to $2.3 billion.
Then comes storage at between $400 – $1,000/kWh and the cost of land. Build costs never get mentioned, but as there are zero-cost inputs from wind and sun, production costs get the limelight.
Dominic Wild,
Where do you get those turbine cost figures from, Dominic?
“Build costs never get mentioned, but as there are zero-cost inputs from wind and sun, production costs get the limelight.”
Why do you refuse to accept what the experts (CSIRO’s GenCost & Lazard’s LCOE analyses) indicate for renewables + storage, but would rather attempt to ‘do your own research’? Are the experts’ analyses providing inconvenient answers for your narrative, Dominic? ?♂️
Additionally, Lawrence Berkeley National Laboratory’s annual update on the status of the US wind technology suggests the national LCOE for wind energy was $32/MWh (circa AU$47/MWh) for plants built in 2021, excluding the impacts of federal tax incentives.
https://reneweconomy.com.au/wind-power-is-getting-better-and-better-and-providing-more-value-to-the-grid/
Why select relatively small 2-3 MW capacity wind turbines, Dominic?
Going bigger gets more ‘bang for your buck’.
https://www.ge.com/renewableenergy/stories/48-158-why-bigger-is-better
The 180MW Dulacca wind farm in Queensland’s south west is completing installation of the last of 43 Vestas V150-4.2MW turbines. This may soon be trumped in size by the 6.2MW Vestas turbines to be installed at the Golden Plains wind farm in Victoria, but not in height. They will be 230m.
https://reneweconomy.com.au/last-massive-turbine-goes-up-at-queensland-wind-farm-australias-tallest/
And the biggest onshore turbine available on the market in the world today is the Vestas V172-7.2MW, that promises to deliver a 12% annual energy production boost in low-wind conditions compared to 6.2MW design.
https://www.rechargenews.com/wind/big-blades-give-edge-to-vestas-as-dane-unveils-worlds-largest-onshore-wind-turbine/2-1-1195613
Geoff Miell
As I mentioned, those figures for mills and panels come from Google. I realize off-shore mills have become huge, so the next examples use five MW mills:
Back to Tomago: 950MW requirement to run all pot lines and let’s use a figure of five MW turbines. 950MW/5MW or 190 mills to run it SOME of the time.
PV:: We all know panels on the roof deliver more than 400W, let’s assume the panels of a large solar field deliver each more than twice as much or, to keep the figures simple, 1000W or one kW requiring 950,000 panels to run Tomago SOME of the time.
As there may be no wind or sun for some time, like up to four days in Germany in winter, it will require storage in addition and I have not asked Dr Google for the size of a battery field to hold up to a Gigawatt (950MW) of energy.
Is there cheap land next to Tomago?
Storage for Tomago: Assuming there is no sun or wind in winter for one day.
950MW x 24hrs or about 23,000MWh or 23GWh storage capacity.
A figure of $400 – $1,000/kWh has been banded around for storage. Let’s use much less to escape criticism: $100/kWh – wouldn’t it be great to pay only $1,000 for 10kWh of storage for the home battery?
23,000,000 kWh x $100 = $2.3 billion for one day of storage for 10% of NSWs total energy requirement for one alu smelter.
Adding together the cost of 190 5MW mills, 950,000 1kW panels, storage for one day and cost of land I leave to enthusiasts.
“The Australian”: ” … estimated that based on Victorian demand of about 50TWh/year, 4.5GWh of renewables leave space for 3-7GW of additional renewables, plus firming. Morgan Stanley is currently tracking 22GW of proposals with just 1GW in construction.” End of quote
I assume “firming” means storage and we are looking at many Gigawatts of storage.
Dominic, the NEM has never had a day without solar or wind generation. Australia also currently has about 7.8 gigawatts of hydro capacity. Since Tomago Aluminium draws around 850 MW that’s enough to support 9 Tomagos. But since it can cut back on electricity consumption without harm when necessary existing hydro capacity can actually support about 20 Tamaogos. If Tamago was modernized with insulated smelting pots, Australia’s hydroelectric capacity could support perhaps 30 Tamagos. So the amount of energy storage that needs to be added to the grid for Tamago aluminium to have a guaranteed electricity supply with a zero net emissions electricity sector is zero.
Australia only needs around 4-5 hours of electrical energy storage to go 99% renewable. We’re likely to end up with considerably more storage than that. One reason why is the electrification of road transport.
Ronald,
Thanks for your reply and I hope your enthusiasm is justified in regards to available storage plus the ability to rapidly transfer huge amounts of energy from sun/wind rich areas to meet demand elsewhere.
Or to economically produce hydrogen locally from surplus energy and feeding it into existing gas lines rather than sending it elsewhere.
” … supporting 9 Tomagos.” As Tomago uses 10% of NSWs total, the other 90% of NSW alone then uses up the entire 7.8GW hydro capacity? Only some of the pot lines at Tomago can be laid idle and then only for a restricted time.
One hopes our country can become the first to do without any CO2 producing base load as our Pacific neighbours, especially the Solomon Islands, prefer to forget 1,100 Chinese coal-fired stations and criticize us instead.
My vote counts a lot more here in Australia than it does in China. Of course, since people in China can only vote locally and not nationally, many there may think their vote doesn’t count for much either.
China’s greenhouse gas emissions aren’t good, but it’s a bit bloody cheeky for Australians to bring them up when our are more than twice as much per capita. We’re also one of the world’s largest exporters of fossil fuels. Although I should give Scott Morrison credit for overseeing a massive reduction in fossil fuel exports to China.
Ronald – the stars in your eyes must be blinding your perception…!
During the worst of the energy crisis dealt with in the cold season faced by the East coast – I did note one night, after all the batteries had gone flat – that wind nation-wide was only generating about 0.35GW (or was it 0.75GW – I do recall about half the generation was in WA). This at a time when total demand was between 20 and 22GW, and coal stations where running ‘flat-chat’.
Near enough to “no wind and no PV” in my lexicon, if you don’t wish to split hairs!
I remember, because I had pointed out I hadn’t known NSW had the capacity to generate nearly 8GW from coal – and had also stated that “fossil fuels had saved the NEM” at the time.
The reality – we, as a nation require uninterrupted electricity delivery – day and night, good seasons and bad. VRE must have the technical capability to provide this – at the moment, it is well short. You should also realise that Emergency Hospitals, Police Stations, Desalination Plants, Aluminium Smelters, and Steel Blast Furnaces need continuous energy delivery – I certainly wouldn’t want to be in a hospital relying only on their emergency backup diesel generators – without further backup. Telling Dominic that Hydro power capacity is sufficient to run aluminium smelters begs the question – if we have so much energy from hydro – why are we burning coal and NG at all? Could it be a fuel (i.e., water) limitation?
BTW – https://www.world-nuclear-news.org/Articles/China-s-demonstration-HTR-PM-reaches-full-power
I think the reason we don’t have enough solar, wind, and energy storage to meet all demand at times is because we haven’t built enough solar, wind, and energy storage to meet demand at all times. I imagine that, after we’ve built enough, we’ll have enough. I suspect this will bring an end to these embarrassing periods where there’s not enough.
Over the past year, generation in South Australia has been 70% renewable. The lights still work all time. Even in hospitals. Also, even one time in a Victorian aluminium smelter when there was a transmission fault leaving South Australia as their only source of power. So it does work and has continued to work from 2007 when SA generation was less than 0.7% renewable to today’s 70%. Renweables’s share will increase beyond 70% and as we encounter problems we will overcome them.
But if you want to build a merchant nuclear power station and sell power on the wholesale electricity market, don’t let me stop you. But no one is going to lend you money to do that, so I hope you are very rich.
My figures for Tomago, which, to keep things simple, at 950MW is about one GW, will have to be multiplied by nine, as Tomago alone represents only 10% of NSWs demand. So instead of 190 mills, nine times that figure is less than 1,800 mills, etc plus nine times the figures. for panels and storage and land for NSW alone.
Morgan Stanley mentioned 2 – 7 GW of renewables is required to meet Victoria’s demand. One GW is under construction, so we are looking at about four times the Tomago figures for mills, panels, storage and land for Victoria in addition.
These are eye-watering billions of dollars for NSW and VIC alone.