
What will your local climate be like in 2070?
Okay, this is cool: National Geographic’s latest contribution to climate change education is to try and give people a way to understand what their home cities will be like 50 years from now, if climate change follows the RCP 8.5 scenario.
Your Climate, Changed is a visualisation-and-forecast tool that brings together data from researchers all over the world: the University of Maryland’s Matthew Fitzpatrick, Hylke Beck of Princeton Climate Analytics, Tim McVicar of CSIRO Land and Water and the ARC Centre of Excellence for Climate Extremes, the Climate Impact Lab, and the company Verisk Maplecroft, publisher of the Climate Change Vulnerability Index.
It should be noted that “RCP 8.5” (RCP stands for Representative Concentration Pathways) is a pessimistic scenario assuming minimal efforts to change carbon emissions, compared to “business as usual”. (Carbon Brief has an explainer about RCP 8.5 here, calling it a high-baseline scenario “representing the 90th percentile of no-policy baseline scenarios available at the time”.)
CSIRO posted this blog by Kate Cranney, which gives a great overview of the Your Climate, Changed project.
National Geographic presents 2,500 cities around the world in Your Climate, Changed, and along with explaining how cities would “feel” after 50 years of business as usual, the project also offers users “city analogues” – which city in the world most closely matches the trajectory of “your” city in 2020? For example, to quote National Geographic,
“By the 2070s, Boston, Massachusetts, will feel more like Bardwell, Kentucky, does today. During summers, the maximum temperatures will be 5°C hotter on average and 49 mm more rain will fall”.
And some places, like Hanoi, Vietnam, will experience conditions entirely new on Earth – they have no 2070 analog to their 2020 climate. A total of 90 cities fall into this dire category.
If you live in Sydney, Your Climate, Changed suggests you get used to the climate in Monto, Queensland – a small town 120 km or so west of Bundaberg. Sydney winter days in 2070 are more likely to be 21°C on average, compared to today’s 18°C – but before you say “that doesn’t sound too bad”, the summer average will be 30°C rather than 26°C (you won’t like those really hot days with an extra 4°C, and business as usual will give Sydney at least two extra summer days of extreme heat).
CSIRO’s Kate Cranney added a couple of other example cities in her blog post:
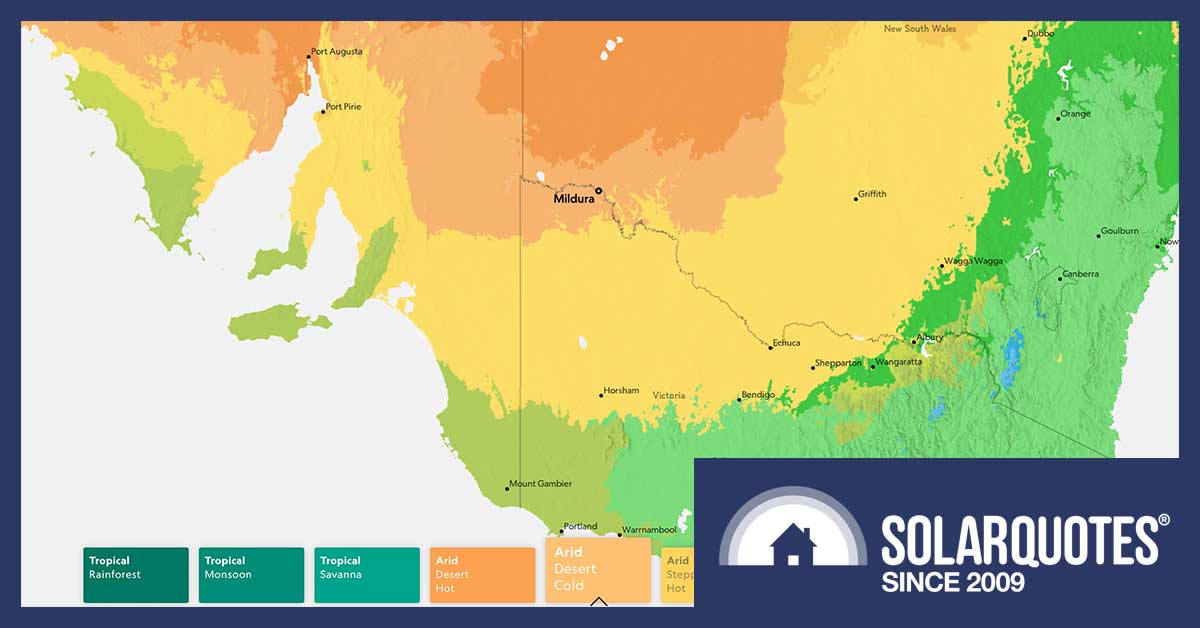
“In 50 years, Melbourne may feel similar to northern parts of Adelaide with much hotter summers. By 2070, Townsville in northern Queensland is forecast to shift from a temperate climate zone to a tropical savannah. The research predicts the number of days in the year over 35°C might increase dramatically in Townsville from five days in 2005 to 72 days in 2080.”
Meanwhile Perth, Cranney writes, will get a stunning 42 extra days of extreme heat.
CSIRO’s Tim McVicar On Why High Resolution Is Important
Solar Quotes spoke with CSIRO’s Tim McVicar, who worked with lead author Hylke Beck and others on the climate classification data used by National Geographic. The group’s work, published in October 2018, updated the the Köppen-Geiger climate classification maps to give them a 1km grid (if you’re interested, the maps are here).
McVicar and Beck started working with National Geographic in February this year, when the publisher asked them to help review how it had used the Köppen-Geiger model for Your Climate, Changed.
A 1km grid is important for hydrological, McVicar told us, because it does a better job of capturing mountainous areas.
“They’re important for generating stream flow,” McVicar said, and the 1km grid “has a lot more granularity in those important water-yeilding mountainous areas.”
He told us this covers an awful lot of variation: the models need to have the resolution to capture things like the effect of prevailing winds on precipitation (the rainshadow east of Cooma in NSW is a good example), and the way very high elevation differences affect rainfall.
“If you go from the Indo-Ganges plain in Indi to the rim of the Tibetan plateau – at lower elevations, rainfall increases as you ascend, and then you get to what people call ‘rain-out zones’”.
While Your Climate, Changed focuses on predicting the future, McVicar said fine-grained models that present a continuous grid are important to understanding the present, because it helps fill in the blanks between the otherwise isolated points where meteorological data is collected.
McVicar noted that his and Beck’s hydrological modelling did not, however, feed into the National Geographic temperature predictions – but those, interestingly, also illustrate why granular models are important.
He said the Your Climate, Changed data for Sydney, Australia has received some negative comments for asserting that Sydney currently averages two summer days over 35°C annually.
Surely that’s a mistake?
Not necessarily. McVicar pointed out that the GCM (general circulation model) grid used behind climatologists’ temperature modelling is based on a 1° grid – 100 x 100 km squares. A grid that size will have very diverse environments within Sydney – as well as the CBD and dormitory suburbs, the grid takes in forest and ocean areas.
“How representative that grid cell is, compared to the climate you experience as Joe Public, is a bit different”, he said.
 RSS - Posts


I’ve noticed that the Planet of the Humans has received no air time on this site. ?
Could it be like so many others hiding their true colours behind “saving the planet”
It’s not even off the main page yet:
https://www.solarquotes.com.au/blog/planet-of-humans-review/
‘Planet of the Humans’ was a badly researched and info sourced production. Most of the info presented was over 10 years old, and we all know how much technology has changed.
Richard Chirgwin,
Thanks for the information. You state:
“If you live in Sydney, Your Climate, Changed suggests you get used to the climate in Monto, Queensland – a small town 120 km or so west of Bundaberg.”
Some might think that’s perhaps not too bad, until you consider it’s likely that mosquitoes bearing diseases like Ross River Fever could be on the rise.
See: https://www.9news.com.au/videos/national/increased-mosquito-population-brings-ross-river-virus/ck9wj9ks7000j0gm4gfzs90ge
Then there’s the food supply situation.
A particular danger is that food crises could develop on several continents at once, said Cynthia Rosenzweig, a senior research scientist at the NASA Goddard Institute for Space Studies and one of the lead authors of the IPCC Special Report on Climate Change and Land (Nov 2019). “The potential risk of multi-breadbasket failure is increasing,” she said. “All of these things are happening at the same time.”
See: https://www.nytimes.com/2019/08/08/climate/climate-change-food-supply.html
IMO, the explainer (dated 18 Sep 2019) by Yale Climate Connections on the impacts of climate change on food production is also informative.
https://www.yaleclimateconnections.org/2019/09/a-brief-guide-to-the-impacts-of-climate-change-on-food-production/
RCP 8.5 is a ridiculous scenario, usually being used to scare the peasants. Among other projections, it says that the population of Nigeria will increase from 300 million today to 1.4 billion, ie bigger than China. now Nigeria is a big country, but it basically means a population density for the entire country approaching that of a village. In fact the average population density for the whole of Africa would be the same as china today. How?
2 points:
RCP 8.5 is the trajectory that the world in now on and unless all countries get busy on reducing emissions, it the trajectory that we will stay on.
re Nigeria. The population in 2018 was 196 million, with a (slowly decreasing) fertility rate of 5.46 children per woman and 3.2% per annum growth rate. I am not sure what future date we are talking about, but let me assume that it is 2100 AD.
If we raise 1.032 to the power of 80 we get 12.43 and that is the factor by which the population will grow by 2100, assuming no changes from the current rates.
Multiplying 12.42 by the current population of 196 million gives 2436 million, i.e a little over 2.4 billion and way higher than China’s 1.4 billion.. I recognise that future growth rates will not stay the same as now, but it is easy to see that Nigeria might overtake China (which by the way has a population growth rate that is slowly despite relaxation of the one-child policy.
Perhaps the claim that Nigeria will overtake China is not as ridiculous as it first seems..
I used to like that SolarQuotes didn’t go in for this sort of ideological rubbish.
Rhys, this is not “ideological rubbish”, it is world-class science. One of the biggest problems with the world right now is people claiming science is ideological whilst elevating their beliefs (usually riddled with confirmation bias) to the same staus as good science.
Finn, I think you have a fabulous site & perform a great service you folk are my solar “bible”. It’s thanks to you I’m hanging out for a BYD battery here in NZ, if I can get one in the next shipment. Now to matters in-hand … I must take issue with on your claim that it is “world-class science”. Check out this link and have a good look around his site: http://www.drroyspencer.com/about/ . Then read his section “My Global Warming Skepticism, for Dummies”. This fellow has credentials as good as any you’ll find in the climate change arena. The science is not settled, people often only read that which confirms their bias and are not interested in seeking the truth. If one is interested in seeking the truth then you’ll find it. People see the degradation, often appalling, of the earth, largely feel powerless to affect what is occurring and need something to hang their hat on. Anthropogenic global warming fits the bill quite nicely. But it aint necessarily the case.
Hi David
There was no snow in Southern Finland this year and their icebreakers are sitting idle. In World War II Germany had trouble supplying Finland because their ports were ice bound for around 5 months a year. If you try to tell me that warming isn’t occurring I’m going to find that hard to believe.
Ron, I’ll regret poking the bear again, but really the comparison to WW2 is nearly irrelevant. Weather does vary (you’ll agree) and the question is how much it’s varied in the last 50 years, 500 years, 5000 years. Without looking it up, I can just about guarantee that Finland wasn’t icebound 5 months a year for most of the 1970s, before significant CO2 production, and I’d hazard a guess that there has been a pretty cold winter in Finland some time in the last 10 years. There will be an open question as to whether there are natural cycles at work here (eg North Atlantic Multi-Decadal Oscillation) or there is a real underlying change. Reasonable people should be able to have different perspectives on this.
Increase in atmosphere CO2 in 1975 from 1880 was 16%. Global temperature in the 1970s was around 0.23 degrees warmer than in 1880s. Current CO2 levels are 48% higher than in 1880. Global temperature in the 2010s was around 1 degree warmer than 1880s.
Ron, both your points and mine can be true. Unless you want to argue that there has been a direct linear relationship year by year, which I don’t think you would, there is a reasonable question regarding what portion of the change is CO2 driven and which part is natural variation.
The low end of estimated climate sensitivity (technically Transient Climate Response) is one degree. If it’s one degree or more we have good reason to rapidly reduce CO2 emissions. If it is zero, which it isn’t, we’d have good reason to cut CO2 emissions by roughly 80% or more because we don’t know what effect rising ocean acidity will have.
Rhys Howitt,
There are huge amounts of methane stored around the world in the sea floor in the form of solid methane hydrates. These hydrates represent a large energy reserve for humanity. Climate warming, however, could cause the hydrates to destabilize. The methane, a potent greenhouse gas, would escape unused into the atmosphere and could even accelerate climate change.
In the field of methane emission research today, the Arctic is one of the most important regions worldwide. It is believed that methane occurs there both in the form of gas hydrate in the sea and as free gas trapped in the deep-frozen permafrost. Methane deposits in permafrost and hydrates are considered to be very sensitive in the expansive shallow-shelf regions, because with the relatively low pressures it would only take a small temperature change to release large amounts of methane.
See: https://worldoceanreview.com/en/wor-1/ocean-chemistry/climate-change-and-methane-hydrates/
Ice climatologist, Professor Jason Box, famously tweeted on 30 Jul 2014:
“If even a small fraction of Arctic sea floor carbon is released to the atmosphere, we’re f’d.”
See: https://twitter.com/climate_ice/status/494146188514693120
Is that “ideological rubbish”, eh Rhys? For you and your family’s futures, can you afford to be wrong, Rhys?
Geoff, in my lifetime there have been a very large number of doomsday predictions, and somehow there is greatly reduced poverty and longer lifespans. Jumping at every proposed hobgoblin would result in terrible public policy. The lauded “precautionary principle” is a poverty principle.
Rhys Howitt,
You state:
“…somehow there is greatly reduced poverty and longer lifespans.”
Great advancements in medical science, like with antibiotics since WW2 have enable longer lifespans. A simple break in the skin is not a potential death sentence. However, improper use is escalating antibiotic-resistance, so the risk is increasing of returning to the bad old days.
Getting pneumonia is less risky. Open-heart surgery is now commonplace. Organ transplants are possible. Vaccinations have dramatically reduced killers like small pox, polio, etc. Many cancers can be managed if detected early enough.
Sanitation has greatly improved, increasing life expectancy.
Science has enabled greater food productivity and nutrition, and a global transport and logistics system has enabled better and faster distribution.
Most places on this planet are within reach within 24 hours.
As I said in my comment in another thread:
“Unless humanity changes behaviour real soon, I would suggest that many people that were born from 1945 through to 1965 have probably experienced in the majority (or all) of their lifetimes, the best years on offer in human history, for a very, very long time.”
See: https://www.solarquotes.com.au/blog/planet-of-humans-review/#comment-691161
Undeniably, science has provided the knowledge for great human advancements in our lifetimes. It has also provided the tools to gain overwhelming evidence of the escalating dangers of dangerous climate change, that has the risk of bringing about the collapse of civilisation within this century with our current human-induced GHG trajectory. Some (and it seems to me you are apparently one of them) choose to to ignore/deny this inconvenient evidence.
It seems to me vested interests are presenting lies and propaganda to maintain the status quo, to humanity’s peril. This is explored in the ABC RN Presents 4-part series “Hot Mess”.
See Part 1: https://www.abc.net.au/radionational/programs/rn-presents/human-frailties/12181012
And Part 2: https://www.abc.net.au/radionational/programs/rn-presents/spin-cycle/12181028
And Part 3: https://www.abc.net.au/radionational/programs/rn-presents/party-lines/12181030
The “lauded ‘precautionary principle'” in this case could save many of us from extinction, but only if a critical mass of people pull their proverbial heads out of the sand. But don’t wait too long – the window of opportunity to act effectively closes soon and our fate is then set.
See: https://imgflip.com/i/1urrrp
A great piece that sheds much needed light on some of the great theoretical/ideological debates in the contemporary crypto space. At CleanApp Foundation, we appreciate the emphasis on pragmatism, and emphasis on Blockchain/DTL/Crypto projects that offer real social utility. Looking forward to engaging more with your crew!