
Unsure if EVs are the right fit for you? We’ve got you covered. This article presents an advanced Total Cost of Ownership (TCO) and emissions calculator to compare EVs and internal combustion engine (ICE) vehicles, available via a link at the end. And yes, we’re talking about emissions too! After all, that’s what kick-started the EV revolution. But for those focused on the bottom line, fear not – this calculator mostly focuses on dollars.
Our powerful Excel-based calculator shows you the true cost of electric vehicle (EV) ownership in Australia. Don’t be fooled by the higher upfront cost – evaluating TCO over the vehicle’s life cycle reveals the real financial impact on your wallet and the atmosphere.
So dive into the numbers and make an informed decision about when you should embrace the electric future.
How Does It Work?
Pretty simple.
Worked Example
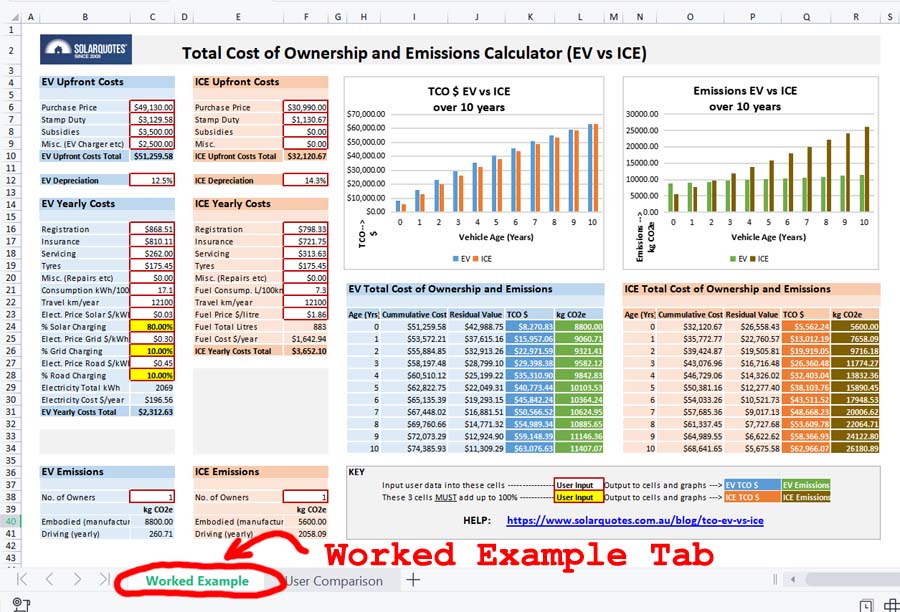
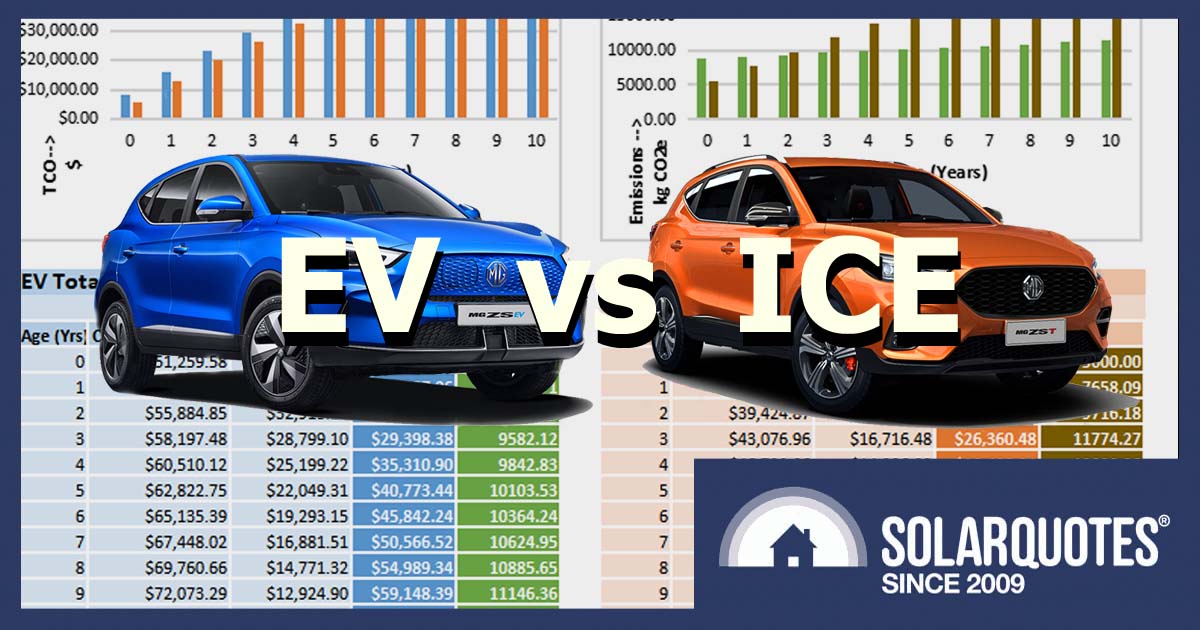
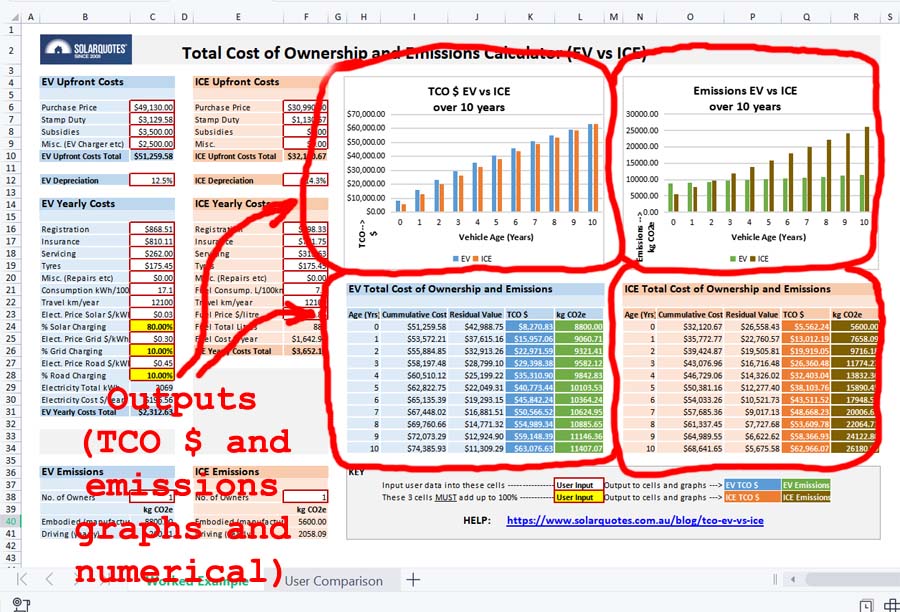
There’s a “Worked Example” on the first tab of the Excel spreadsheet which is locked and uneditable. The figures, based on two comparable vehicles, are already entered in, and then output to two graphs – one for TCO $, and the other for emissions.
The full methodology for the example is provided further in this article to not only show full transparency and methodology but also to help you enter your own data into the next tab – “User Comparison”.
User Comparison
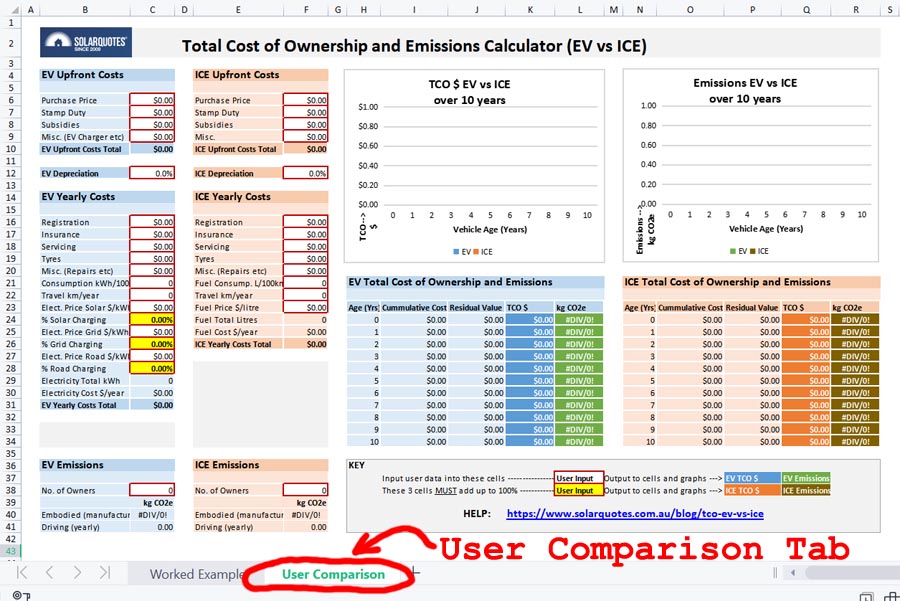
This is where the fun starts. Click on the “User Comparison” tab at the bottom of the spreadsheet. You can enter your own figures here and compare any vehicles you like – even used ones, but remember – garbage in, garbage out.
Simply enter your data into the following cells marked with a red border:
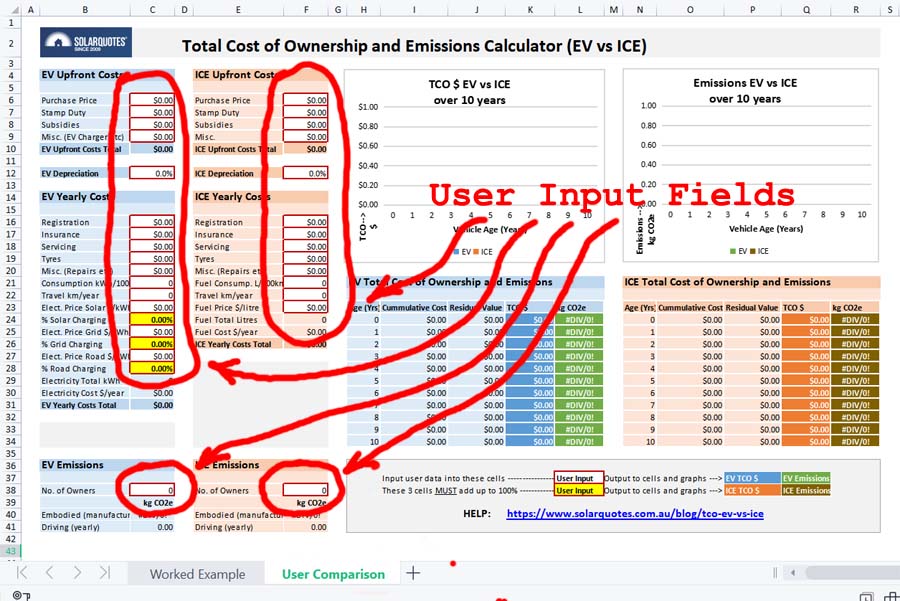
- Purchase Price
- Stamp Duty
- Subsidies
- Misc. (EV Charger etc)
- Depreciation
- Inflation
- Registration
- Insurance
- Servicing
- Tyres
- Misc. (Repairs etc)
- Consumption kWh/100km (EV)
- Travel km/year
- Elect. Price Solar $/kWh (EV)
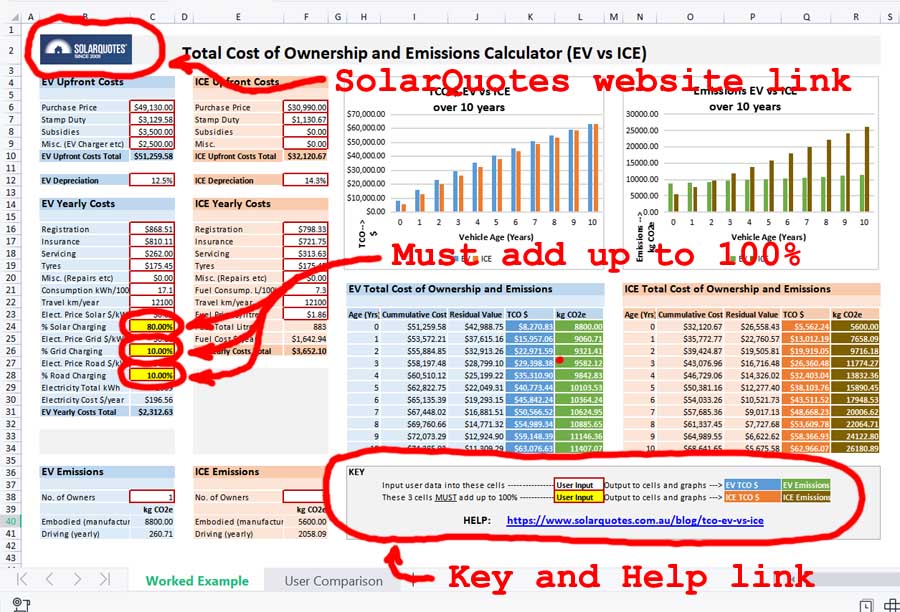
- % Solar Charging (EV) – this is 1 of 3 cells that must add up to 100%
- Elect. Price Grid $/kWh (EV)
- % Grid Charging (EV) – this is 1 of 3 cells that must add up to 100%
- Elect. Price Road $/kWh (EV)
- % Road Charging (EV) – this is 1 of 3 cells that must add up to 100%
- Fuel Consump. L/100km (ICE)
- Fuel Price $/litre (ICE)
- No. of Previous Owners
The calculator will crunch the numbers and automatically output TCO $ and emissions to the cells on the right-hand side, and also conveniently shown in the graphs in the top right corner.
Help
If it all goes pear-shaped there’s a key in the bottom right corner to show you where to input your data. There’s also a link back to this article which doubles as a help page, and also a link in the top left corner back to the SolarQuotes website.
Conclusion
To spare some of you the boredom of reading through the full methodology used to calculate the worked example, I’ve shuffled the conclusion further up the order. Read it below, then either carry on and read the methodology or scroll to the bottom to download the calculator.
1. A vehicle travelling higher than average km/ year will tip the scales more favourably towards an EV being more cost-effective and less emission-intensive than an ICE vehicle over the life-cycle of a vehicle. This is quite ironic, considering the best economic and environmental outcome would be achieved by walking or riding your bike and driving your car less!
2. In addition to the above, the longer a vehicle stays in service will shift the odds towards an EV being more economic and less emission-intensive than an ICE vehicle over the life-cycle of a vehicle.
3. Currently, charging an EV from excess solar only has a marginally better economic outcome than charging from the grid or road. This is because electricity accounts for less than 10% of an EVs yearly costs. Charging from excess solar, however, gives a far greater environmental benefit than charging from fossil fuel-intensive grids.
4. A higher inflation rate favours EVs over ICE vehicles for value because the higher upfront cost is paid earlier, and subsequent yearly costs are lower for an EV. In addition, fuel and energy prices are likely to rise more than inflation. The fuel component of an ICE vehicle comprises 45% of yearly costs. In contrast, the fuel (electricity) component of an EV comprises less than 10%. Therefore, the effect of fuel/ energy price rises over time GREATLY favours EVs economically over ICE vehicles.
5. When comparing a new EV with a used ICE vehicle – running your old petrol clunker into the ground might save you money for a while, but will produce the highest emissions and achieve the worst environmental outcome.
6. The Federal Government’s fringe benefits tax exemption1 for Battery and Hybrid EVs can substantially change the TCO as you can pay for the repayments, servicing, tyres and electricity for an EV with pre-tax money at no cost to an employer.
7. Two elephants in the room – Although embodied emissions from both the mineral supply chain and vehicle decommissioning have been taken into account, there’s no denying that we have a huge challenge dealing with (1) demand vs supply of raw materials, and (2) recycling of EV batteries.
8. All forms of energy production and consumption have environmental impacts. There is no perfect technology. Using this calculator may help in choosing the lesser of two evils.
Read on for the full methodology used in the worked example, or if you can’t wait, scroll down to the bottom of the article and download the calculator to do your own analysis.
Methodology for Worked Example
The following is the methodology used for the figures entered into the locked (uneditable) “Worked Example” tab using two comparable vehicles in Western Australia.
Upfront Costs
Purchase Price
The cheapest brand-new EV in Australia at the time of writing2 is the MG ZS EV, which is an electric version of an MG ZST. These are the current prices:
2023 MG ZS EV Excite – $49,130
2023 MG ZST Excite – $30,990
Stamp Duty
In Western Australia for all vehicles, $25,000 – $50,000 the stamp duty payable is:
R% of the dutiable value, where R = [2.75 + ((dutiable value – 25,000)/ 6,666.66)] rounded to 2 decimal places
MG ZS EV Excite calculation:
[2.75 + ((49,130 – 25,000)/6,666.66)] = 6.37% x $49,130 = $3,129.58
MG ZST Excite calculation:
[2.75 + ((30,990 – 25,000)/6,666.66)] = 3.65% x $30,990 = $1,130.67
Subsidies
Zero Emission Vehicle (ZEV) Rebate – $3,500
The WA government currently offers a $3,500 rebate for the first 10,000 purchasers of licensed electric and hydrogen vehicles in WA, or for 3 years following the announcement (until Saturday 10 May 2025), whichever comes first.
Misc. (EV Charger etc)
The current average price for a 7.4kW Tesla Gen 3 Wall Connector level 2 single-phase EV charger supplied and installed in WA is approximately $1,800.
Depreciation
Depreciation rates vary for different vehicles depending on factors such as current market demand, make, model, age, etc.
It’s commonly thought that EVs depreciate slower than their petrol counterparts, but it depends on which so-called authority you believe, or which website you read. The estimates vary widely. The vehicle manufacturers certainly seem to support this theory, based on the warranty given for each vehicle. I’ve therefore assumed they depreciate using the length of the manufacturer’s warranty by the following method:
The ATO general depreciation rules – capital allowances, allow the prime cost method or diminishing value method to calculate vehicle depreciation for tax purposes. The prime cost method is the simpler one and uses the following formula:
Asset’s cost × (days held ÷ 365) × (100% ÷ asset’s effective life)
EV Depreciation
Assuming the asset’s (EV’s) life is the length of the battery warranty – 8 years/160,000 km, whichever comes first, that works out to a depreciation rate of 12.5% per annum over 8 years.
ICE Depreciation
Assuming the asset’s (ICE’s) life is the length of the vehicle warranty – 7 years/70,000 km, whichever comes first, that works out to a depreciation rate of 14.3% per annum over 7 years.
The graph, however shows depreciation over 10 years because the most recent Motor Vehicle Census by the Australian Bureau of Statistics (January 2021) shows the average age of registered vehicles as 10.6 years.
Inflation
According to the Reserve Bank of Australia (RBA), since the introduction of inflation targeting in the early 1990s, inflation has averaged 2.5% per year. This inflation figure is used to calculate yearly costs each year (columns I and P).
Note that fuel and energy costs are predicted to rise faster than inflation, however, this is not accounted for in the calculator.
Yearly Costs
Registration
WA is the only Australian state to use weight in calculating individual light vehicle license fees. The registration is comprised of the following:
License fee – $25.52 per 100kg vehicle Tare mass
Motor Injury Insurance – $457.55
Recording fee – $10.30
MG ZS EV Excite – $868.51
MG ZST Excite – $798.33
Insurance
Based on quotes from RAC for fully comprehensive insurance with $500 excess, driving between 10,000 and 15,000km per year, single driver, with no claim bonus.
MG ZS EV Excite – $810.11
MG ZST Excite – $721.75
The insurance cost will diminish over time as the asset’s residual value diminishes, although it will remain higher than the rate of depreciation. Since the diminishing insurance rate will be equal for all vehicles, it hasn’t been considered in this calculator.
Servicing
MG capped-price service costs for Australia for 7 years (new car warranty period).
MG ZS EV Excite – average $262.00
MG ZST Excite – average $313.63
Tyres
ICE Vehicle
According to RAC and NRMA, generally speaking, tyres for an ICE vehicle last around 40,000km. This varies greatly due to individual driving styles and tyre pressure.
40,000km divided by 4 tyres = 10,000km per year per tyre. Assuming the average km traveled per year is 12,100km, it works out to an average of 1.21 tyres replaced per year for an ICE vehicle.
MG ZST Excite – $175.45
EV
Hyundai Motor group claims that EV tyres wear 20% faster than those of ICE vehicles due to the acceleration of electric vehicles that generate strong instantaneous power (torque).
40,000km (above) less 20% = 32,000km divided by 4 tyres = 8,000km per year per tyre – an average of 1.51 tyres replaced per year for an EV assuming average km travelled.
MG ZS EV Excite – $218.90
Miscellaneous (Repairs etc)
This field can be used for any miscellaneous yearly costs, ranging from anticipated repairs to estimated fringe benefits tax, etc.
EV Consumption kW/100kWh
17.1 kWh/100km – according to the MG ZS EV technical specifications based on the Worldwide harmonised Light-vehicles Test Procedure (WLTP) combined city and highway cycle.
ICE Fuel Consumption L/100km
7.3 L/100km – according to the MG ZST technical specifications (combined city and highway cycle).
Travel km/year
From the ABS Survey of Motor Vehicle Use in Australia 2020, the average kilometres traveled was 12,100km for all vehicles. This figure didn’t vary significantly across states.
Elect. Price Solar $/kWh
Using excess solar to charge an EV is not actually free, because you usually have to account for the relinquished feed-in tariff you would have otherwise received.
In WA, Synergy FiT is called the Distributed Energy Buyback Scheme (DEBS) = $0.025/kWh (off-peak rate).
Elect. Price Grid $/kWh
In WA, Synergy A1 Tariff = $0.30/kWh.
Elect. Price Road $/kWh
In WA, the RAC Electric Highway electric vehicle charging station network costs $0.45/kWh.
% Charging
When entering data into these 3 cells they MUST add up to 100% for the calculator to be accurate.
Fuel Price $/litre (unleaded)
According to WA Govt Dept of Mines, Industry Regulation & Safety the overall average price for ULP in Perth in 2022 was $1.86/Litre.
Total Cost of Ownership (TCO) Calculations
This figure is simply the Cumulative Cost less the Residual Value of the vehicle each year. The result is also output to the graph for EV and ICE vehicles. Note that there are other ways of calculating TCO which end up with the same result.
Yearly Cost
Yearly costs in year 0 (at the time of purchase) are registration and insurance. Year 1 uses the Total Yearly Costs (C34 and F29) x the inflation rate (C14). Year 2 onwards uses the previous year’s yearly costs x the inflation rate.
Cumulative Cost
Cumulative Cost (each year) = Cumulative Cost (previous year) + Yearly Costs Total
Residual Value
Residual Value (of the vehicle each year) = Residual Value (previous year) less (Depreciation x Residual Value (previous year).
In addition, the Residual Value on day one (Year 0) of ownership takes into account that the car has dropped its value by the annual depreciation percentage as soon as it is driven out of the car yard. This is the reason the TCO in Year 0 is so high.
Emissions
Calculating full life-cycle or cradle-to-grave emissions for any vehicle is complex. It consists of tailpipe emissions, fuel/ electricity production and transport, emissions created in the mineral supply chain, and vehicle decommissioning. Many recent studies have been undertaken, and although the figures vary, they all agree on two main findings. (1) Currently EV manufacturing creates more emissions than comparable ICE vehicles. (2) Despite this, EVs have a significantly lower carbon footprint over the full life cycle.
No. of Previous Owners
This is to specify whether the car is bought new, or used (one owner, etc). The embodied (manufacture) emissions are divided between the number of owners over the calculation period. It doesn’t mean the number of owners as a couple or family buying the vehicle!
No. of Previous Owners = 0 (you bought the car brand new)
No. of Previous Owners = 1 (you bought the car used from the brand new owner)
Embodied Emissions (manufacture including mineral supply chain and decommissioning)
Calculated using the Final Report for the European Commission 13-07-2020 “Determining the environmental impacts of conventional and alternatively fueled vehicles through LCA”
The report states – For a standard mid-sized gasoline ICE (internal combustion engine) vehicle the embedded carbon in production will be around 5.6tCO2e. A similar electric vehicle will have embedded production emissions of 8.8tCO2e.
Note that this study takes into account in its scope a life-cycle inventory including “all the raw materials”, “all the energy inputs”, “all the by-products and wastes”, and “all emissions to land, water, and air.”
Driving (Yearly) Emissions
This, as specified in ISO (International Organization for Standardization) 14064, includes tailpipe emissions (or lack of), plus emissions created by producing and transporting fuel and/or electricity.
Electric Vehicle
As specified in ISO (International Organization for Standardization) 14064 – Emissions Factor (CO2e/kWh) x yearly electricity consumption (kWh) = Yearly Driving Emissions (kg CO2e/year).
The emissions factor used (0.63) is an average of all Australian states derived from the Clean Energy Regulator EERS (Emissions & Energy Reporting System) release 2021–22.
This calculator uses the % of electricity derived from grid and road charging only to calculate yearly driving emissions.
Emissions Factor (CO2e/km) x (Electricity Total kWh/year x (% Grid Charging + % Road Charging)) = Yearly Driving Emissions (kg CO2e/year).
ICE Vehicle
As specified in ISO (International Organization for Standardization) 14064 – motor gasoline/petrol emissions factor = 2.33 kg CO2 per litre.
Download The Calculator
Get your free EV Vs ICE TOC calculator here. No login or email address is required. Let me know your results, and any other feedback is very welcome.
Footnotes
- Fringe benefits tax (FBT) may be due in some instances by employers providing vehicles for employees. Since 1 July 2022, employers do not pay FBT on eligible electric cars and associated car expenses. FBT is still due on ICE vehicles where applicable. ↩
- There’s a new kid on the block which will be cheaper than the MG ZS EV in this worked example. Available in the second half of 2023 will be the MG4 EV priced at around $42,000. This will change the equation and tip the scales towards an EV being more economical than an ICE vehicle over the life cycle of the vehicle. ↩
 RSS - Posts


Inflation rate is a protected cell. Cannot change it to todays reality.
Hi Norman. On the “Worked Example” all cells are protected intentionally so the user doesn’t mess it up. On the “User Comparison” the Inflation Rate is not a protected cell. Knock yourself out and do your own comparison. That’s what it’s for – so YOU can do your own comparison.
I’m driving my Tesla 3 from Sydney to Port Douglas from Monday 3rd May. Feel free to follow me on Instagram @ladytesla2023
I’ll try your chart. Thanks
Very interesting, thanks for your efforts in producing this….but if I try to input anything anywhere I get this message “Protected cells can not be modified.” (I’m trying to use it in LibreOffice Calc). Cheers, David J.
Hi David. All cells in the “Worked Example” are protected on purpose. Try the “User Comparison” to do your own comparison!
Appreciate the detailed analysis, in particular taking into account depreciation – which for many can represent the largest cost of a car. When I sold my 2 year old model 3, I experienced 31% depreciation. I feel EVs will continue to experience rapid depreciation as the market and technology matures.
In addition when I had an ICE on lease, the out of pockets for fuel was only about 50% of the regular price after tax. Whereas with EVs, you generally pay the full kWh home charging cost. This narrows the per km cost.
Selling any vehicle after 2 years can result in that kind of depreciation. That’s because most of the depreciation happens when you drive ot off the dealer’s lot. But you also copped the double whammy of Tesla dropping it’s prices on new cars and introducing the Model Y which is the more desirable car for Aussie conditions and thousand of Model 3s flooded the market with owners looking to swap over.
Had you sold in say June 2022 the opposite was true – you might almost have got more than you paid for the vehicle. Depreciation is never as simpke as it seems.
OK, found the tab at the bottom for “User Comparison” after a bit of looking.
Hi Kim,
Thanks for posting this calculator.
However, I noticed that it does not take into account the road user charge, which we are charged in Victoria (2.5c Per KM from memory) and most other states are planning on introducing over the next few years.
Based on what I’ve entered (it helps that I do all my own servicing, so the cost of that is negligible), the EV is only marginally cheaper so far, so I suspect this will make the ICE vehicle cheaper.
Cheers
Tony
Hi Tony. Good point. I never thought about the road user charge because we don’t have it here in WA. I could rework the spreadsheet and add a cell but don’t hold your breath. In the meantime I suspect you could add the road user charge into “Misc. (repairs etc)” or work in in somehow and tweak “Consumption kWh/100km)” to take it into account. I must admit that’s a bit clunky though. I’ll see what I can do.
Hi Kim,
Yep. That worked. I simply added the formula “=C25*0.025” to the “Misc. (repairs etc)” cell and it calculated it correctly.
Now unfortunately the total cost of ownership of the ICE vehicle is cheaper ($100k vs $108k over 10 years). Lets hope this changes by the time I’m ready to upgrade my car!
Tony – nice work. Adding the formula “=C25*0.025” to the “Misc. (repairs etc)” cell works a treat and saves me a ton of work.
“I never thought about the road user charge because we don’t have it here in WA.”
…yet
https://www.mediastatements.wa.gov.au/Pages/McGowan/2022/05/WAs-climate-action-efforts-accelerate-with-60-million-dollar-EV-package.aspx
The WA government is already factoring revenue from this charge into budget estimates (page 68)
https://www.parliament.wa.gov.au/publications/tabledpapers.nsf/displaypaper/4111130aba2c08b3520ef35948258841000fd905/$file/tp+1130+(2022)+-+bp3.pdf
We can only hope that the ‘Vanderstock & Anor v. The State of Victoria’ case currently being deliberated by the High Court kills this at a federal level. Or, at the very least, leads to fair usage charges for all road users; not just penalising EV owners.
Nice spreadsheet. Once I clicked on the user example rather than the worked example with locked cells.
While I get why this goes to 10 years, if it went to 20 years with a battery replacement at 10 and the used battery being repurposed as a second-life battery being able to be used as a solar storage battery, you’d be closer to where I see all these vehicle batteries ending up. This seems to be what is happening in the US, where EV’s/ hybrids are having their batteries recycled as storage. This is bringing storage down to less than US$100/kWh. At that price a whole lot of economic challanges switch from grid and grid tied solar to stand alone systems.
So although the spreadsheet just makes the EV slightly better, when you tak into account the improved situation in other areas it’s a lot better.
On the down side however, charging away from home and long distance trips are still going to be an issue for pure Ev’s in Australia for some time. We have to provide infrastructure for charging for a land mass that is the same as the US, with less than 1/10 of the population (330million US/26million Australia) to pay for it. That’s not going to happen overnight.
When I first came to Australia the road from Penrith up the Blue Mountains had roadworks. 30 years later it still has them. I’m not saying we shouldn’t do it, we should. But that’s the reality we have to expect. A project never finished. We simply do not have the available budget to be able to fix it. And that will be painful.
Interesting perspective on the charging front. However I think our challenge is actually much simpler than the US with 330 million people. I think the error you make is assuming we’ll need the same number of chargers as the US because we’ll need the same number of chargers at the same number of locations. Yes, we’ll need our DC chargers spaced about the same but although our land mass is similar to the US, if you look at average highway use it’s much, much less. Because we have less highways and less traffic we need less chargers at fewer locations. The Govt already has a fully budgeted EV infrastructure plan that should cover highway charging for the next 4 years. After that we probably have to up the ante. To your point about Penrith we already have Tesla and EV chargers at Lithgow and Tesla has just installed new chargers at Blaxland. There’s also some DC fast chargers in Penrith itself.
The most ignored challenge for govt is charging infrastructure for those with no off street parking. We really shouldn’t be leaving this to local councils. There needs to be a federal infrastructure plan to address level 2 street based charging.
Batteries don’t need replacing after 10 years.
Their warranty ends then.
Most cars have a warranty of 3-7 years, do we replace them once the warranty ends?
A big chunk of EV’s coming to Aus, have LFP based batteries, and you will find those are likely to last one million km’s +. Yes, more than one million km’s.
You can obviously choose not to believe me, but the proof will be in the pudding.
Thanks for analysis.
Two interrelated points
1 while average age of Ice vehicles might be 10 years the average would be reduced by cars bought this year which are only 1 yesr old.Maybe 50% are still in use at 10 years, allowing for write-offs from accidents. That means 50% of Evs will need battery replacement.during the vehicle life to get resold. Ice vehicles still have value at 10 years and engines generally last for way past 100k km.
2 What is the cost to supply and fit a new battery after say 10 years? Based on the difference in vehicle cost my estimate is $18,000. This will effectively mean the car is worthless at say 10 years.
The 10 year old Ice is probably worth 20-30% of its cost price. You could easily have got an estimate by some analysis on carsales.com.au
Battery replacement is the elephant in the room for
comparative lifetime analysis. It is also likely to mean a difference in write-offs of damaged cars and ultimately insurance costs. Improved battery technology and production may partially offset that but materials scarcity may exacerbate it.
Further to the point above re ICE values after 10 years.
2012 Toyota Corolla Ascent Auto
100,230 km Odometer
Sedan Body Type
Automatic Transmission
4cyl 1.8L Petrol Engine
$14990
But the day the battery goes in an EV after the battery warranty runs out the car is likely to be worth a few thousand at most for spare parts.
If it was a PHEV at least it would still be driveable and have value, and the battery replacement would probably be only $4,000.
A Toyota style Hybrid would probably only be about $1500
F!50 hybrid battery 1.5KwH
Ford Escape PHEV 14.4KwH
Ford Mustang Mach-E Extended range 99KwH
Source https://www.caranddriver.com/news/a15345397/battery-taxonomy-the-differences-between-hybrid-and-ev-batteries/
PHEV’s are probably the most efficient way to reduce emissions, retain range and maintain value over an equivalent life to an ICE only vehcile (provided they are charged after most trips).
A study by Recurrent Motors looked at 15,000 EVs on US roads and found that after driving over 160,000 km, most still have at least 90% of their original range. According to the study, only about 1.5% of the cars had their batteries replaced outside of official recalls. What percentage of ICE cars have engine failures?
With improvements in battery technology, we can expect even better reliability for EVs bought today. The study shows that modern EV batteries should last for 15 to 20 years before significant degradation occurs.
Advising people to buy ICE because ‘they’ll hold their value better’ is terrible advice IMO.
If you’re in the market for an EV, rest easy knowing that for the most part, the batteries are reliable and long-lasting. If you’re in the market for an ICE or PHEV, make sure you get a ‘guaranteed value’ deal – and hope the ICE manufacturer stays solvent to honour it.
Completely agree with you Finn.
If you buy an ICE vehicle today you are spending money on technology that will become obselete during the life of that vehicle and residual values will fall off a cliff as people choose EVs for their benefits and as ICE vehicles are gradually barred from cities or taxed on emissions as is already happening in Europe. Who’s going to want to buy your ICE car in 10 years time?
Thanks for the reply Finn.
I wasn’t aware of this report but I note that
QUOTE “Even that observation can prove a challenge, though, since most EVs have been on the road well under six years, with almost 30% sold in 2022.
We still have very little sense of how they degrade over their lifetime – which car makers say should be as long as 20 years. So far, it seems that EV batteries have much longer lifespans than anyone imagined, since very few of them have been replaced, even once the 8-year, 100,000 mile warranty period ends.
Car makers say an electric vehicle should last 15 to 20 years” END Quote
For anyone who is interested see:
https://www.recurrentauto.com/research/how-long-do-ev-batteries-last
Finn & Jonathan – I was actually thinking it is more likely to be the opposite (i.e. ICE vehicles are probably more likely to hold their resale value than an EV).
The road user charge (of 2.5c per KM) being implemented in Victoria changed my whole outlook on EV’s. It made it clear to me that the only thing making EV’s a feasible choice for the average person was the fact they were heavily subsidized and/or less highly taxed than ICE cars by governments worldwide and once those are removed (like Victoria did), they just don’t stack up from a purely economic perspective. There is obviously the environmental impact to consider, but from the discussions I’ve had most people seem to vote with their wallets.
I personally think that anyone buying an ICE car today is likely to see less depreciation than a comparable EV, simply because the upfront cost is much less (i.e. if a $65k Hyundai Iconiq EV and a $30k Hyundai i30 both loose 70% of their value over a 10 year period, the Hyundai Iconiq would have declined in value by $45.5k, whilst the Hyundai i30 would’ve only declined by $21k).
I agree about plug-in hybrid vehicles though. They seem to be the worst of both worlds for the most part (I’m not paying VicRoads 2c per KM when 40-50% of my driving will be on the ICE motor – I’m already paying the fuel exercise!).
I’m hoping that upfront costs of EV’s continue to decrease as that is the only way I can see them being widely adopted once government subsidies are withdrawn.
Finn Peacock,
“Advising people to buy ICE because ‘they’ll hold their value better’ is terrible advice IMO.”
I think there’s an assumption with many people that petroleum fuels will remain affordable and abundant in their lifetime, because that’s the paradigm they have only ever known and are unable to comprehend the possibilities of anything else. Evidence/data I see suggests there’s likely a fuel supply & price shock coming.
See my Slides #25 through #46 in the Attachment 1 with my Submission (#165) to the Inquiry into food security in Australia at: https://www.aph.gov.au/Parliamentary_Business/Committees/House/Agriculture/FoodsecurityinAustrali/Submissions
The European energy crisis shows us how quickly things can change.
Ha ha – Finn, I got rid of our last two ICEs, because they both had transmission problems, and neither the manufacturer nor the dealer was prepared to stand behind the product, or stand for the implied warranties under Australia’s consumer protection laws.
I’ve told them both I never want to have anything further to do with them.
Another friend has a premium European car, and he’s also having transmission problems – it would cost $6,500 to fix, the car is only a few years old, spending all that money on it wouldn’t add that amount to its value, and he’s decided he’s going to be better off selling it “as is”. Again, neither the maker nor the dealer would stand behind the product.
Add to that the near certainty that a hell of a lot of these companies that are currently manufacturing ICEs won’t survive, they’ll just go bankrupt and vanish.
And battery costs are falling. Batteries are being improved all the time. Range is increasing. Charging times are reducing. America is trialling a strip of road that you can drive along & charge your car WiFi from a panel in the road surface.
And I’m puzzled by these figures – I’ve seen lots of other EV owners reporting completely different costings. Is the real issue the inflated electricity charges in the eastern states? I will be increasing my solar panels and home charging off my own power supply. Services charges are lower on EVs. The capital cost of EVs is going to continue to trend downwards, while at the same time the capital cost of ICEs will start to climb higher, as sales continue to drop. I cannot be persuaded to believe the end result after 10 years is going to be the same!
Great work. It got me thinking though. Why do we need such a complex tool in the first place. Shouldn’t EVs be subsidised to such an extent that it becomes a no-brainer?
A very interesting comparison of a like for like vehicle interms of overall function give or take certain plus and minus factors in both directions.
Of course, everyone’s circumstances will be different as you and the spreadsheet recognise by allowing you to input your own variables. In my case I am retired, so no FBT benefits and1 free rego in NSW but that will probably stay with my 4WD for towing etc. I have a large solar array with heaps of excess solar but with diminishing FIT and I can charge during the day mostly, only needing to pay for charging when topping up while travelling. Nevertheless, my car tastes suggest I will be paying more like lower $70s when I come to buy a new car in 2-3 years and I will cover closer to 20,000kms a year, particularly if I have a low running cost EV powered by home solar.
On the other hand, I suspect EV depreciation will be lower while ICE depreciation will start to increase as buyer preference for EVs, range and better availability/pricing occurs. Look at China now, where EVs at the lower/medium end are becoming very competitive and sales are heading past 35% of the market. I tend to keep my cars longer these days.
So the next 5 years or so will be a very dynamic market in Australia as we follow overseas trends and shift towards EVs. Each person will have differing needs and circumstances but in my view far more buyers could practically use an EV even now than those who actually buy one. It is a pity the choice is so limited and availability, particularly of the more desirable and practical ones is so poor. Just give it a few years though and it will change. There is an avalanche of god EVs available overseas that makers will import once the new fuel and emissions standards are implemented and supply problems fixed.
Great spreadsheet! Takes everything into account – except the road-user charge for Victorian-registered zero and low emission vehicles.
2.6c per km driven
https://www.vicroads.vic.gov.au/registration/registration-fees/zlev-road-user-charge
Hi Anthony. I pointed out to another commenter that I never thought about the road user charge because we don’t have it here in WA. I could rework the spreadsheet and add a cell. In the meantime you could add the road user charge into “Misc. (repairs etc)” or work in in somehow and tweak “Consumption kWh/100km)” to take it into account. That’s a bit clunky though. I’ll try to add it in.
Hi again Anthony. The other commenter came back to me with a good workaround to add the road-user charge in to the “User Comparison”. Adding the formula “=C25*0.026” to the “Misc. (repairs etc)” cell should do the trick.
All the cells are protected and require a password so you can’t do any comparison so you’ll need to fix that. Also, any chance you can change this to an online Excel sheet (or Google Sheet)?
Hi Andrew. Only the input cells in the “Worked Example” are locked (on purpose). If you go the the “User Comparison” tab it lets you input your own data, which I encourage you to do.
Re on-line Excel sheet/ Google sheets – I’ll have to talk to the boss on that one.
I like the spreadsheet, I purchased a BYD Atto 3 in December for around $50,000 as I needed a new vehicle.
I have friends that own a Nissan QASHQAI which lined up against the Atto is very similar in size and shape so I looked up the lowest price for a new Nissan and crunched the numbers.
I live in Victoria so I also added the usage tax as a misc cost per annum for the EV.
The Atto TCO over 10 years is $74,600 versus $91,700 for the Nissan.
The emissions (kg C02e) for the Atto is 13,400 versus 39,200 for the Nissan.
So, a total saving of $17,100 and a third of the emissions over 10 years.
I’m very happy.
You’ll love the Atto 3. I have one and it’s actually much better than most compact SUVs (see the Chasing Cars best small SUV 2023 where the Atto 3 came in 2nd out of about 20 vehicles). Ok there are things about it I would change but the equipment level, the tech that actually works and the ride quality punch well above it’s price. Much higher equipment level than the MG ZSEV.
The only things I’d change:
1. Would love it to have one pedal driving. This drives more like a regular car with regen mostly on the brakes. Some people prefer that.
2. Better tyres as stock
3. Some slightly less annoying sounds. The vehicle pedestrian warning is over the top.
Definitely take it for a test drive.
Probably the best cost estimator I have seen so far. As you say, the higher the annual km driven the bigger savings made plus minimal polution.
Two factors that no one seems to be talking about are (1) the effect in a crash of the extra weight not just on the e/v but on the other vehicle. (2) Warranty. Most makers have unlimited km warranty for 5 or more years on the whole vehicle which is great plus 8 years or 160,000km on battery. Tesla have 180,000 km on the battery but only 80,000 km on the rest of the car which implies that they don’t trust the quality of the vehicle. You can purchase an extended warranty !
If you use the vehicle weather it be ICE or EV for business check the warranty conditions. For ICE vehicles it usually ends at lower km with different servicing intervals.
Regarding the crash impacts:
EVs have their batteries low down under the floor of the car, so they are inherently more stable and like likely to roll in a crash (the Tesla Model Y for example had the lowest rollover risk of any SUV ever tested by the US NHTSA). There is also no big engine under the bonnet to come into the occupant space during a frontal impact. In terms of total weight, the Tesla Model 3 weighs 1760kg, versus a Toyota Camry which weighs 1650kg – the difference isn’t as great as you think.
I agree with you on the weight being lower in the vehicle – EVs have a lower centre of gravity even if most are almost all are quite a bit heavier at this stage of their development. Battery and design integration improvements is seeing that weight reduce and it will probably end up the same or lower than ICE vehicles. Modern engines and transmissions in ICE vehicles, let alone core vehicle structures, have reduced incredibly in weight in the last 3-4 decades in pursuit of lower emissions and much better fuel economy. It is crash protections and safety and comfort equipment eg sunroofs, bigger wheels and tyre, infotainment etc that have significantly offset those reductions and kept weights stable or increased.
On your other point about bonnets, they don’t intrude into the passenger cabin in modern cars. In moderate impacts they are designed to pop up at the rear hinge to help passenger safety and in higher impacts they fold to help absorb impact. Also, airbags protect the driver and front seat passengers. Laminated screens are well bonded into the car and are designed to shatter but remain in one piece because of the strong plastic layer in the screen sandwich. The mangled roofs and ripped off roofs and removed screens lying nearby in most accident pictures are typically a result of the rescue crews using the hydraulic cutting tools to access the passengers.
However, crash impacts in EVs will continue to improve as there is no engine or transmission to have to control in the event of a very severe frontal impact. This will give safety engineers more flexibility in developing crush zones.
Kim Wainwright,
“…the overall average price for ULP in Perth in 2022 was $1.86/Litre.”
What’s the fuel availability/price outlook later this decade?
Australian Deputy PM & Minister for Defence, Richard Marles MP, was on ABC TV’s Insiders programme last Sunday (Apr 30), where he said from time interval 0:00:53:
“But we’ve also changed. You know, we are much more reliant upon our economic connection with the world. You know, in the early 1999’s, our, er, trade as a percentage of our GDP was around 32%. It’s now, in 2020, was up to 45%, and there’s a physical dimension to that economic connection. Most of our liquid fuels now, almost all, come from overseas. Back in the ’90’s, we use to do it all onshore. In fact most comes now from just one country, and that’s Singapore. So, the threat is not we are about to be invaded, but our exposure to economic coercion, and to coercion from an adversary is greater, and the potential for that coercion going forward is much more significant, and that’s where the threat lies, and that’s why we need to re-posture for that threat.”
https://www.abc.net.au/news/2023-04-30/deputy-prime-minister,-richard-marles/102284122
Singapore is a significant liquid fuel supplier, but so are South Korea, Japan, Taiwan & Brunei. See Matt’s tweet on Apr 30 re diesel fuel imports (including a graph of diesel fuel imports Jan 2004 to Aug 2022):
https://twitter.com/crudeoilpeak/status/1652610804712378368
The accumulating data I see:
* The quality of oil is declining; there’s less net energy available per volume of global liquid fuels produced.
* OPEC oil production appears to be beginning a sustained decline; ~32 Mb/d in 2018; 27.87 Mb/d quota for May 2023.
* Australia is exposed to commercial changes & geopolitical constraints in liquid fuel supply markets.
* Crude oil production in Asia is in decline.
* There are multiple layers of vulnerabilities over which Australia has little (if any) control.
Some commenters here are talking about what happens when the battery in an EV needs replacing after 10 years. I wonder where this furphy comes from? There’s no reason to suppose a battery, like many other components, won’t last a lot longer than the manufacturer’s warranty period.
Thanks Kim,
I agree with the people looking to do 20 year analysis, so some extra years would be nice. Adding columns between I&J and P&Q for costs occuring less frequently than yearly intervals could be useful for battery replacement (and possibly put tyres there rather than as annual cost)
The sheet doesn’t take time value of money (NPC) into account so just applying CPI to the future costs isn’t really right. This can be “kludged” by deducting an inflation estimate from an estimate of future cost of goods and using that as the inflation figure instead.
Similarly if you are trading in your existing vehicle that can be deducted from the purchase price of the new one or entered as a negative under subsidy. I assume the Purchase Price number includes GST?
It might be possible to use the Misc Cost cell for lease payments and delete the purchase cost?
Would be nice to see another version of the sheet that can look at PHEV’s where both petrol and electricity are fuels
The word “cumulative” only needs one “m”
Do you think its weird that MG also have an EV model named “Essence” when that is the french word for petrol?
Hi Mark. All good points. Strangely enough, I originally made this spreadsheet over 20 years then decided against it because I thought for 90% of people keeping a vehicle for that long isn’t realistic. I decided to stay conservative with my approach and keep within the limits of manufacturers warranties and social norms.
As far as the value of money NPC and CPI goes – I’m not an economist, and I don’t have a crystal ball. Nor does anyone I know. My personal opinion on that is that inflation or future costs of commodities should be kept out of the equation totally, and any calculations should be done in the value of today’s dollars, because we simply don’t know what the future holds. But that’s the beauty of having your own spreadsheet. You can put in whatever inflation figure you like, or as you say – kludged to fit the parameters you think will affect the outcome. Bear in mind that it’s all speculative.
Yes that’s quite ironic about the French word “essence”. Perhaps MG should have done their research before naming the Essence. Heads should roll for that mistake. The guillotine would be apt.
Hi Kim,
A late comer to this and starting research to this point on TCO for a HEV vs BEV.
My point would be realistically, is 10 years too long for the ownership window? My current Hyundai Accent is from 2015 and has done >160,000km, but despite being thrifty and fun to drive, it’s time. I had looked at replacement nearly 2 years ago but due to a change in circumstances I decided to delay. For me, once an ICE is >5-6 years old it’s worth replacing.
I’m a simple civil engineer so not sure on the depreciation number – assuming this is annual, so 40% at the end of 10 yrs should input 4%?
“A higher inflation rate favours EVs over ICE vehicles for value because the higher upfront cost is paid earlier, and subsequent yearly costs are lower for an EV”
I’m pretty sure this is the opposite of how it works.
Paying high upfront costs is generally bad in a high inflation environment because the value of say $1000 also inflates. This is why buying a house, but then paying it over 30 years looks rather cheap in a high inflation environment (ignoring the fact that it isn’t a depreciating asset), this is because while in the initial years the payments might be 35% of your take home pay, in 20 years it’s likely to be less than 10%. So in general fixing a price and paying it over time is best in high inflation, so paying up front would be the worst result.
Your calculator does not include the cost of funds, which is an important differentiator between 2 options with very different prices and the lack of this cost significantly advantages the higher cost alternative. For example the $18000 difference in cost parked against your mortgage would save you $900 a year on interest. By counting it as zero cost you ignore the opportunity cost of that differential. I see this mistake made a lot when people do calculations on storage battery systems. Capital has a cost and you need to factor that into any calculation.
Hi Harry. I’m trying to wrap my head around that, and try as I might, I’m unable to. That’s not to say you’re not right. I’m just not quite getting it.
Three things:
1) I can’t imagine a scenario where paying upfront for an item would be less advantageous than paying that item off over time, especially if inflation and interest rates are high. Please point me to a link that explains this. I’m keen to know how it’s possible.
2) My statement “A higher inflation rate favours EVs… ” wasn’t referring to borrowing money so surely this isn’t relevant?
3) I’ve been wrong before! If you think it’s important to show the cost of capital then how would you include it in the spreadsheet in a simple way that’s intuitive for the user?
To get the money to pay up-front, it had to come from somewhere. A savings account where it was earning positive interest or by selling some shares that would be paying a dividend. The upfront money is money with lost potential returns from somewhere, not just some money under the mattress…
If that is a positive or a negative depends on the rate of interest for borrowing and the rate of return you were making on it already.
So upfront money has a cost associated.
1)”I can’t imagine a scenario where paying upfront for an item would be less advantageous than paying that item off over time,”
I provided such an example with houses.
Say you buy a house for $1M, but you are paying it via a 30 year loan.
Say your income was $120k/year. Your monthly repayment including principal is $6653 or $79836 a year – i.e pretty much your entire take home salary.
But in just 10 years time with 5% inflation on your salary, you’d be earning 195k and $79k a year doesn’t look too bad. In 15 years your salary would be $250k, i.e. $20k a month and your $6653 a month repayments would be quite manageable and getting easier each year.
This of course presupposes that real wages don’t fall in the long term.
Paying up front is feeling the entire pain straight up.
Note that you mention inflation and interest rates.
Inflation is currently higher than interest rates. So this means that you are acquiring money cheaper over time. The lender is effectively losing value at the inflation rate, but receiving a lower interest rate in compensation. So borrowing is cheaper than paying up front.
To simplify it for you let’s consider a very artificial scenario.
You offer to sell me your EV at $49k today, inflation is running at 10%, but you are happy for me to take the car today and pay you any time over the next 2 years. When would be the best time to pay? Today or in 2 years time?
In 2 years time obviously. The $49k would be around about 20% cheaper in 2 years time due to inflation.
If inflation was close to zero, then the timing would make no difference (but I’d likely still not pay for 2 years since I could invest the money).
I don’t understand why you want to mention interest rates, since the money doesn’t appear from thin air. If you pay up front you are either borrowing the whole amount, or using your own cash for which there is an intrinsic value and should be accounted for as I mentioned above.
2) My statement “A higher inflation rate favours EVs… ” wasn’t referring to borrowing money so surely this isn’t relevant?
You are assuming that just because you are using cash it doesn’t matter.
I’ve pointed out the error that underlies this thinking.
Basically you are giving zero value to the $18k differential beyond just the numerical value. You aren’t factoring opportunity cost of having that $18k for use on something else (the easiest obvious comparator is paying $18k on a mortgage as explained above).
In addition in (1) i’ve tried to demonstrate how deferring paying the upfront cost as long as possible clearly reduces its impact in times of high inflation.
3) Using the definition of opportunity cost of funds”: “Opportunity cost is the forgone benefit that would have been derived from an option not chosen.”
We don’t need to be very sophisticated here sure you can earn more on high yielding dividend stocks etc, but for most people it would be the difference between paying down their mortgage or spending the money on a more expensive car. So I’d add a “cost of funds” column (editable) that allows a percentage (say 5%) cost to be included for the difference.
If you really want a TCO you’d take that 5% on the whole price of the vehicles rather than just the difference. It ends up with the same TCO differential but with higher costs for each from the start.
Harry, while I favour ICEVs over EVs your inflation claim looks back to front.
In an inflationary environment money doesn’t inflate, quite the reverse. If you look at the Weimar Republic for instance and hyperinflation it took wheelbarrow loads of cash to pay for groceries. Prices inflate\rise, but money is stagnant, which means it loses ground relative to prices. It is thus optimal to dump money into capital so as to retain the inflationary rise in value – this is where the rich benefit in an inflationary environment and the poor get even more bankrupt.
The only way to offset inflation in relation to cash is to have an interest rate that is equal to or greater than the relative rate of inflation – which kills those with mortgages or rent. Note I say relative as the absolute rate is irrelevant. A man who buys a house has a completely different inflationary paradigm to a man who buys groceries each week. Obviously it’s not necessarily one or the other, this is just an example.
I’ve no clue what you mean by cost parking against mortgages, but am going to assume you’re thinking of interest not earned on funds spent rather than saved etc.
Under the hyper inflation of the Weimar Republic it made sense to buy something immediately, because cash was discounting so quickly. However the debate isn’t about when you buy it but when you pay for it.
Using your Weimar Republic example buying a loaf of bread in the morning for 1000 marks is certainly better than paying 1200 in the afternoon, but I’m talking about buying it in the morning and paying for it tomorrow, when 1000 marks isn’t worth as much.
Depreciating assets like cars aren’t places to “dump capital”
Those with mortgages benefit from their house and wages inflating but the capital cost of the house staying static. Currently mortgage interest rates are lower than inflation.
Harry, while I think you are right to include the lost opportunity cost of the capital you are incorrect about being better off borrowing the money in a high inflationary environment. Your example of a mortgage is flawed because a house is an appreciating asset, not a depreciating asset. The 2nd assumption is that wages keep pace with inflation in an inflationary environment. This might be true for a 30 year mortgage when you amortise over time but in the shorter term wages tend to lag behind inflation by 12 – 24 months. The 3rd assumption that interest rates are lower than inflation only holds true if you borrow money when inflation is increasing. Even then financial institutions tend to be clever enough to factor those increases in. Then you rapidly fall behind when inflation falls because unlike a mortgage your interest rate is not variable. Finally, inflation is not consistent across the economy. You really lose out if at the end of your loan the price of new vehicles has not kept pace with inflation. This is a very real risk given current inflationary pressures mainly stem from Russia cutting off gas supplies to the rest of Europe. This could change dramatically over a 4 to 6 year car finance. Increased renewables coming on line, Russia caving to international pressure, Hinkley Point comes online in 2027 – any number of scenarios could combine to bring energy prices down and inflation with it.
While I agree with you on the basic concept, you are comparing the opportunity cost of the higher initial EV cost to whatever investment return you might make on that extra money. Sure if you invested it in good shares the return might be better, but if you spent it on a flash holiday who would you value the opportunity cost?
You might then have to consider for comparative purposes how you would value the benefit of a car that is better for the climate and emissions and how much you value low operating cost in the future when the cost of running an ICE is likely to increase while your EV running cost may be fairly stable or even decrease – electricity is likely to become a much cheaper commodity in future when renewable energy is in significant excess supply and setup costs largely amortised. Meantime finite fuels will most likely become more expensive over time.
I have friends who have installed batteries knowing that is not profitable to do so but they simply want to help reduce emissions. Cost is not an important driver for them, neither are they trying to ensure supply – just doing the right things. I have several other friends who are now considering EVs even though they are happy with their ICE car, simply for environmental reasons.
Not everyone is driven by investment returns or money and many can afford to make choices on other grounds.
I’m pretty sure this post was about the comparative financial outcomes of EV versus ICE.
Excellent – thank you. Showed how quickly a EV can be ahead of the game for me. Would suggest a couple of cells to enter Car types above EV/ ICE Purchase Price..
Would there be a way to adjust the quote for purchasing the vehicle on a novated lease with the new changes to Novated leases for electric vehicles?
Novated lease beats upfront by a long way if you have a high marginal tax rate
Right now there is the temporary instant asset write off provisions which end on June 30th for businesses. I’m on that path so the incentive is a no-brainer, the eventual real depreciation at later sale is already paid for. Novated leases are also an option but not as attractive. If you are thinking of EV, the time is right. Cheers James
Agreed, coupled with no FBT it’s rather compelling.
Hi Kim
I purchased my second new car 8.5 years ago, 37 years after my new gemini, i scrimped and scraped over the yesrs, I paid off my mortgage as a single person, managed to put enough away to retire, although a few years to early, health problems, but, still enough to be classed a self funded retiree, at the bottom of that scale though, my unit is fifty years old, no garage, just a carport, no infrastructure for charging, strata is reluctant to go down that path, there are several older owners that dont own cars and a coulpe of younger ones that don’t own cars as well, public transport is really good here, I’m thinking I would like to sell my car in a year or two, with a bit of savings buy a modest used 4wd, off road, nothing major, travel around Australia, that sort of thing, once I have had my 4wd fill, sell the old girl for pitence, you can see where I’m going with this, ill stil need a car, Mum, Brother and Sister, late at night ect, buying a second hand ev is full of pitfalls, there are heaps and heaps of people in the same position as me, rich in some people’s eyes, but not quite rich enough, let alone people on less than me, we will not be able to go down the ev path, pricing, rebates have to change drastically otherwise, with the economy looking grim, a decade or so will pass and, there will still be a sizeable portion of Australians driving gas guzzlers, that’s just my opinion, how do we fix this problem.
Regards
Bruce
It sounds like your plan for potentially buying an EV is 5-10 years down the track.
Don’t get too caught up in all the hoohaa going on around EV’s right now.
The proof will be in the pudding (either way) well before you need to purchase an EV.
If an EV isn’t suitable for you now, don’t worry about it, that’s all there is to it.
Very useful post thanks.
There is some discussion of expected battery life/degradation in EVs.
There is limited data out there but Tesla (for example) does publish info on this occasionally.
Tesla released its 2022 Impact Report recently and updated its battery degradation data – reporting 12% battery degradation after 200,000 miles using data from Models X and S.
This equates to approx 320,000kms or 21 years of driving at 15,000kms per year.
https://electrek.co/2023/04/25/tesla-update-battery-degradation/
Thanks TimC
Useful information. The issue of battery degredation has been made much of, particularly by various groups who opposed or were sceptical about climate change and the potential for EVs. Some of those were also playing dirty tricks, using the techniques largely pioneered by the Tobacco industry in opposing regulation of smoking. I was involved in the government side of implementing that regulation and know full well how dirty the tricks can be.
However, in the early days, when batteries and their management plus emergency services knowledge of how to deal with battery fires (now a very rare thing, more rare than fuel tank fires) the lobbyists had some modest problems to work with and inflate hugely.
However, battery and EV development has moved on rapidly and if you talk to people using these vehicles battery day to day degredation is largely a non-issue, just like these days replacement of failed vehicle engines and gearboxes is also a relatively small but expensive problem. But, again in relative terms (ie cost per 1000 vehicles), failed engines and transmissions probably costs quite a bit more to warranty claims or out of warranty costs than failed EVs batteries. More importantly, an EV specialist maintenance industry is growing particularly in countries where EVs sell in significant numbers. An EV showing reduced output or degredation need not necessarily be replaced – in most cases, problems are with control systems which can also be fixed (same as ICE cars) or most batteries can be removed and have cells replaced etc. That is much cheaper. And you can still drive an EV perfectly well with less than say 90% of capacity, it will just not travel as far on a charge.
Our family just purchased a new ICE vehicle, and i wanted to give the perspective of a buyer who likes the idea of an electric car.
We were looking at the $30K price range which cut out all EV’s,
Even if i could afford an extra 20K i would not want to buy a Chinese brand car until they are tried and tested over time so more then 20K would be needed.
The option i wanted to go with was one of the Toyota hybrids however after to speaking with our local Toyota branch it is a minimum 12 months wait for any of them, 2 years for the more popular options.
The car we were replacing was a little Honda jazz that we use for around town and would be the perfect situation for an EV.
But they are just prohibitively expensive for the role of an economic around town car that would not put on a lot of K’s
Hi James,
I’m sure there are many people in your situation – but here in Hobart a few of my colleagues bought second hand Nissan EV’s (such as this one https://www.goodcar.co/live-cars/leaf-ze1-40-kwh-0ze1019350)
This would have been very close to your budget and most likely met your needs as an around-town car with limited range!
You haven’t factored in that all ICE vehicles will start to increase in value once new ones are banned as they will become collectible.
And I don’t see factored into the Spreadsheet what happens with your EV total cost of ownership if China or Russia knocks out all our electric grids with EMPs 🙂
Hmm. I disagree that ICE vehicles will appreciate in value. I would expect them to depreciate faster as fuel becomes more expensive and is less available due to demand falling off given the switchover to EVs with reducing prices and better batteries and range. Economies of scale and all that.
Reg Watson,
“You haven’t factored in that all ICE vehicles will start to increase in value once new ones are banned as they will become collectible.”
Perhaps some ‘classic cars’ may become more valuable as static exhibits. I’d suggest most ICEVs will lose their value dramatically as petroleum fuels to operate them become increasingly scarcer and more unaffordable.
https://www.solarquotes.com.au/blog/ev-vs-ice-excel/#comment-1539268
Declining global supplies of heavier crude oils with the longer-chain hydrocarbon molecules that are suitable for refining into gasoil/diesel fuels has already started. Global gasoil/diesel supplies peaked in 2015-18 at around 26 Mb/d, then steadily declined to below 23 Mb/d by mid-2021.
https://crashoil.blogspot.com/2021/11/el-pico-del-diesel-edicion-de-2021.html
US petroleum geologist Art Berman stated in Jan 2023:
https://www.artberman.com/2023/01/18/theyre-not-making-oil-like-they-used-to-stealth-peak-oil/
“And I don’t see factored into the Spreadsheet what happens with your EV total cost of ownership if China or Russia knocks out all our electric grids with EMPs”
I’d suggest an EMP strike could potentially damage electric starters, fuel pumps, injectors & electronic ignition systems of ICEVs too, but more likely to disrupt the electricity grid that supplies energy to the electric fuel pumping systems at fuel supply bowsers, fuel distribution systems, payment systems, etc. An EMP strike would be grim for any society reliant on electrical/electronic systems to function.
Any chance of also comparing hybrids to ICE and EV?
Also is it worth reverse engineering so I can use the battery to power the house of an evening?
I reckon that putting in the reduced petrol consumption figure in the ICE column is about all you need to do to make the comparison and of course put in an appropriate purchase price. I did it for a Corolla Hybrid and it murders the EV due to its low purchase price, and relatively low petrol usage.
A hybrid Corolla is most definitely unparalleled in the Australian market right now.
But that’s because you’d be comparing the total cost of ownership of a small Corolla to an SUV (the cheapest EV’s in Aus are all SUV’s right now).
Another great resource – thanks. It would be nice to include interest on purchase price and include grid emission intensity explicitly. Likely in WA that if you use solar a gas generator will replace the electricity you are using rather than exporting (other than for a few days a year).
If you don’t consider scheduling charging the cost to Synergy will be very high as will the emission intensity. Ideally V2G would solve all these problems but that’s only technically easy.
Thanks but I DONT SEE HOW to enter information into the ‘spread sheet’.
Is it a guide only?
andy
Hi Andy. If you read through again you’ll see how it explains that the “worked example” tab is locked while the “user comparison tab” is where you should click on to enter your data and do your own analysis. The pictures also tell the story. Let me know how you go
Based on my EQE350 Mercedes against the E300e Mercedes I previously owned it would be 3 years to be in front with the EV for emissions and 4 years on costs.
I have a 20kw solar so most of the charging is via the solar
The EV is made in a carbon neutral factory and I think the car is 100% recyclable.
The calculation does not seem to account for that situation.
However a very useful tool
L Pomfret – it sounds like you are in a relatively fortunate position with a large solar array and a car from a market segment where there is a range of choice and a lower gap in pricing between ICE and EVs.
Trying to account for all situations is impossible in a spreadsheet. You can at least account for your ability to charge at home by making a few estimates of amount of charging required over a year, apportioning the number of kw/h required to home vs external and then multiplying the external charge kw/h by estimated cost.
While the factory is carbon neutral that doesn’t mean the vehicle is – I don’t think Benz include the embedded emissions of materials or the emissions of suppliers. As for recyclable, it is a positive but in Australia we don’t have the capacity to recycle many of the parts locally.
Hi, I’m glad you’re finding the tool useful. Your results sound encouraging.
Regarding the emissions from the production of your particular vehicle – I think you’ll understand how complicated it would be to factor in every vehicle’s nuances let alone have access to that information. This tool is simplistic on purpose. However I’m happy to spend the next year creating a more suitable spreadsheet. I’ll send you my banking details so you can deposit my salary directly before I start thanks 😉
Looking at your calculator it shows me that there is another elephant in the room.
An ~$18,000 up front cost difference and a ~$4,000 total running cost difference over 10 years and only saving ~15 tonnes of CO2.
It would be better all round to buy the ICE and spend the extra on a big solar system with a battery and end up offsetting the ICE CO2 and have an overall total minus ~20 tonnes CO2 emission and payment for the uploaded electricity over 10 years.
So that way the planet wins and you win.
I also think the calculator is great, and so clearly presented. Thank you for sharing. However, the cost of money to fund the difference between the EV and ICE purchase prices must be taken into account if it is to be a fair comparison. Given that you are looking at a min of $15k price differential this is not insignificant. I’d suggest funding the difference in prices via a loan and factor in the cost of the interest on that loan each year onto the EV costs. You could use an interest rate of choice to reflect either the true commercial cost of a loan, or maybe use say 4% to reflect a loss of bank account foregone interest on your savings, because you bought an EV not an ICE.
I am also perplexed by the supposed reliability of EV batteries when the Canberra testing of home batteries produced so many duds. Is this perhaps an unfair way to compare? Am I missing something here? I hope so, as I’d like to own an EV!
“40,000km divided by 4 tyres = 10,000km per year per tyre” .. are you sure?*
Shouldn’t the calculation be:
price of a set of 4 tyres
divided by
40,000km divided by number of kms travelled per year
e.g. Assurance MaxGuard SUV tailored for mid-size SUVs
4 x $289 / (40,000 / 12,100) = $349.69 per year
*That could have possibly worked if the car did 10,000km per year.
Hi Kevin. We’re both right. The same result can be calculated different ways, and in this case both of us come up with the same answer. In my calculation I used a purchase price of $145 per tyre, so I’ll apply that to both your and my methods. It’s up to each individual to plug in whatever tyre price they think is right for their vehicle. I’ll break it down.
My calculation:
40,000km = life of 1 tyre.
4 = number of tyres.
12,100 = average yearly km
40,000 / 4 = 10,000
12,100 / 10,000 = 1.21
1.21 x $145 + $175.45
or
life of 1 tyre / number of tyres
above answer / average yearly km
above answer x cost of 1 tyre = cost per year
Your calculation: (using the same cost per tyre of $145)
price of a set of 4 tyres / (life of 1 tyre / average yearly km) = cost per year
or
4 x $145 / (40,000 / 12,100) = $175.45
So we’ve both come to the same conclusion using a different method. Whether you want to put more expensive tyres on your vehicle is an individual choice. That’s the whole point of having a flexible calculator which you can tailor to your own needs.
I think the next version of this needs to include the alternative to what you could do with your money. Most people are financing the car they buy and that cost difference between a 30k and 50k car is significant when you consider that the price difference could instead go towards an index growth portfolio at 7-8% p.a.
I agree and said so at the start. I said to buy ICE and invest the extra in a big solar with battery that way you get paid for the upload and offset the ICE to end with about 29 tonnes in credit. A win, win situation, help your pocket and the environment at the same time.
An addition to that is you are much less likely to burn down your house.
Sorry, making depreciation assumptions using battery and vehicle warranty is ridiculously flawed, that’s not how much money someone really loses when they sel their car after 3 years. Depreciation is purchase dollars lost each year. If you checked Redbook (which takes real data from sales for calculations), the MG EV in reality lost an extra $7000 in 3yrs where the petrol lost $5700 less than your gestimate – a difference in the real world of $12,700 out of someone’s bank account!
The Real Figures are: EV goes from $45k to $23k in 3 years, not the $29.8k you calculated. The MG petrol goes from $33k to $22k in 3 years, not the $16.7k you calculated. So the EV lost $18,000 in reality (not your $15k guestimate) in 3yrs where the Petrol lost $11,000 in reality (not your $16700 guestimate) in 3 years.
kaka maka article and very subjective. carry on with your electric lie and check some lithium sites in Chile, per etc and come back to me. Unethical vehicle and a terrible ride with no involvement and no character. enjoy your appliances
Hi Tom Boston,
In the spirit of helpful comments and useful information, you’ll be pleased to know the future has always been electric. We’ll run out of oil if we don’t cook the planet first.
https://www.solarquotes.com.au/blog/electromobile-renewable-future/
Hi Finn
Really useful spreadsheet, thanks for developing such a visual and user-friendly format. I’m sure it is getting a whole lot of downloads as of the past few weeks.
I do have question / suggestions:
– Would be helpful to have a graph that charts the Cumulative Cost. This would give full picture of capital and operating cost.
– Minor – would be to remove the decimals in the output tables, ie Cells H24 to T34. They tend to crowd out the cells, and don’t add overall benefit IMHO.
Thanks again