
Solar panel temperature is typically at least 20ºC above ambient temperature.
Solar panel output is hurt by heat. The hotter they are, the lower their efficiency. This seems like a major drawback for something deliberately exposed to the Australian sun. In practice, it’s not something anyone with a solar power system needs to worry about. This is because our hottest days … usually have the most sunshine.
In this article, I’ll show that solar energy output is modestly reduced by heat on days of record-breaking high temperatures, but total generation is still well above average.
Efficiency Reduced By Heat
A modern solar panel has its power output reduced by around 0.37% for each 1°C increase in cell temperature over 25°C. Some do better than this. For example, SunPower Maxeon panels only lose 0.29%. But for the majority, it’s around 0.37%. All else equal, this means in a 40°C heatwave, a typical panel will provide 7-8% less power than when it’s a pleasant 20°C.
This isn’t a large reduction, but it’s still not good. After all, if they started putting 7-8% fewer smarties in a packet I wouldn’t be happy.
Because efficiency losses from heat worsen as electricity demand for air conditioning increases, it can sound like a big problem. But I’ve never heard a solar owner complain about solar output during heatwaves because they almost always occur when skies are exceptionally clear.
An Overblown Problem
Some people have looked at the heat loss information on solar panel datasheets and then wailed to the world that it’s some kind of disaster for solar power.

The Jinko Solar Tiger Neo N-Type datasheet says it has a Pmax of -0.3%, which is very good and a NOCT of 45+/-2°. There’s an explanation of the meaning of Pmax and NOCT in this article.
I’m not just talking about miserable bastards who hate the thought of the world becoming a better place or fossil fuel supporters who desperately want to convince everyone else that energy is only fun if it’s dirty. Many people who like solar energy have made it sound like a problem because they didn’t look at real-world results. These show that on our hottest days solar output — while not perfect — is still high.
Summer Vs. Winter Solar Output
The average difference between summer and winter daytime temperatures in Australian capitals ranges from a meagre 0.9° in Darwin to a whopping 12.8° in hot and frosty Adelaide. If we only consider the average temperature difference between the two seasons and nothing else, then the efficiency loss for typical solar panels in each capital would be…
- Adelaide Summer Vs. Winter: 12.8° hotter = 4.7% loss
- Brisbane Summer Vs. Winter: 7.6° hotter = 2.8% loss
- Canberra Summer Vs. Winter: 7.6° hotter = 2.8% loss
- Darwin Summer Vs. Winter: 0.9° hotter = 0.3% loss
- Hobart Summer Vs. Winter: 8° hotter = 3% loss
- Melbourne Summer Vs. Winter: 11.1° hotter = 4.1% loss
- Perth Summer Vs. Winter: 11.7° hotter = 4.3% loss
- Sydney Summer Vs. Winter: 8° hotter = 4% loss
But heat-related efficiency loss isn’t the only thing affecting output. Other seasonal differences means solar output is higher in summer than winter in every capital but one:
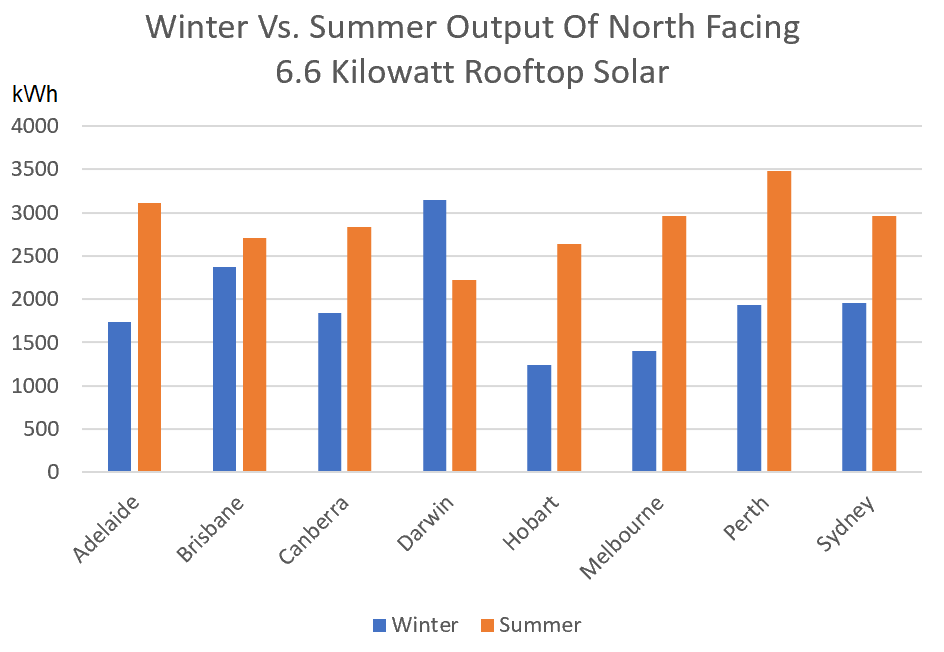
Spot the odd-one-out. I used a 6.6 kilowatt system size for this graph, but if you can install more than this on your roof, I definitely recommend it.
As the above graph shows, solar energy output in summer is higher in every capital except Darwin, where there’s less than 1°C difference between summer and winter temperatures.
There are two main reasons why summer solar output is normally higher…
- The summer sun is higher in the sky so sunlight hits rooftop solar panels more directly. This effect is largest in Hobart and diminishes as you head north.
- Days are longer. During the longest summer day in Hobart the sun is above the horizon for 6 hours and 20 minutes more than during the shortest winter day. In Darwin, the difference is much less. The longest day there only has an extra 1 hour and 28 minutes of daylight than the shortest one. More daylight is the main reason solar output is normally much higher in summer than winter.
There’s also a third major factor that can work either way…
- Seasonal variation in cloud cover can have a large effect on solar power generation. In the southern half of the country, winters are usually cloudier than summers, while it’s the other way around north of the Queensland border.
Compared to these factors, heat losses are a minor consideration.
Solar Output Of Crazy-Hot Days
To demonstrate solar power won’t perform poorly on especially hot days, I will use graphs from the Australian PV Institute (APVI). These show that on days of record-breaking high temperatures, solar output is still high.
Here are two APVI graphs for South Australian rooftop solar. The one on the left shows high solar output on a cloudless summer day, while the one on the right shows low output on a heavily overcast winter’s day:
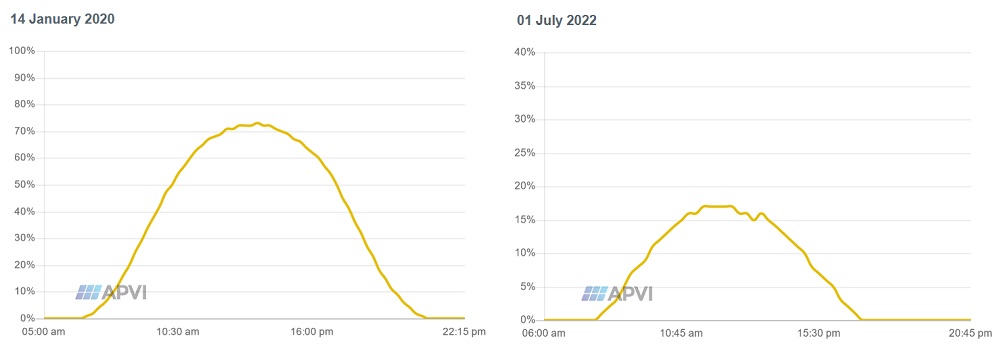
The percentages running up the sides of the graphs are how much of its theoretical maximum output rooftop solar is meeting. The results never get close to 100% because that would require all panels to face the optimal direction and for there to be no losses — including from heat.
Unfortunately, in the graphs above, the percentages aren’t on the same scale. The one on the left runs from 0% to 100%, while the one on the left only goes from 0% to 40% over the same distance. This means, at a casual glance, the bad day doesn’t look nearly as bad as it should be compared to the almost perfect day. If I squish down the bad day so the percentages are on the same scale it looks like this:
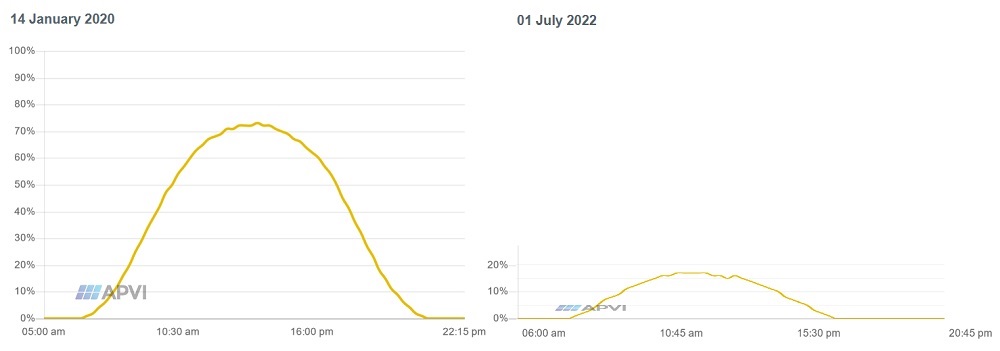
This makes it much easier to see the difference between an extremely high output day and an extremely low output one. Now the area under the curves is proportional — more or less — to the amount of solar energy generated. To make comparisons easier, I’m going to adjust graphs that are next to each other so they are on the same scale. If you don’t like the way they look, blame me and not the APVI.
I’m afraid you’ll have to use your eyeballs to compare the graphs. I’m not paid enough to use calculus to determine the area under the curves. I’m also not smart enough to do that, which probably goes a long way towards explaining my level of remuneration. Fortunately, while my maths isn’t too hot, my vocabulary is Brobdingnagian.
States Vs. Capitals
The APVI graphs I’ve used show estimated solar output as a percentage of its maximum capacity in each state, but I’m going to be looking at days of extreme temperatures in state capitals. This isn’t a serious problem because rooftop solar tends to be concentrated in and around capital cities and because when a state capital is hot, the entire state tends to be hot. My goal is to show solar energy output still tends to be high on extremely hot days, so this simple approach should be fine.
Adelaide
There was a day of exceptionally high solar output in Adelaide on December 23rd 2018. It was also three seconds short of being the longest day of the year. On this day, the temperature reached 29.4°. One month later, Adelaide had its hottest day this century on January 24th 2019, when it hit 46.6°. While solar output on the extreme temperature day wasn’t as high as the almost perfect day, the graphs below show it was still high:
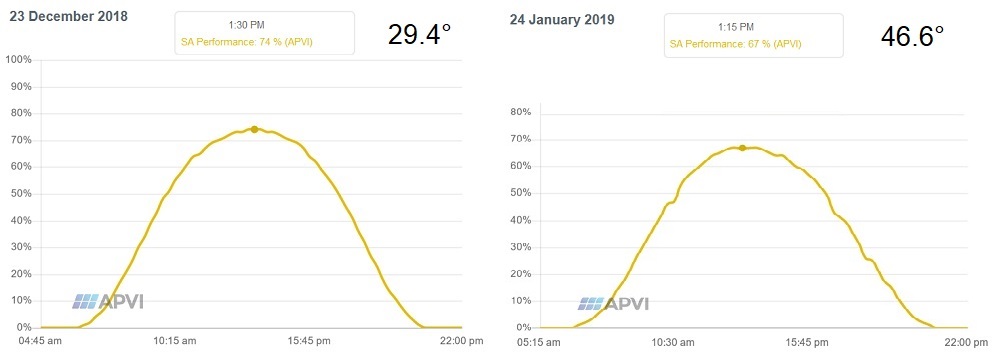
Temperature wasn’t the only difference between the two days. For example, day length on January 24th was 3.2% less. But even if all the difference was due to it being 17.2° hotter, it shows that extreme heat did not cause a major reduction in solar energy output. It remained well above average.
January 2019 was an exceptional month for rooftop solar generation, with zero rainfall occurring in Adelaide. This was the first dry January in 62 years. But despite no rain and little cloud cover, January 2019 still had days that looked like this:
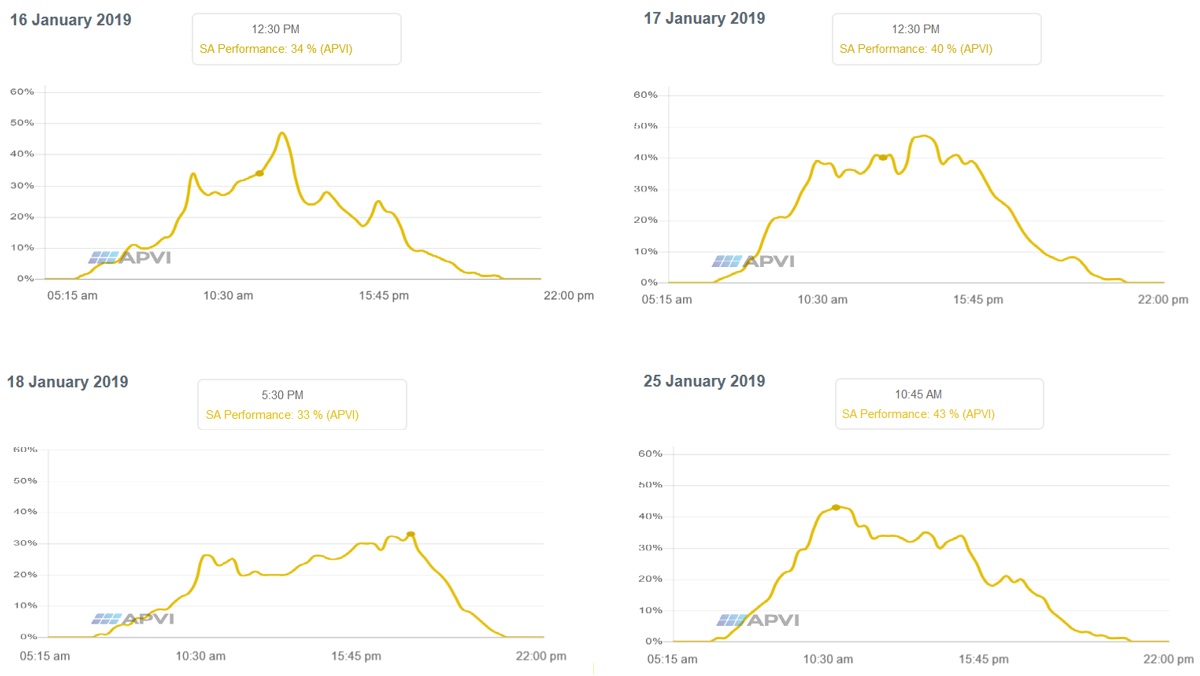
So, while solar output on the 24th of January was less than perfect, the lack of cloud cover that goes hand-in-hand with extremely high temperatures meant output was still good.
State Capitals & Record Temperatures
I’ve put graphs comparing days of near-perfect solar output with days of record-breaking for all state capitals below.
Brisbane
Brisbane’s hottest day this century was November 28th 2018, when it reached 36.5°. Unfortunately, the APVI graph refuses to display this date correctly, so I will use the 2nd hottest day in the past 10 years, which was September 29th 2017. On this day, the temperature reached 34.9°. It may seem strange that Brisbane often has its hottest days in spring, but this is because heavier cloud cover in summer usually prevents extremely high temperatures. Although it still gets awfully hot and humid.
September 16th 2019 was a day of close to perfect solar generation that occurred at around the same time of year. Its graph of APVI rooftop solar output is on the left below, with September 29th 2017 beside it on the right:
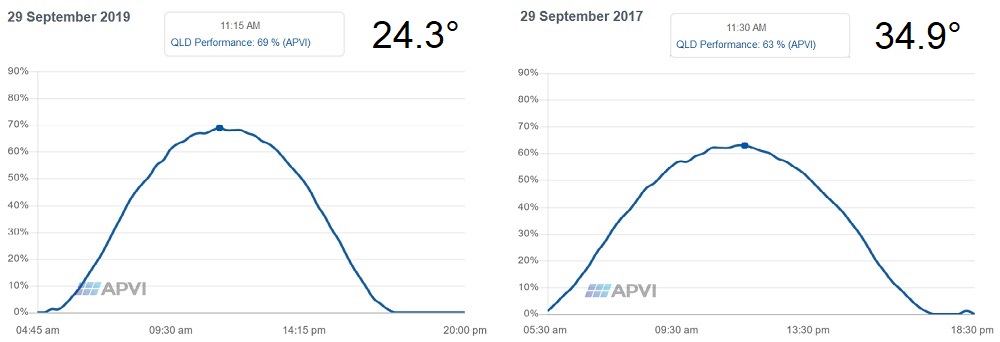
While not as good as the cooler high-performance day, even on a day of extremely high temperatures solar electricity output was strong1.
Darwin
Darwin’s hottest day this century — and maybe the previous one as well — was on October 21st 2019. The mercury hit 38.2 degrees.
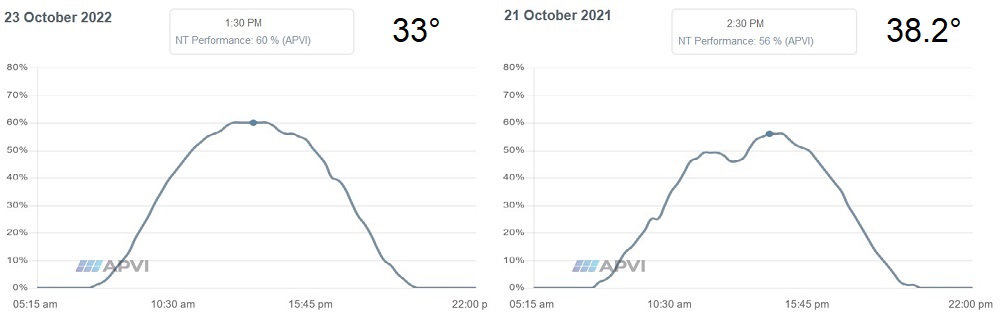
Despite some cloud putting a dent in output in the early afternoon, output was fairly close to the near-perfect day. Because of Darwin’s constant high temperatures, there was only around 5°C difference between the two days and if there was no cloud they’d probably be almost identical.
Hobart
Hobart’s hottest day in the last eight years was January 31st 2020. On that day Australia’s coldest capital hit 41°C. Less than two weeks earlier, they had an awesome day for solar output on January 20th.
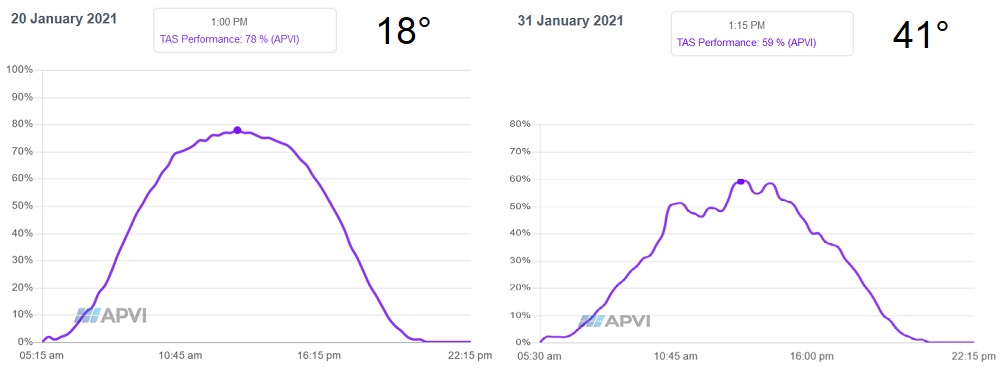
The near-perfect day had high output thanks to clear skies and a low maximum temperature for January of only 18°. The 41° day did not do as well, thanks to some cloud cover. Despite this, output per kilowatt was still around two-thirds of the 20th. While it performed worse on its extreme temperature day than any other state capital, this result was still above average for Hobart, which has many cloudy days.
Melbourne
One of the hottest Melbourne days in recent years was January 25th 2019, when the temperature reached 45°C. A day of near-perfect solar output at around the same time of year occurred on the 4th of February one year later.
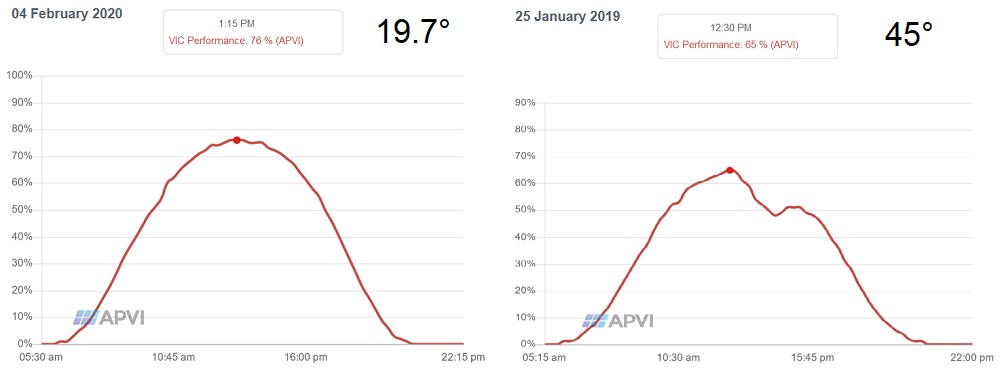
Cloud took a piece out of production in the early afternoon, but the output was still well above average on the 45°C day.
Perth
Perth’s hottest day over the past five years was on December 26th 2021 when the mercury hit 43°C. One year before that, there was an almost perfect solar output day on December 27th 2020.
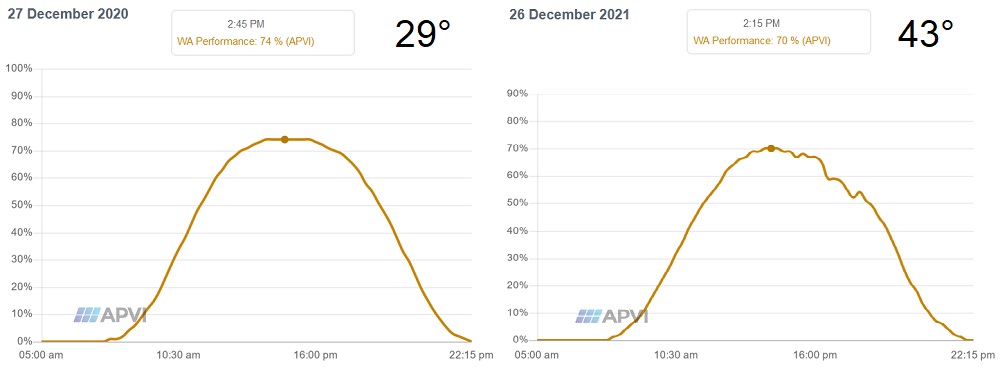
Despite a mild afternoon squiggle, output was still fairly similar to the near-perfect day.
Sydney
Central Sydney’s highest recorded temperature was 45.8ºC on January 18th 2013. This is a little far back to get an idea of how modern rooftop solar performs in the heat, so I’ll use a more recent high of 43ºC on January 7th 2018. A day of near-perfect solar output occurred at around the same time of year on January 16th 2021.
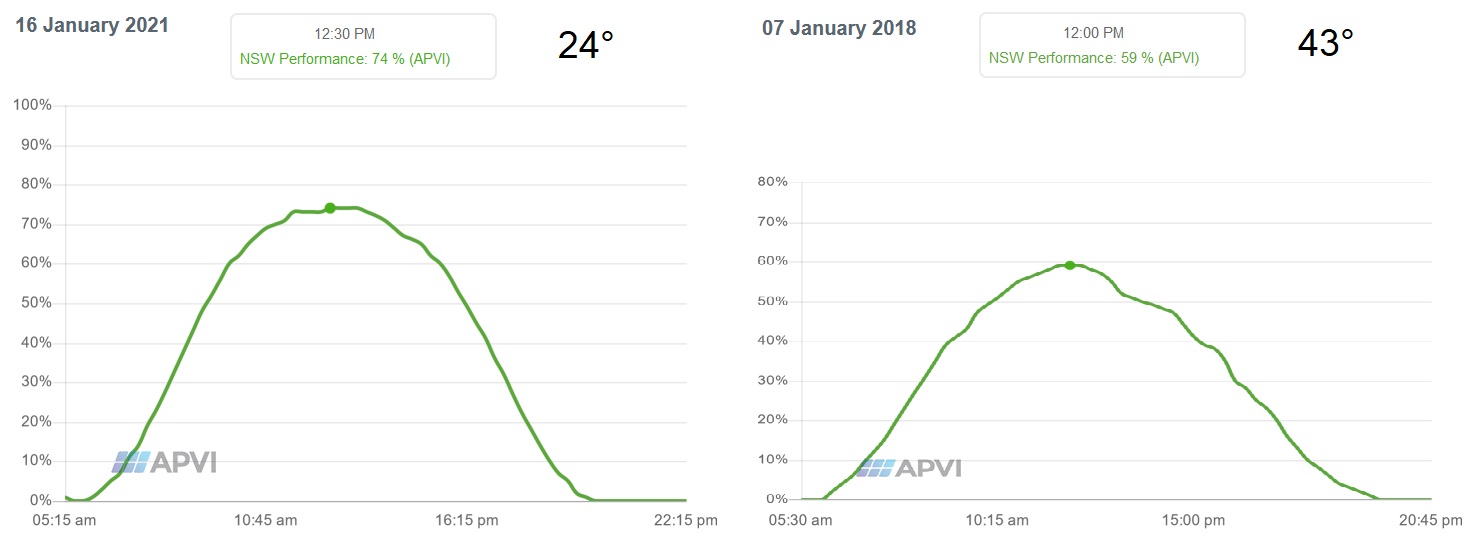
While falling short of the near-perfect day, solar still had above-average output on a 43° Sydney day.
Solar Panel Heat Resistance Will Improve
A modern solar panel will lose around 0.37% of output per 1°C increase in temperature, but five years ago, it was around 0.39%. While not a huge change, they are improving. If there are no major advances in solar panel technology, I’d expect the typical panel’s ability to resist heat to gradually approach that of the best currently on the market: an efficiency loss of under 0.3% per 1°C temperature increase.
In fact, I am confident that solar panel efficiency loss on high-temperature days will be even less of a problem than it currently isn’t.
Footnotes
- Note that, despite occurring on exactly the same day of the year, the APVI graph decided to slightly stretch out the time period of the 2017 graph on the right, making it look fatter in comparison to the other one than it should be. Their width should be equal. ↩
 RSS - Posts


Ron this is very interesting as I had always thought that the losses would be much greater as the actual panel temperatures are much higher than the ambient temperature. It appears from your test numbers that the manufacturers work on ambient temperature and not the actual panel temperature. ?
This article goes into detail on the two measurements used by panel manufacturers:
https://www.solarquotes.com.au/blog/solar-panels-temperature/
Note panels have gotten a little better at resisting heat since it was written.
Note the examples I give in the article are relative. The typical panel at 60 degrees Celsius will have an output about 13% lower than one at 25 degrees, but such a large difference in temperature rarely is unlikely to occur when all else is roughly equal. A 20 degree difference between a cool summer day and a heatwave summer day is not uncommon and all else may be roughly equal.
“This is because our hottest days … usually have the most sunshine. ”
Ron, I’m no expert but I think it goes the other way ’round!
I’ve also noticed that we get more solar output on sunny, windy days in summer, because the panels are cooler.
We’re at the low ebb here in Alberta, with 64.53 KWh from 10 KWh of panels so far this *month*. It’ll be that much nearly every *day* come July, and we surely won’t be wishing the panels were covered in snow and ice.
On the whole, I’d much rather have sunny and hot together, than a temperature + wind chill that’s 30 degrees colder than our freezer and a grey sky that wouldn’t let a Boy Scout find north at high noon. But it’s not a damp cold, I’ve heard that’s awful.
Thanks for the article, I really appreciate all the recipe of science and math mixed with humour and relatable stories, keep up the good work!
I measured up to 70degrC in spanish summer, and those panels had a decent angle .
lower agle, almost flat `placed panels have less air circulation, and that can be worse. so aircirculation is an impacting factor.
Are there panels with water jackets to cool the panel and heat a pool for example, and reduce the losses?
I am aware of two manufacturers one French that uses a polymer based plumbing system on the back of the panels and the other Turkish who use copper construction for the cooling part of the panel. Warranties are noticeably lower than standard panels and of course only low grade heat is available if you want to get peak panel electrical output. I looked at them and you could easily end up with a very warm pool in the Australian summer with all the associated biological hazards. Couple the preceding with the additional cost of plumbing, circulating pump and associated switchgear and thermostats and putting up a few more standard panels is a clear winner in almost all cases
I’ve been interested in hybrid heat + electricity solar panels in combination with a heat pump.
It sounds like I’m better off with a separate solar heat collector, and / or just filling the roof with solar PV and using whatever electric hot water heater makes the most economic sense.
It seems there’s no end of ideas that can work in theory, but aren’t economical.
The temperatures you are using are measured in the shade. Panel temperatures will be much higher even for the cooler days. Windy days will cool the panels even on hot days, so you need to make sure you are taking that into account when trying to compare days without using a direct measure of the panel temperatures.