

By Dr. Nick Engerer
Note from Finn: This is a guest post by Dr Nick Engerer – Solcast is a super handy, free, quick and accurate way to check what your solar power system should have produced in the last 7 days.
Hello loyal SolarQuotes blog followers, and solar enthusiasts everywhere!
Last week, your intrepid leader in all things solar, Finn, posted an excellent blog about checking in on the performance of your home solar PV system. Amongst the several different methods he suggested, my company, Solcast made an appearance in the 3-minute Solcast method section of the post. In response, my team at Solcast received an influx of traffic, including sign-ups to our API service by a host of eager solar owners wanting to know the answer to the question: “is my solar PV system performing as expected?”
But at the same time that blog went live, so did a brand new Solcast website. Needless to say, that left a few of you quite confused! Not only were most of you folks not able to find the solar forecast map demonstration hosted on our homepage, but many of you were left wandering around our website, looking for answers!
Please accept my humble apologies for your confusion and angst! Id like to make it up to you, by showing you how you can use our data to complete the calculation you’re interested in. But first, a little background on Solcast, and what we’re trying to do (this will give you some clarity on why your user journey through our webpage was so confusing).
Solcast’s Mission
At Solcast, our mission is deploying the data and tools needed to build the solar powered future. Our technology is aimed at electricity network operators, solar farm owners, software developers and engineers, who are dealing with the massive amounts of solar being installed all across the world. We are making the data they need for planning, building and operating solar facilities easy to access and assess, by taking care of the big data problems that weather satellites and numerical weather models produce and delivering them useful information via an Application Programming Interface (API).
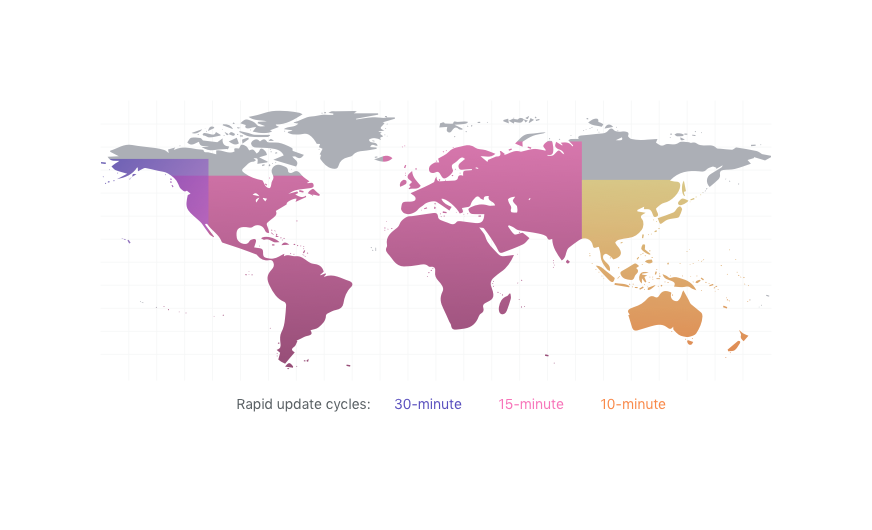
Solcast assimilates 30-40GB of satellite imagery data each day from a fleet of five high-resolution weather satellites, which provide new imagery of the Earth’s surface and its cloud cover every 10-15 minutes, at 1-2km2spatial resolution. We make the effort to track the actual locations and estimate the characteristics of cloud cover in real-time, over every continent except Antarctica. At any given time, we know where all of the clouds near your home solar array are, how thick they are with respect to sunlight, and then forecast where they’ll move next, by leveraging wind velocity data from high-resolution weather models. We do this all over the world, updating our data every 10-15 minutes, producing 600 million forecasts every hour!
But it’s not just forecasting data that we can offer, we also produce Estimated Actuals data, which are historical estimates of how much solar radiation or solar power should have been available, based on the satellite images. The Estimated Actuals data, is what you’ll be using today in our example.
How Solcast’s data can enable you
Now, I’ll spare you too many details about the technology we use, as you can find plenty of detail on the How it Works part of our webpage. What I need to do, is fulfill my promise to help you figure out how to use our data, in a way that enables you. This time, to investigate if your solar PV array is performing as expected.
To do this, you’ll need basic competency with maths, and access to a calculator (with bonus tips for a way to do the required calculations in Excel). I’ll make this a step-by-step process for those of you brave enough to venture onwards! Alright, here goes.
Step 1: Sign up for the Solcast API
Several of you have already done this, lucky you! For those of you that haven’t, don’t worry; it is free for hobbyists and researchers and we’ll lump all of you into that category. Registration is fast, easy and takes just a few minutes.
http://solcast.com.au/register
You’ll then need to click on a confirmation email link in your inbox, be sure to check your junk mail filter if you don’t receive this in a few minutes!
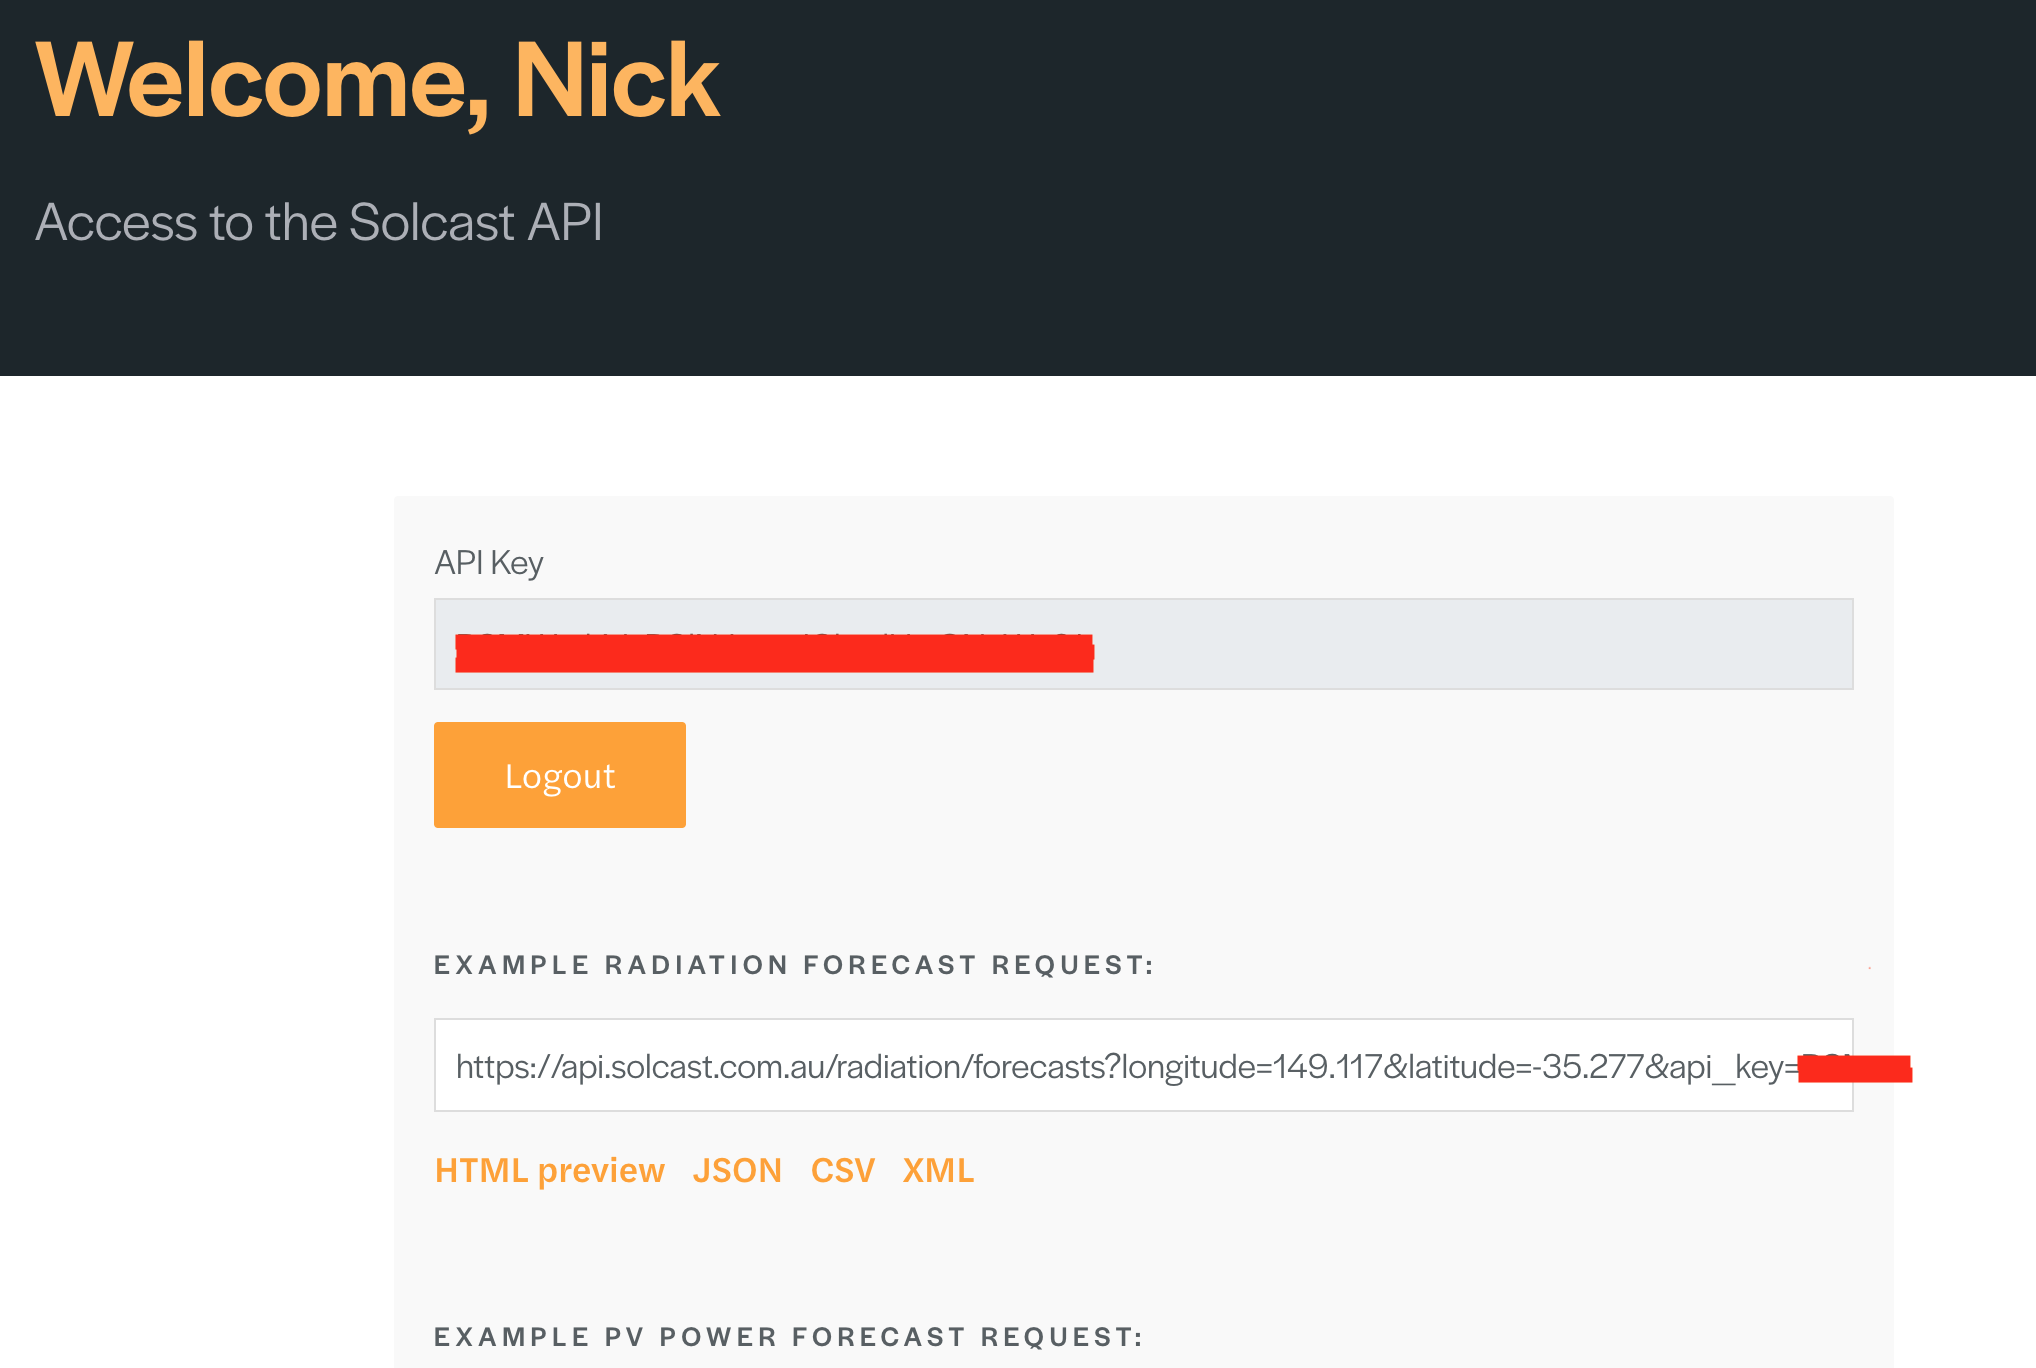
Step 2: Go to your API account page
Navigate to the following link, making sure you are logged into the Solcast webpage:
https://solcast.com.au/solar-data-api/account/
If you have any trouble with this, you may need to reset your password via the login page that appears when you navigate to the above link. Also, you’ll see an API key at the top of the page. Be sure to keep that key private (don’t share it with your mates). you’ll notice I’ve covered my API key up in the included images in this post.
Step 3: Collect the basic information about your PV system
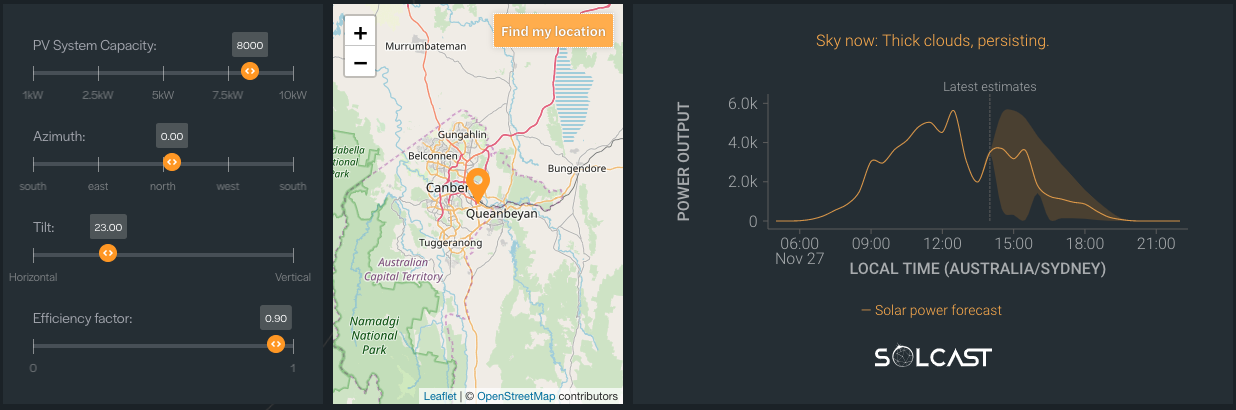
To proceed, you’re going to need to know your PV array capacity (kW), the direction it points (its azimuth), an estimate of its tilt (most PV systems are mounted between 15-25º from horizontal).
The capacity of your PV system is the total Wattage of solar panels installed, or its DC rating. If you have a 3.4 kW PV system, this value would be 3400W (1kW = 1000 Watts). You can use your inverter rating as well, to make things easy, but the actual installed capacity of the solar panels is best.
I promised to make this easy, so here is a cheat sheet for the azimuth of your PV systems
How to enter the Azimuth value in the Solcast API
If your PV system points NNE (between North and Northeast), just split the difference between 0 and -45, giving you -22.5, for example.
If your PV system is a split array, take the average azimuth of your entire PV system. For example, if you have one section pointed East and another to the North, use the value of Northeast (-45).
The tilt of your PV system is measured from horizontal. A flat PV system has a tilt of 0, a vertical PV system has a tilt of 90. It is hard to measure this, so just eyeball it with your best guess.
Lastly, you’ll also want to know your location by latitude and longitude to within about 3 decimal places. (e.g. Canberra is -35.2809, 149.1300). Locations in the northern hemisphere are positive latitude values. Southern hemisphere locations are negative latitude values. Positive longitude is east of the prime meridian, while negative longitude is west of the prime meridian (the prime meridian runs through the UK, if that helps!). (Hint: Australia has positive values of longitude, and negative values of latitude)
Further details about each of these parameters are available on the Rooftop Solar API webpage here.
Step 4: Download some data!
Solcast provides Estimated Actuals, as I mentioned before these are historical data, created through use of satellite images. Our Estimated Actuals are an estimate of how a PV system should have performed over the past 7 days. For this use case, were just going to fetch the data from yesterday, for reasons you’ll see in the next steps.
OK, here is the trickiest bit. you’ll have to make sure that you are careful with entering the required data into the following URL (this is how APIs work).
Here is an *example* URL (what you enter at the top of your web browser while logged in) for a 1kW PV system, in Canberra, with a Northeast azimuth (-45) and 23 degree tilt:
https://api.solcast.com.au/pv_power/estimated_actuals?longitude=149.1300&latitude=-35.2809&capacity=1000&azimuth=-45&tilt=23
As long as I am logged in and haven’t made any mistakes with the API URL request, I will be able to see a page like this one appear:
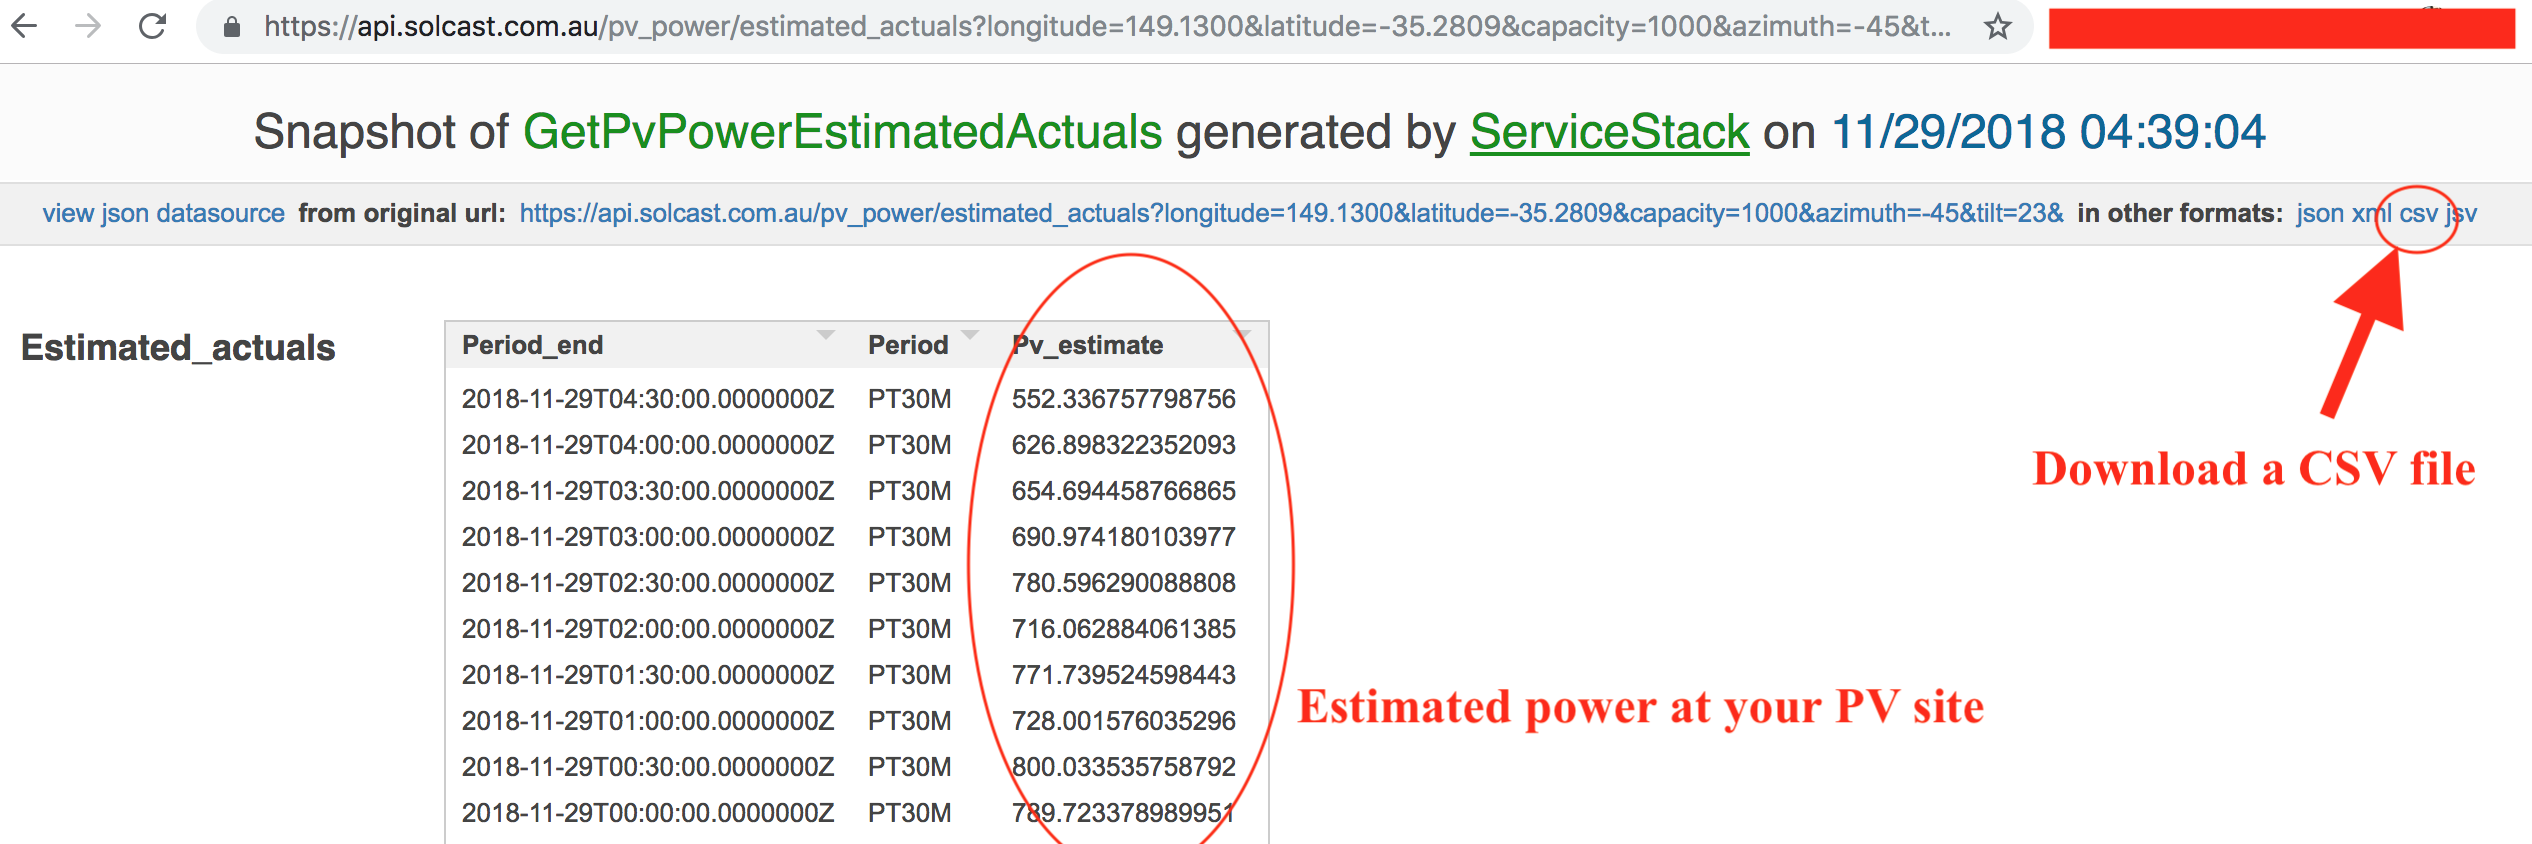
What you need to do is put your own latitude, longitude, capacity, azimuth and tilt into the URL, just after the = sign. Be careful to correctly insert any negative symbols – and to not remove any of the & symbols. If you make a mistake, just start over. It will work, I promise!
Once you have the webpage displaying data, you need to click on the .csv link in the top right (see picture). This will download some Estimated Actuals data for your solar PV site! Then we are onto the next step!
Step 5: Make a simple calculation on yesterday’s data
Your next task is to open the .csv file, which you can do with Excel or other tools like Google Sheets. If you have trouble getting this to work, Google around for some help. There are many articles, and even online tools, for opening a .csv file.
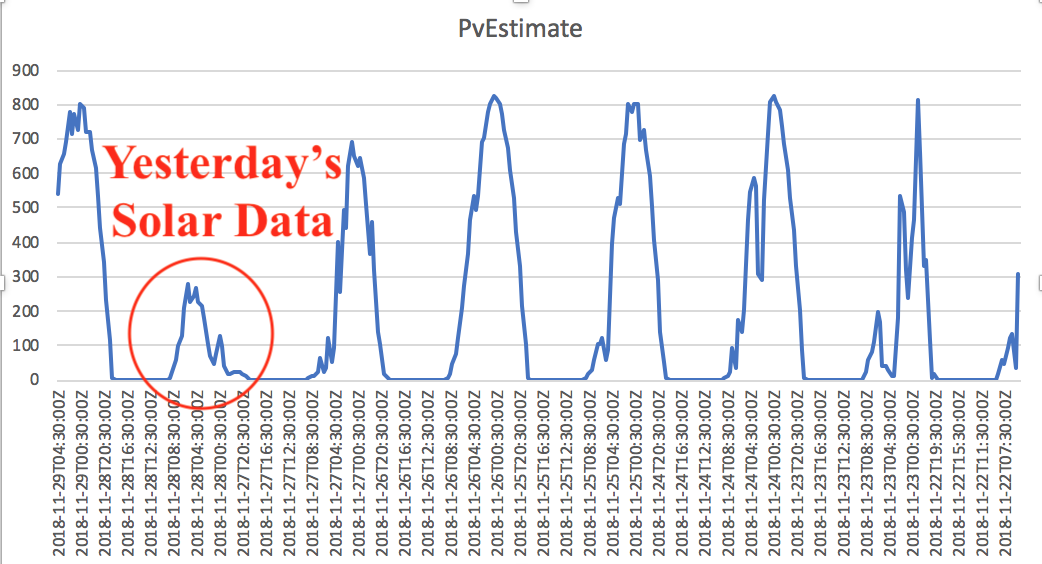
Scroll down until you see the data from yesterday. This will be the first set of data you see after a series of zeroes. The timestamps on the data are in UTC time, so don’t let that confuse you too much. You don’t actually need the timestamps. You just want to focus in on the data from yesterday. Our data is listed in reverse order, with the most recent data at the top and oldest at the bottom. In total, you will be provided with 7 days of historical data.
Our next task is to add up all the power output numbers in the third column of data for yesterday. To keep this simple (as promised) you can simply add them all up with a calculator. Then, you need to multiply the result by 0.5 (this converts the value from Watts to Watt-hours) and then divide by 1000 (to convert watt-hours to kilowatt-hours). The end result is the kilowatt-hours of solar generation from yesterday! You’ll recognise kilowatt-hours (kWh) from your home electricity bill. This is the unit of energy that you are charged for each month by your energy retailer.
If you’re a bit tech savvy, you can actually do this with an excel formula. (e.g. =SUM(..) formula. Here is a screenshot of the process.
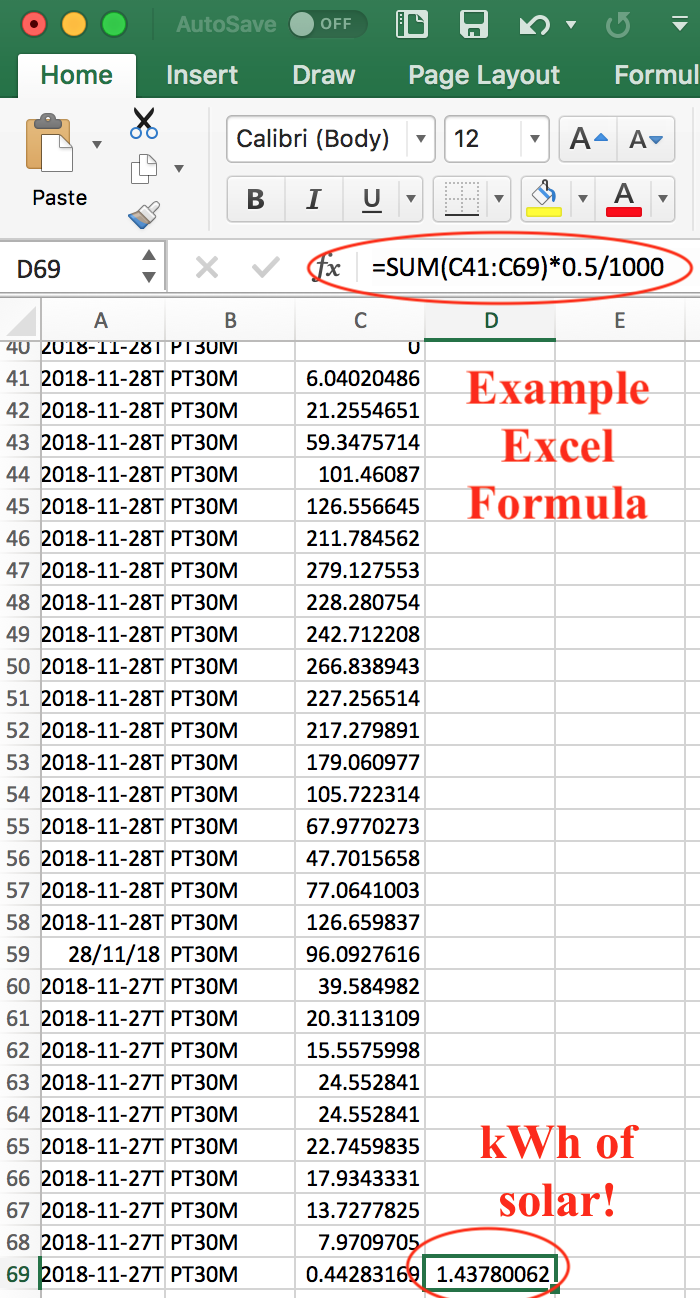
With the data I used for this example, yesterday was 28 November, which was quite a cloudy day in Canberra (with record rainfalls in Sydney!). My theoretical 1kW PV system in Canberra only produced 1.43 kWh over the daytime period, which is fairly low. But was this low value a problem? Probably not, because by using Solcast, we have knowledge of the cloud cover from that day (very cloudy), so we can know that energy yield should have been relatively low.
Pro tip: You can add &loss_factor= to your API request to simulate this. A value of 1 equals perfect performance, a value of 0.95 would mean there is 5% loss. Values of 0-1 are accepted.
Should be updated to:
Step 6: Look at your solar inverter to find yesterday’s generation
Nearly all solar inverters will report the total generation from yesterday in kWh. Those that don’t make this possible, will also report the generation of the current day onscreen. There are far too many examples to walk through how to do this here, but if you’ve made it this far, I’m sure you can figure it out! You may have to adjust my instructions to look at today’s data in the Solcast API and the inverter data, by perhaps undergoing this exercise in the evening after the sun has gone down.
If you’ve had success in using the Solcast data to compare it to your inverter, why not share your own tips in the comments below? That will make sure everyone can have a fair go at accessing the Solcast data successfully.
As far as assessing the numbers you find, I’ll leave that to the solar experts at SolarQuotes, including the recent blog post that prompted this discussion. In general, there will be 1-2% degradation of solar panels each year, so if your solar PV system is 5 years old, you can expect the total energy yield to be 5-10% lower than our API reported. Other impacts such as shading are also important to consider. This simplified approach won’t handle losses for you, so you may have to do some additional corrections. If you have ideas, be sure to share them in the comments below.
Pro-tip: You can add &loss_factor= to your API request to simulate this. A value of 1 equals perfect performance, a value of 0.95 would mean there is 5% loss. Values of 0-1 are accepted.
Hey, this is great! How can you repay us? I’m so glad you asked!
As I mentioned earlier, the Solcast API service is aimed at those folks working to deploy and manage the solar-powered future. We look to enable solar farm operators, software developers, power system engineers and even energy market operators with the solar forecasting data they require to integrate the large volumes of solar now being installed across the world.
In fact, one of the best things about the Solcast API, is that you can perform the calculations I shared here, anywhere in the world because we offer global coverage. That means you can share this idea with your mates, wherever they are, and they can have a go as well.
 We make this data free to hobbyists and solar enthusiasts such as yourself, as a part of company philosophy of enablement. You can repay us by sharing this blog post, or some links to the Solcast homepage ( http://solcast.com.au ) on your favourite social media account. This helps us generate awareness of these tools more broadly, and enables us to keep this service free. We’d appreciate your help with spreading the word about our mission (deploying data and tools to build the solar future).
I hope this article will help to enable all SolarQuotes readers to have a go with the Solcast data, and hopefully, lead to a more positive experience for you! Feel free to send me questions on Twitter!
Peace, Love and Solar
Dr. Nick Engerer
About the Author
 Dr. Nick Engerer is the CTO of Solcast. He is an expert in the field of solar radiation modelling and forecasting, and has co-founded Solcast out of a desire to enable others to build the solar-powered future. Nick displays an unusual level of passion for developing applied research projects and collaborating with industry to make BIG ideas a reality. Follow him on Twitter @nickengerer. For more information, visit http://solcast.com.au
 RSS - Posts


Thanks, this is very helpful. But one question: can these calculations cope with load limiting? Eg, my system is 9.9kw but limited to max of 8.2
Thanks again for making this available (although I am still struggling with the arithmetic).
You say its hard to measure the tilt of the panels. Maybe i am missing something but i think its easy and that all you need is tape measure, a spirit level and the inverse tan function on a calculator or EXCEL
I have a few questions. Can you confirm my understanding.
Yes, you can do this in the way you’ve described. You are just much more ambitious than I am to climb a ladder 🙂
I am happy to answer your questions, what are they?
……….. or get hold of one of ye olde (wooden) protractors and do the job in about three seconds. But even that wouldn’t work, since the angles would need to be adjusted endlessly ~ and by the second if t was to be done properly.
NONE of the above arithmetic (computerised spread-sheets or wise cogitations) alter the REALITY that anything to do with this topic is a guesstimate at best ~ and one that changes by the second, not to mention by the day, the month and the year …. and NEVER in any linear ‘calcuable’/predictable way.
Everything from the ever-changing position of the sun (in at least three planes), the position of each vagrant cloud and puff of wind/variable-temperature Including that in cables/components,….. and flocks of pooping parrots etc. etc. etc.. would need to be factored in…….Except that all the variables occur at random throughout the day, month, solar (as opposed to calendar year, and CANNOT be factored in.
The solution, as always, is the SIAS* principle. …. and careful observation —> If the icecream in the fridge melts you need to adjust the angles/directions of the panels (particularly those sited facing South to cover all possible permutations); install a 4-directional solar-tracker (or train the missus ~ but make sure she’s wearing sunglasses); get lots more (very-cheap) panels and point them anywhere you like; make sure the fridge is plugged in…. or learn to like runny icecream.
Whatever methodology you decide upon, enjoy the thought that you can get great pleasure from diddling with your calculations until the sun burns out ~ and for a while after that, just to check the comparisons.
* Suck It And See
Disclaimer’ :- Past performance is not an indicator of future outcomes.’
Hi,
I plugged in my details……
According to the Solcast figures, my system should have produced 30.9kWh for 3/12/2018
My actual figure according to the Tesla Powerwall app was 30.3kWh.
So, it’s pretty close! Variations could have been due to subtle temperatures and cloud cover specific to my location (and probably performance factors of the inverters and solar panels as well).
I will keep a watch over a month or so to see how it good it is.
Regards,
Graham
Made a mistake… I put the wrong azimuth figure in (it was -ve and should have been +ve).
It now calculated the expected production at 30.5kWh….. even closer to my 30.3kWh reported!
Regards,
Graham
Graham, not bad! Great to see the excellent match-up and successful maths!
Considering that my solar PV system is about 7.5 years old. I’d say it’s doing well.
What panels/inverter have you got Graham?
Hi Finn,
2 solar systems
Eversolar Inverter, no idea of the panels’s brand. (came with the house)
ABB Inverter, Phono panels. I added these to the first solar system.
Cheers,
Graham
When Nick says it is hard to measure the panel tilt I guess that is for panels on an inaccessible roof. Mine are on a shed that I can virtually walk onto- tho’ I have stopped the kangaroos from hopping on!
The simplest way to measure tilt angle is with a protractor and spirit level- If you haven’t got a protractor just ask a schoolkid or go to a newsagent.
I take a photograph and draw a triangle on it and then pretend I am testing a child on a geometry problem and go with whatever answer they tell me.
You are savvy, sounds like a great way to calculate it!
Quite right! …..except that the sun’s elevation changes unceasingly.
Ask any Nautical Almanac. (the US navy publishes a beauty: it even makes the point that the sun DOESN’T rise in the East and set in the West!
For what it’s worth, here’s a spreadsheet whichgenerates a link for your data.
https://docs.google.com/spreadsheets/d/1p9F0es_cAlRMXsQhICa0TXJKAkek8Pyu_X3R-T56YKQ/edit?usp=sharing
The spreadsheet also generates a Google Maps link to double check your coordinates.
With a bit more manipulation, it may be possible to write a script to suck the data from the website and log it onto a separate worksheet.
What a bloke! This looks great @John. I hope other folks can use it.
For my location in the Adelaide Hills, these are the results over the last 6 days:
Date / Enphase measured kWh / Solcast estimated kWh
03-12-2018 / 29.9 / 30.7
02-12-2018 / 37.3 / 37.4
01-12-2018 / 31.8 / 28.6
30-11-2018 / 49.2 / 49.2
29-11-2018 / 46.4 / 46.0
28-11-2018 / 28.6 / 27.6
Given the variables, that is very good agreement. The worst daily match (01-12-2018) occurred on a day when a major weather change occurred about midday (lots of sun in the AM, low and variable in the PM).
Thank you Nick for making this freely available. Good luck to you and your company.
Your figures indicate a high precision estimate Doug!
Nick, do you take air temperature and other environmental factors into account when making the calculation?
John,
Yes we do include the air temperature in the PV power model. This will make the energy generation go down with extreme temperatures.
Doug,
Those results do look quite good! Did you use the loss factor parameter at all?
Yes, I was pleased with the comparisons. Without the outlier data point, the Solcast estimates are ±0-3% of the Enphase measured data (which themselves are ±0.5%).
No, I didn’t use a loss factor. Perhaps I should have, because 16 of my 28 panels are almost 4 years old, and the remaining 12 are almost 1 yr old. But I thought it was a bit dodgy trying to work out a loss factor, and just went ahead without it. Perhaps I will go back and check the comparison with a loss factor.
I have applied a loss factor to the Solcast estimates for my system. Using my Jinko panel specsheets, I calculate a bulk loss factor of 0.9664 (16 panels at 4 years old are estimated to yield 0.96% output, and 12 panels at 1 yr old yield 0.975% output).
If I apply a loss factor of 0.9664 to the data I provided in my post above, we have:
Date / Enphase measured kWh / Solcast kWh with LF=0.9664 / Sol-En kWh
03-12-2018 / 29.9 / 29.7 / -0.2
02-12-2018 / 37.3 / 36.1 / -1.2
01-12-2018 / 31.8 / 27.6 / -4.2
30-11-2018 / 49.2 / 47.5 / -1.7
29-11-2018 / 46.4 / 44.5 / -1.9
28-11-2018 / 28.6 / 26.7 / -1.9
Overall the results are worse than with no loss factor – ie the Solcast estimates differ more from the Enphase measured data and are consistently lower. One interpretation is that the Jinko panels are working at higher ouptput than their specsheet output loss with time (ie working better than warranted). Further, my panels receive minor shading in the early AM and late PM, so their output would be even higher without the minor shading.
It likely that the loss factor will vary between panel types. I will continue to monitor this.
Great detective work mate! Thanks for sharing.
The solcast data seems to be consistently about 4kWh under my actuals. Would altitude account for this difference?
Linda
That is a big difference. I’d say its possible the URL you used to request the data may have had a small mistake.
Double check it with @John’s spreadsheet:
https://docs.google.com/spreadsheets/d/1p9F0es_cAlRMXsQhICa0TXJKAkek8Pyu_X3R-T56YKQ/edit?_ga=2.201288937.616465525.1543884108-877664499.1543460685#gid=0
And get back to us! Feel free to share some PV system details to help us troubleshoot.
Nick,
The URL looks fine. Here it is (without the API key):
https://api.solcast.com.au/pv_power/estimated_actuals?longitude=151.443&latitude=-30.771&capacity=7420&azimuth=0&tilt=15
The system has 4240W North, 1590W East, 1590W West (E&W are on a single string). As the API doesn’t allow for this, I just put them in as North. I would have thought that this would give a higher value than my actuals.
The actuals are based on both the Fronius portal and PVOutput.
Linda
In this case, you should try splitting the API call into 3x different URLs and adding up the resulting data!
e.g.
https://api.solcast.com.au/pv_power/estimated_actuals?longitude=151.443&latitude=-30.771&capacity=4240&azimuth=0&tilt=15
https://api.solcast.com.au/pv_power/estimated_actuals?longitude=151.443&latitude=-30.771&capacity=1590&azimuth=-90&tilt=15
https://api.solcast.com.au/pv_power/estimated_actuals?longitude=151.443&latitude=-30.771&capacity=1590&azimuth=90&tilt=15
Let us know what you find!
Linda, also, I notice that you are seeing estimates lower than the actuals; this is likely because the default loss facto is 0.9 (10% loss), but your system seems to be working fairly efficiently! Try adding the “&loss_factor=” variable, perhaps with a value of 0.95 (5% loss)
Oh, default loss factor = 0.9. That is new knowledge, and important to know. I previously assumed default would be 1. So, my previous comparisons (and possibly some others) need revision.
When I signed up I didn’t quite understand how to use it but now I get the idea. Thanks for the explanation. I think a simplified input form to generate the url would help.
When I compared yesterday’s estimate with actual I got 100.0% agreement and thought, whoa, that’s amazing! But of course it’s always worth checking more than one sample, so here’s my last six whole days (kWh):
Estimate Actual Actual:Estimate ratio
55.53 55.56 100.0%
57.40 62.51 108.9%
56.32 58.98 104.7%
67.64 69.01 102.0%
60.64 62.79 103.5%
63.39 61.75 97.4%
I put in lat/long to 4 decimal places, had to enter a weighted average for azimuth of 0 degrees (3/4 NNE, 1/4 WNW), and estimated roof tilt at 22 degrees.
That’s an average of Actual / Estimate of 102.8%, SD of 4.0%
Roof tilt won’t be hard to check. My iPhone has a tilt measurement built in. Plus I can’t image being wrong by a few degrees on tilt would make a big difference (trig error would not be large).
e.g. if I drop roof tilt down from 22 to 20 degrees I get average actual to estimate ratio of 101.4%, SD 4.0%. So that confirms that. 10% drop in tilt change estimate by ~1%
It’s a fair spread. It’s been variable cloud cover this past week so I can imagine it’d be hard to be on the money all the time.
I’ll do a plot at some stage and compare with actual production, see what the correlation looks like, perhaps even do a residuals plot.
Alex,
I totally agree that a simplification would be useful, and given the keenness of everyone involved here, I’m certainly considering it!
I notice that you are seeing estimates lower than the actuals; this is likely because the default loss facto is 0.9 (10% loss), but your system seems to be working fairly efficiently!
We’d love to see more results, including plots!
Thanks Nick
Yes it’s a fairly new system. I’ve set up my own url generator with options for all the input factors.
Since I can’t retrospectively generate a forecast with update loss factor to modify the one I did early today, I’ll leave that one as is for the comparison to actuals.
If I really got funky I could probably get Excel to make the API call with a bit of Excel VB code to pull both Solcast and PVOutput data to do comparisons.
Cheers
Alex
I have now done a comparison on the Solcast Estimate with my system’s actual output:
7 day chart showing 30-minute average power:
https://i.imgur.com/n5al6sV.png
And here’s the same data plotting the difference (Actual Output less Solcast Estimate):
https://i.imgur.com/tCKIXAA.png
This looks so very much like the comparison of different cycling power meters (something I’m very familiar with) it’s not funny!!
A Correlation Coefficient of 0.985. That’s impressive.
A few comments:
i. The Solcast estimate correctly indicates when cloud cover is having an impact, which is good. The scale of that impact varies a little with actual but it’s pretty good on average.
ii. The estimate assumes a weighted average azimuth while the split azimuth of my panels makes for a slightly different power curve over the day – see the nice clean sunny day on 1 December where my power curve is wider than a pure north facing azimuth would be. My weighted average is N, while I have 3/4 of my panels facing NNE and 1/4 WNW.
I suppose one way to deal with that is to generate a separate Solcast estimates for each group of panels and then sum those together.
The Solcast estimates appear a bit dampened compared with actual.
I still need to validate my roof tilt value but it won’t affect the data all that much, certainly the correlation will not change. What might change a little is generating separate estimates for each azimuth group.
Interesting tool. However if I were to use it for checking changes with system performance over the years, I think you’d want to compare data from a decent length of time (e.g. several weeks) and choose data from the same time of year.
Alex
Thanks for sharing the plots, very cool! We are glad you were impressed!
Been playing a bit more and used the Solcast site to create forecast for my Solar PV power output for today. Here’s the plot of the forecast:
https://i.imgur.com/4oOL4Mp.png
The forecast was created at 6:05am this morning.
It’s predicting a total of 48.0kWh for the day.
It’s cloudy this morning and raining, so it will be interesting to see how the forecast stacks up with actual data for the day.
I’ll report back with a comparison to actual output data.
Thanks for the instructions! I ran this on my 12mth old solar system (LG panels, enphase microinverters). It produced between 3 and 9% more than predicted by Solcast on 6 of the 7 days – so pretty close. On the other day – the cloudiest of the lot – my system produced 35% more than predicted! So perhaps my system over-performs (in relative terms) in cloudy conditions or my house was less cloudy on average than the model predicted from the satellite images.
cheers
Trev
Trev,
Your results indicating actual production higher by ~3-9% than the Solcast estimate is consistent with Solcast using a default loss factor = 0.9 (see Nick’s post at 10.02am earlier today). Your results also are consistent with Alex Simmon’s results (Actual:Estimate >100%; see his post yesterday at 4.09pm).
So I think it is important that a loss factor should be included in the URL every time (unless you know your panels are operating with 10% loss!), especially if panels are new and performing well.
Nick,
It would be very helpful if the Solcast output included a header containing the input data, either as separate data (Lat, Long, PV(W), Azimuth, Tilt, and Loss Factor) or as the input URL.
This would provide confirmation of the conditions of each run.
Is this possible?
No sorry mate, that’s why we have API documentation pages. As matter of keeping our data payload consistent everywhere, we follow the protocol of only returning the data in the “Simple” PV power requests.
Future iterations of the API will include a GET request to see the PV system parameters as you’ve indicated.
Here’s the result of yesterday’s experiment:
https://i.imgur.com/a7Xvbru.png
Solcast Forecast: 49.0kWh
Actual Production: 45.7kWh (93.2% of forecast)
Prediction made at 6:04am
It was cloudy for most of the day, some rain early, and patches of sun poking through at times, hence the variability compared with the average forecasted.
I guess that’s not bad at a whole of day level but obviously the short duration variability isn’t something I’d imagine can be reliably predicted so many hours in advance.
I was using PVOutput to gather and monitor the actual data during the day – turned out to be trickier than expected to generate a rolling 30-min average power line as the data for some reason is not presented in even duration segments. Later today I’ll get a report direct from Solarweb which should have all 5-min segment data and I can validate the rolling 30-min average plotted here.
OK, that was fun – I’ve not personally a strong need for this as my system is domestic PV only, no storage. Perhaps when batteries make a bit more financial sense.
I can certainly see a “smart” battery system polling forecast data on a regular basis and making decisions about charging/discharging to optimise and balance performance, financial benefit and energy availability.
Alex, I am so pleased you followed up with this analysis.
You may not have noticed, but the forecast API is ‘rapid update’, which means that we update the forecast every 10 minutes as the cloud cover evolves over your location.
For a better forecast, you can GET the most recent API data, which even at 30-minute resolution, is updating every 10 minutes.
Hi Nick
Yes I was aware this was using a single early forecast only and not grabbing regularly updated forecasts. It was just curious to see how they day panned out on that basis. If I really wanted to apply it, eg if I was running a solar farm or had linked storage then I’d be looking to pull regular updates, perhaps apply a probability range that expands the further out the time from now is. But I’m not, just a home system and no storage either so no real need to go nuts 🙂
Cheers
Alex
Hi Nick,
Can you please describe how to download past 1year data using the api. I couldn’t find that on the documentation page. I could find only forecasts and estimated actuals on that page.
Thank you.