

If you bought a solar power system and your bills are still high, then either your system is not working or you haven’t considered the big picture of energy-efficiency, hot water heating and system size.
In this post you will discover:
- Why – if you want tiny bills – buying a solar power system is about more than buying a good system from a reputable installer.
- How to quickly estimate if any solar panel array is working well in 3 minutes, with or without monitoring.
- How to work out if your electricity retailer is billing you correctly or ripping you off.
- Just how hard-to-use most inverter manufacturer monitoring software is – and why you should always buy a good third party monitoring system such as Solar Analytics to go over the top.
- How following the 7 steps in my book – The Good Solar Guide – virtually guarantees tiny bills and no surprises.
- And how to read The Good Solar Guide for free.
So let’s get started shall we…
Here at SolarQuotes a small team of people spend lots of time answering questions people have about solar power. We recently received a support query from a Tasmanian gent named Steve who had bought a 3.6kW solar power system with Enphase microinverters and Suntech panels from an installer we had recommended.
This is what he had to say about his experience:
“We are less than impressed so far. The returns have not been as we would have expected. We’re hoping the summer months give us a more favourable result.”
That’s not the kind of feedback we like to get. So I went to work to help Steve by:
- checking his system was working properly
- checking he was being billed correctly
- discovering why his first post-solar bill (over winter) was disappointing
What I discovered was:
- his system was working properly
- he was being billed correctly
- the solution to a much lower winter bill is a bigger solar power system, upgraded hot water and moving his hot water from off-peak to the regular tariff
Interestingly, if Steve had had the opportunity to read my book, The Good Solar Guide, and followed my 7 steps, I’m confident he would now have the tiny bills promised on the book’s front cover and be certain that his system was performing as it should. But you can’t blame him for not reading it as, at the time Steve was buying his system, the book only existed on my editor’s laptop, not to be published for another 3 months.
This is one reason why you now no longer have to shell out $25 to read the Good Solar Guide. The information is too important to lock away in a book. Last week I released the full text online, for free. Of course you can still buy the book in paperback if you don’t fancy staring at a screen for hours.
Thankfully Steve had solar generation and household consumption monitoring installed. That was a smart move, because it means he has the data needed to check his system performance, verify his billing and to identify ways to get his electricity bills lower. If Steve had no monitoring, the only way to analyse his system would be for me to spend a few days at his home taking meter readings. Burnie isn’t too far from the mountain bike mecca of Blue Derby – so I really wouldn’t mind an excuse to go there, but this time I can do it all from my desk here in Adelaide.
Please: never buy a solar power system without generation and consumption monitoring – and don’t let the installer leave until he has configured and commissioned it and shown you it working. Be aware that you usually have to pay extra for consumption monitoring hardware and a bit more again for good third party monitoring software, but it is well worth it.
The Good Solar Guide gives 7 reasons why solar monitoring is so important – and further it recommends paying more for third party monitoring, because the monitoring software provided by the inverter manufacturer is usually pretty hopeless. Steve has monitoring, which is good – but it was the Enphase monitoring software: “Enlighten” which is not so good. It had all the data I needed, but as you’ll see it required some serious data wrangling get it into a useful format1.
In this post I’ll explain:
- How I took Steve’s monitoring data and massaged it to give me a picture of his system’s health.
- Then massaged it even more to check his electricity retailer was billing him correctly
- Then worked out a plan to get Steve’s power bills so low he’s happy with them
Checking the system performance: the 3 minute Solcast method
The very first thing I like to do when someone asks me if their system is performing properly is this 3 minute check to see if the system is even close to where it should be. Here’s how to do it:
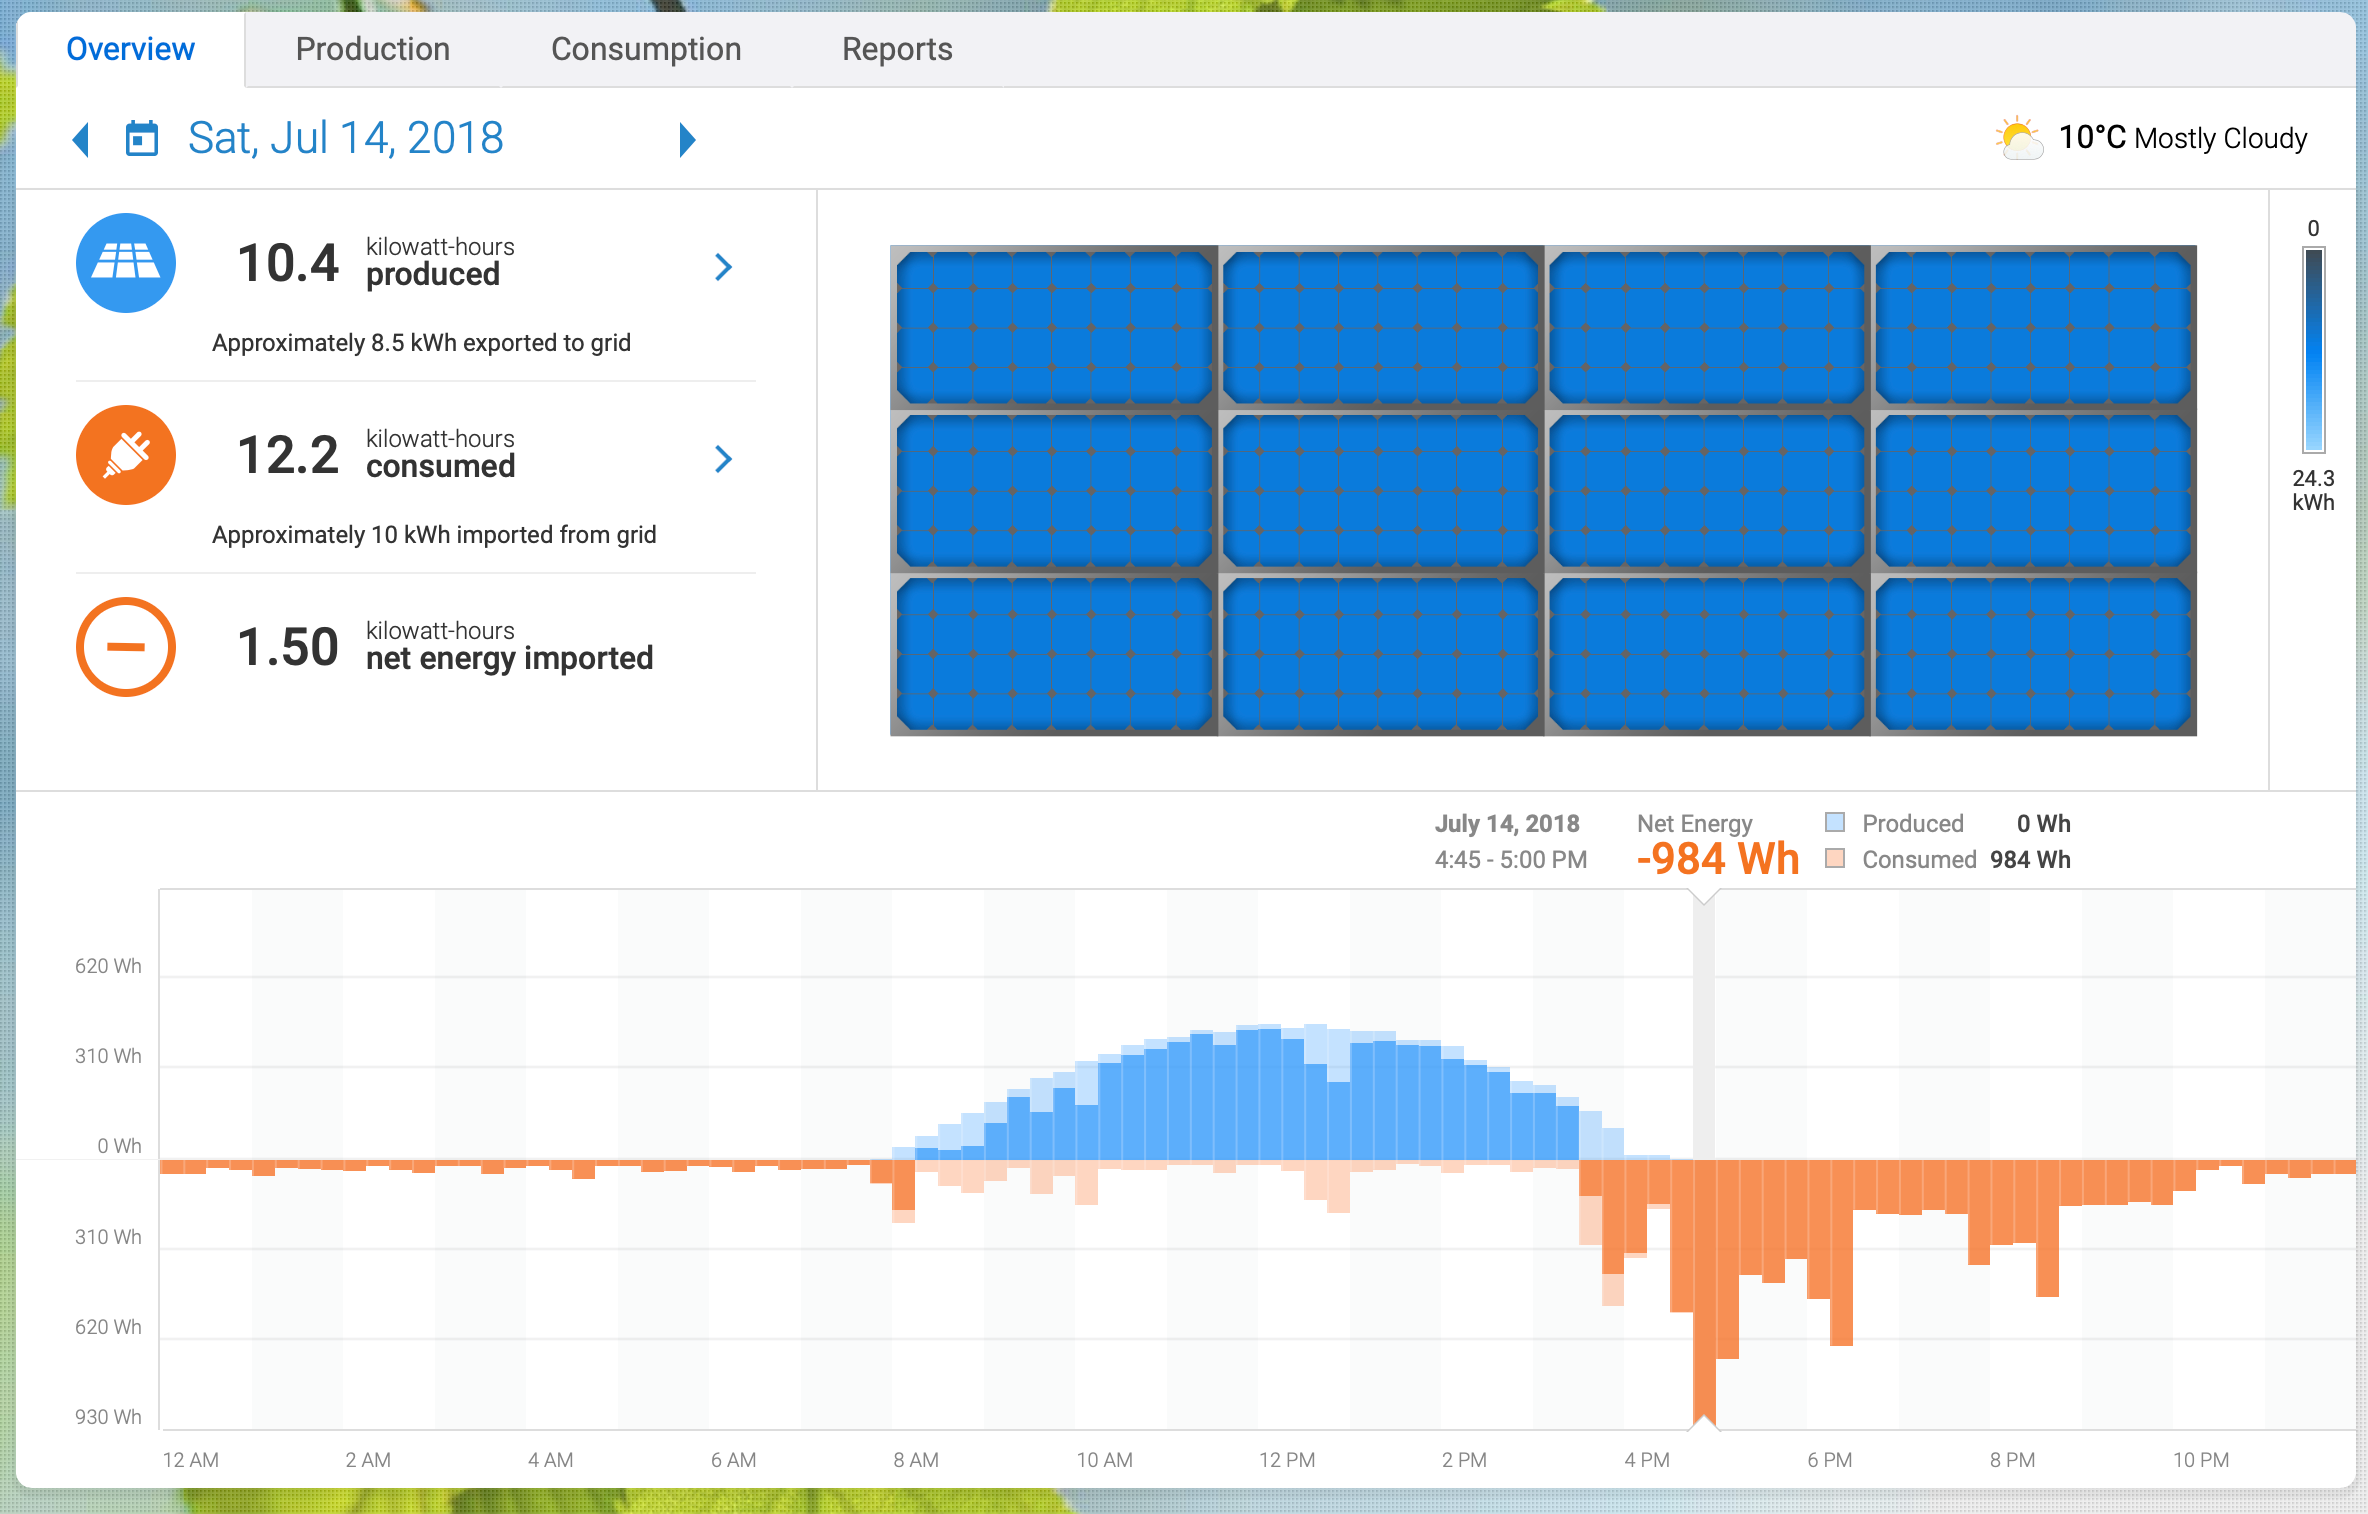
- Go to the system’s production monitoring system and look at the generation right now. Steve gave me the login to his Enphase Enlighten monitoring system and here’s what production view looked like on that particular day:
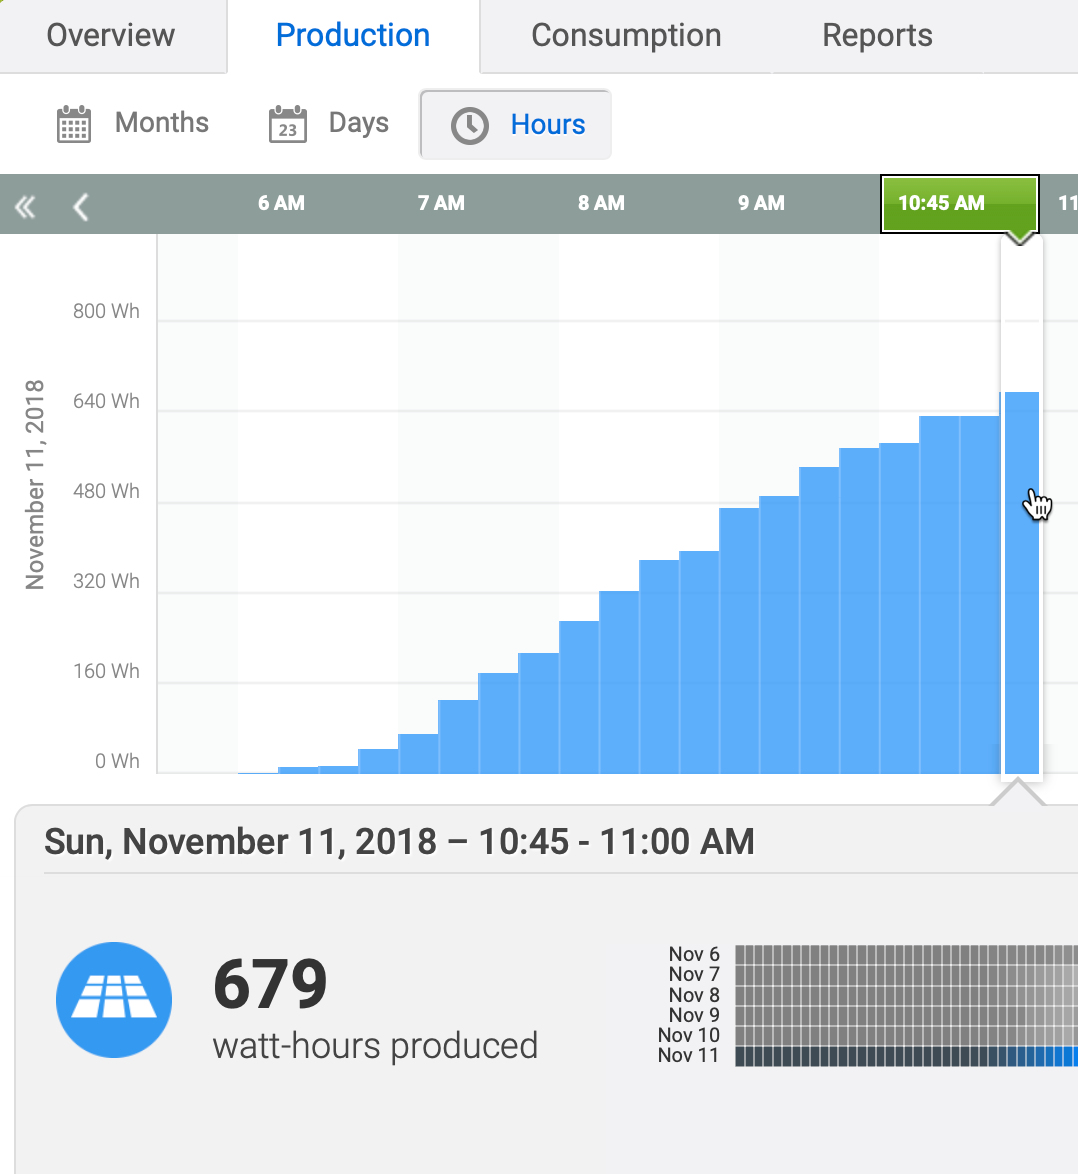
Enphase’s Enlighten monitoring software shows that the system generated 679Wh in the previous 15 minutes.
Remember I said inverter manufacturers’ monitoring is usually crappy? This is a case in point. I’m not sure that the Enlighten software engineers have ever used their software to actually check the performance of a solar power system. Look at the units of that graph! Watt-hours every 15 minutes!? That is not an intuitive unit. To understand our system performance we need a graph of’ kW vs. time.
Unfortunately Enlighten does not give us the option2 of displaying the solar system performance in kW. So we have to do a manual conversion. Luckily all we have to do is multiply by 0.004 to get useful units3.
So at this moment in time our system is generating 679 x 0.004 = 2.716kW.
What should it be generating? Luckily there is a fantastic, free Canberra-developed solar power production and forecast tool called Solcast.
If we go there we can choose our:
- location
- system size
- panel tilt
- solar panel direction
and Solcast will use a network of real time satellite measurements to tell us what power we should be producing right now, what the solar production should have been in the past, and magically what it should be in the future.
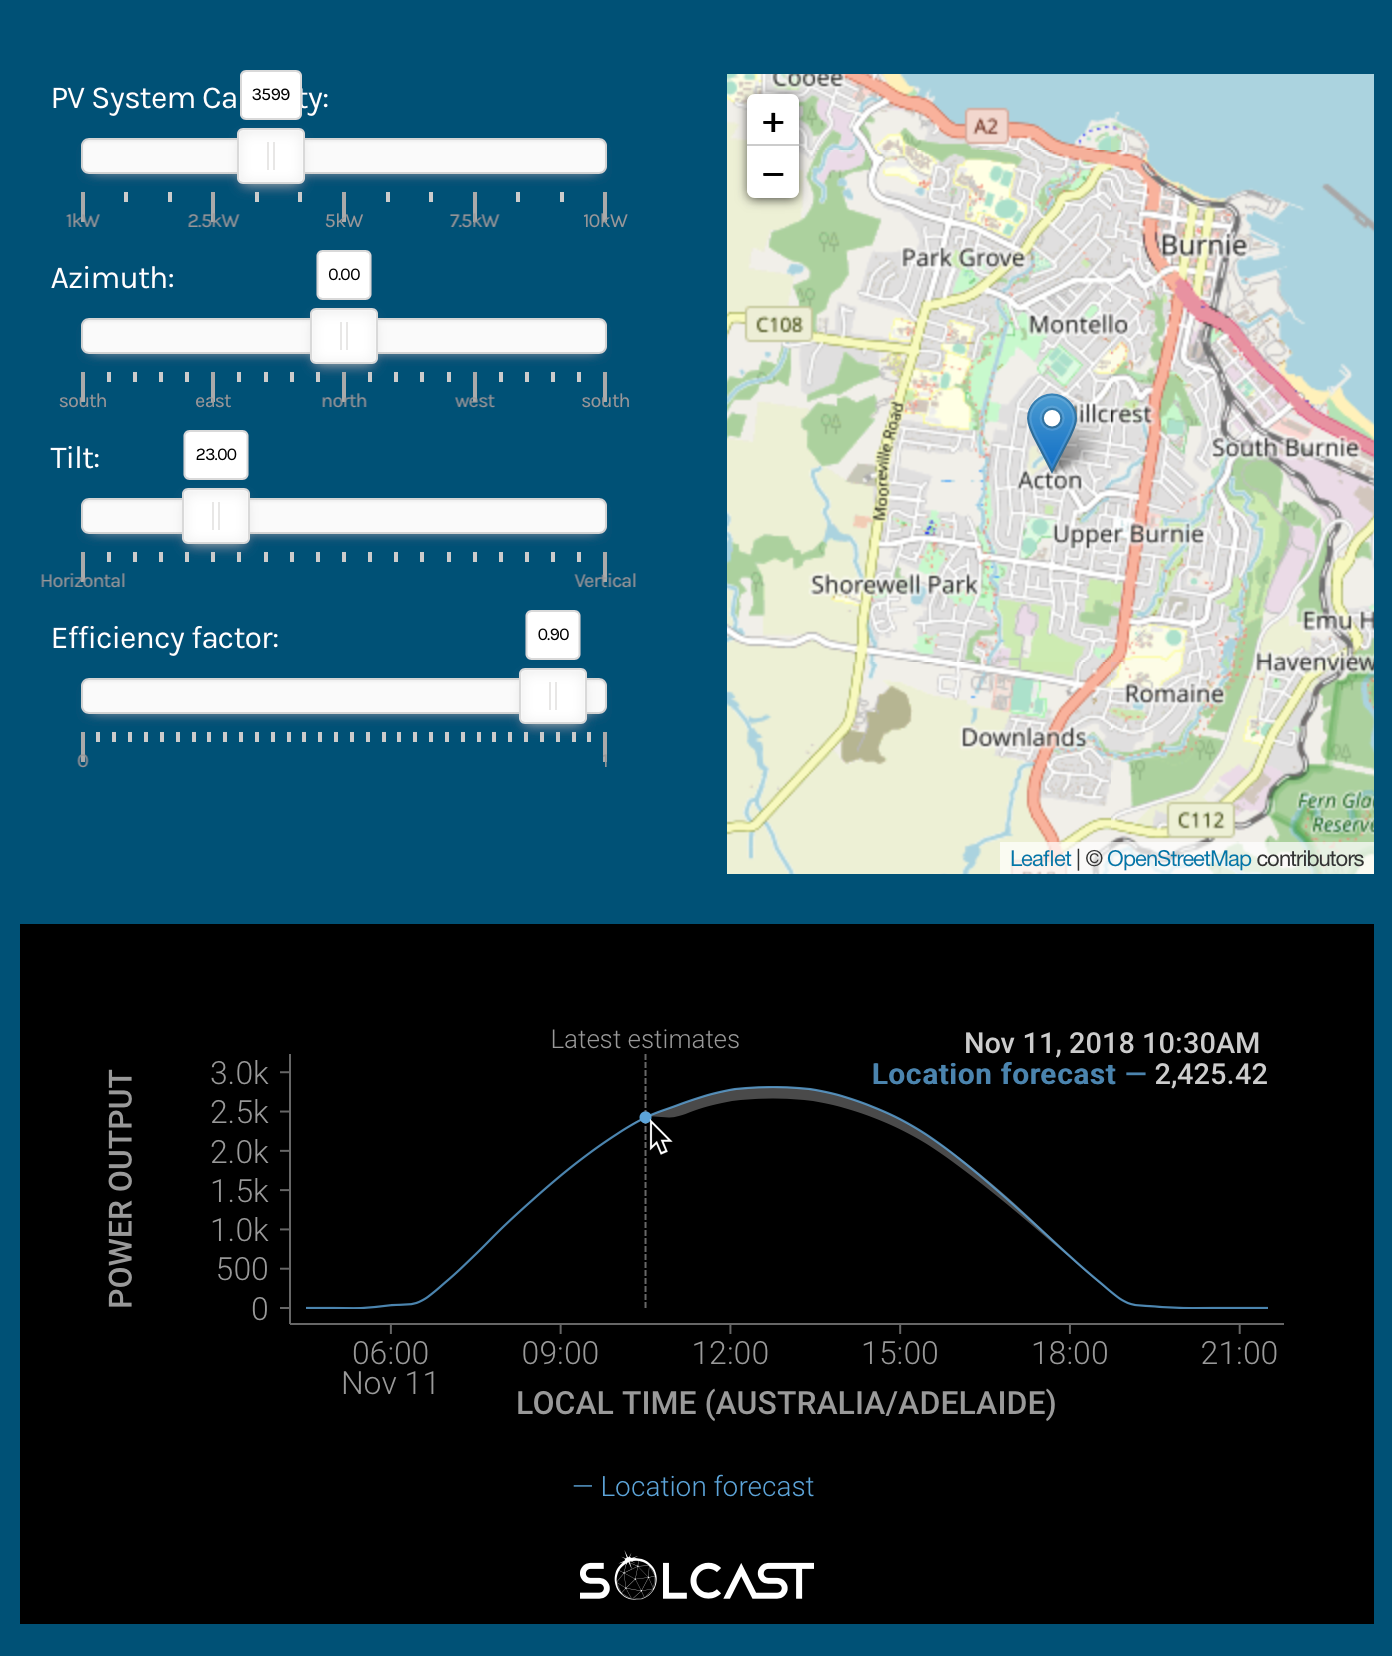
Solcast estimates generation of 2.425kW right now. (rest is forecasted – pretty cool eh?)
Using the tool, it tells me that we should be getting about 2.43kW of power right now. That’s within 10% of Enlighten’s measured figure, so I’m confident Steve’s system is operating OK.
If you want a quick 3 minute check on your system performance, Solcast is a good way to do it. Even if you don’t have solar monitoring you can do it with an instantaneous power reading from your inverter’s display.
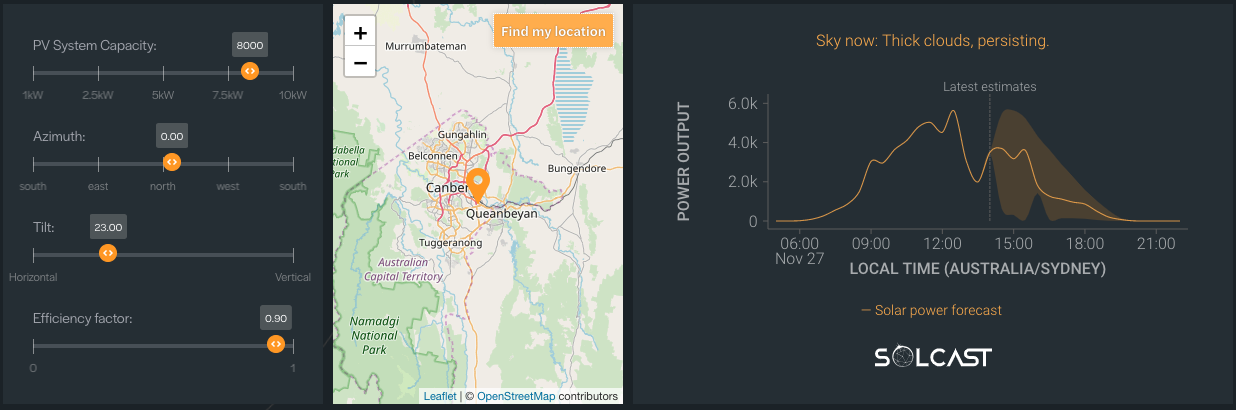
UPDATE 29 NOV 2018: Just after I published this post Solcast updated (improved) their free tool. It now looks like this – so don’t freak out when it looks different to my example…
The brand new Solcast interface
But I think Steve deserves a more thorough check based on more than one measurement – so let’s do that too.
A more rigorous check: The 10 minute PVWatts method
PVWatts is a free web-based tool from the US Government’s National Renewable Energy Laboratory (NREL). We can use it to get an estimate of how much energy Steve’s system should have generated (based on NASA irradiation records) over the whole billing period and compare that with what was actually produced according to the Enlighten monitoring.
Here’s what I did.
- Go to PVWatts
- Enter Steve’s location: Burnie, TAS.
- PVWatts tells me that the nearest irradiation measurement data point is 70km away. Close enough.
- Enter Steve’s system information: 3.6kW, panel direction (azimuth) = 0º, tilt 20º from horizontal
- Get the results tabulated as energy generated per month over a year.
The steps are shown here:
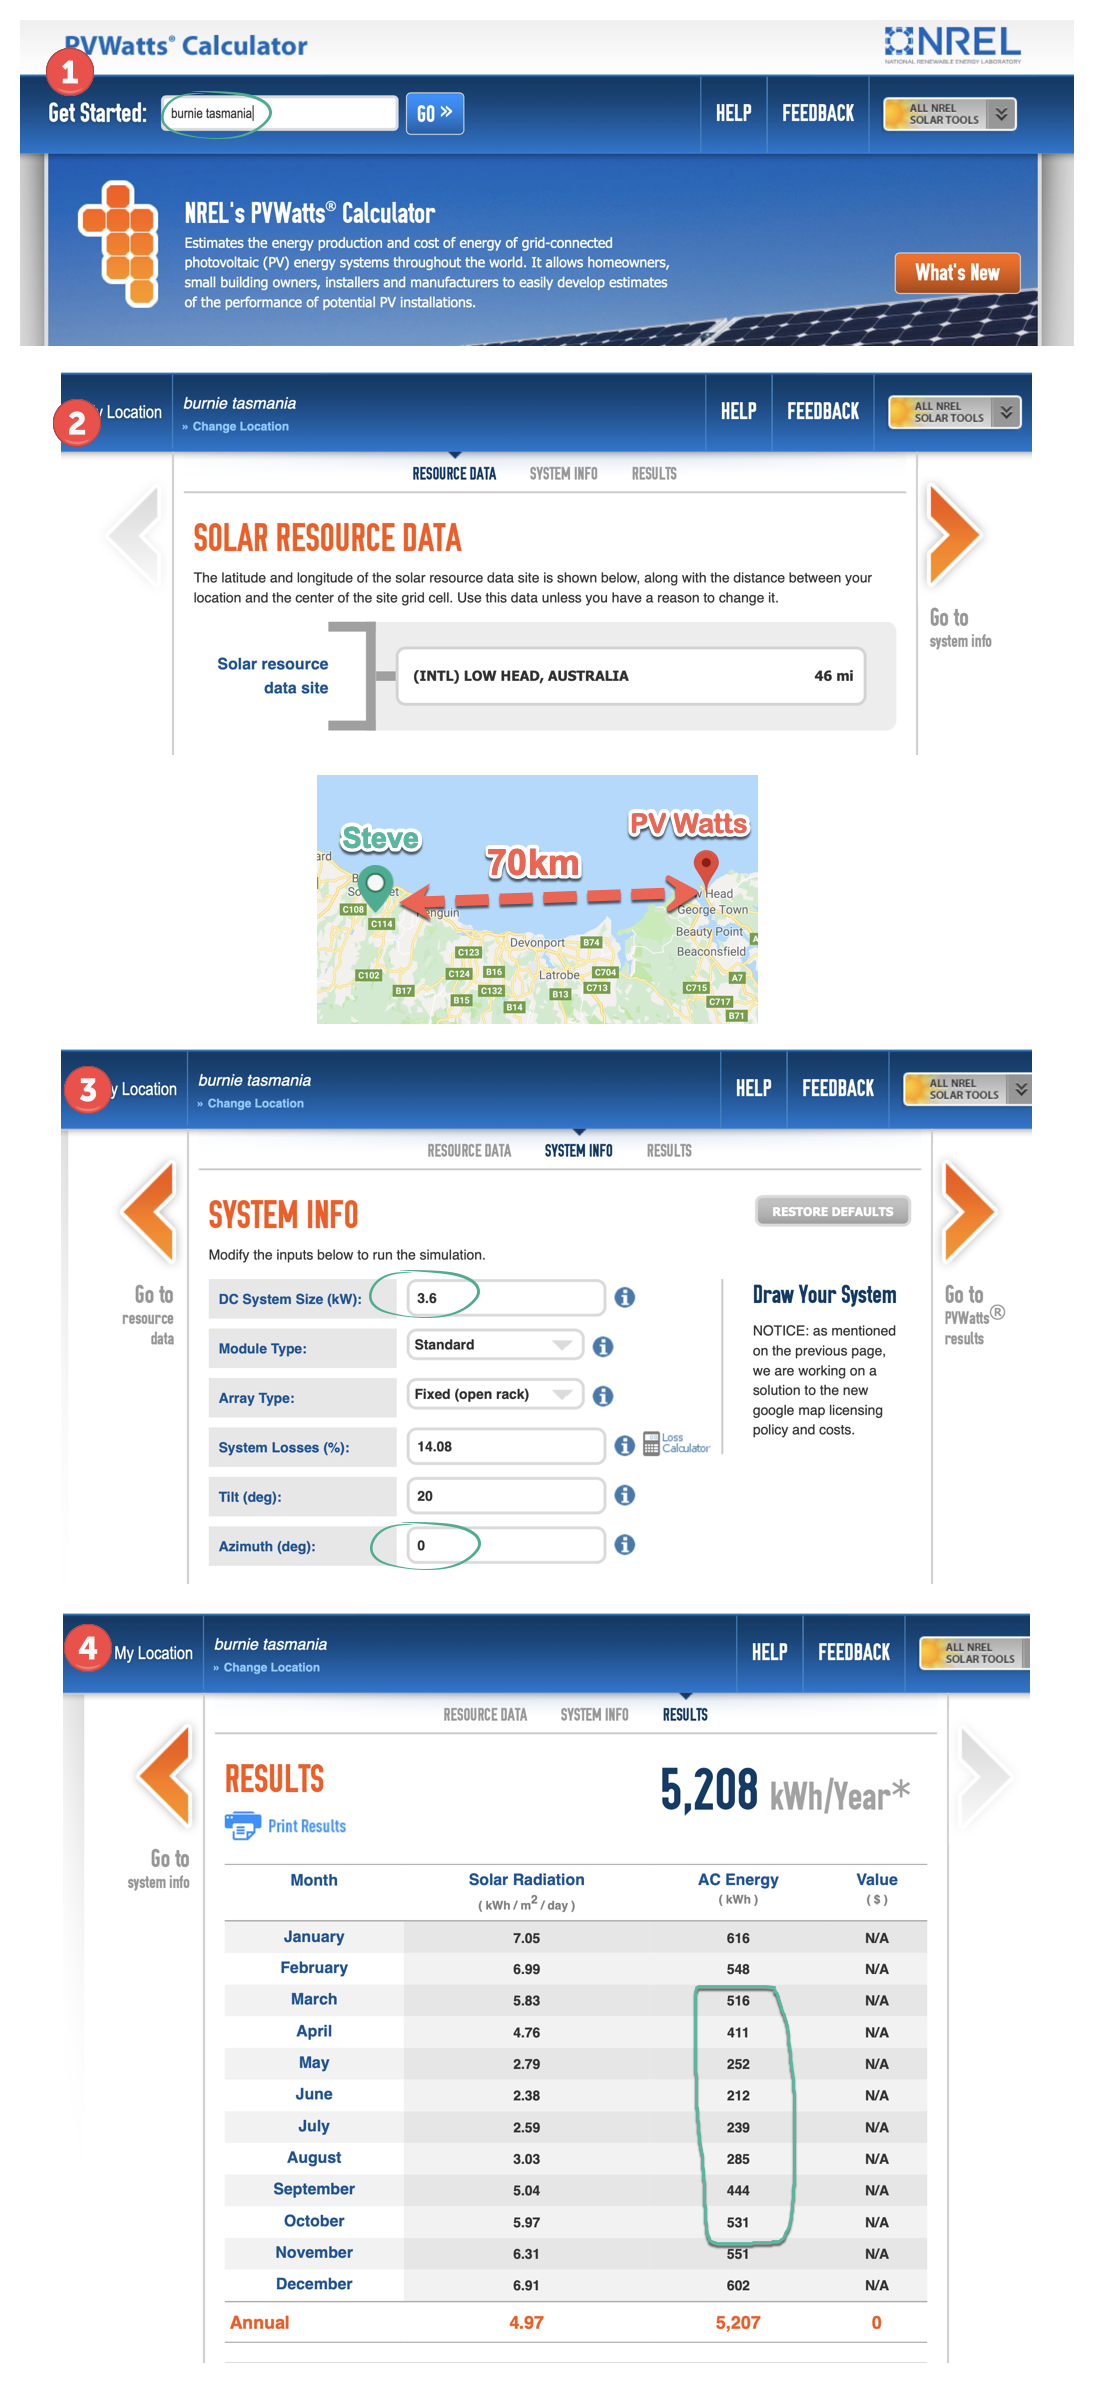
Looking at PVWatts’ results table, the months I’ve circled in green cover the full months that Steve has had his system. The formatting of the results make it easy to copy and paste the figures directly into my spreadsheet program of choice: MS Excel.
Unfortunately it is a little trickier to get the data out of Enlighten. The data is displayed clearly enough, but I’ll be buggered if I can find a way to copy or export it to a nice file. So I literally had to type out each month’s result into excel manually.
I only had to type out 8 numbers, but for a lazy bugger like me that is hard work. But enough moaning. Finally I have my data in Excel:
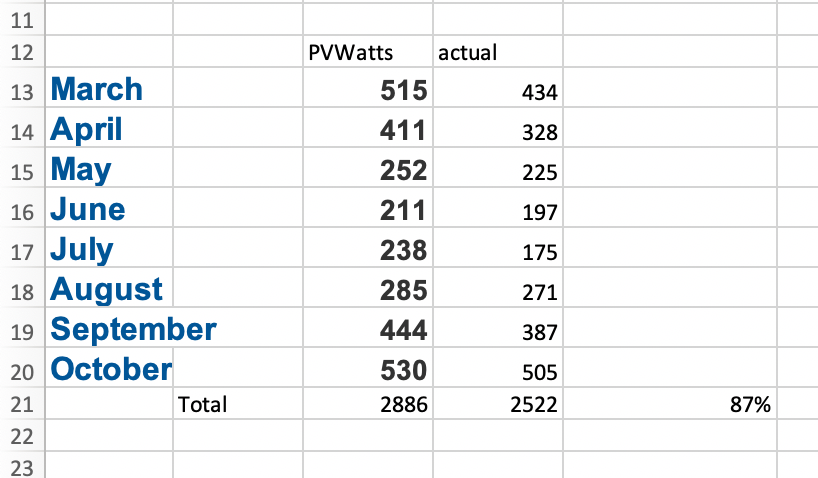
And I can graph it:
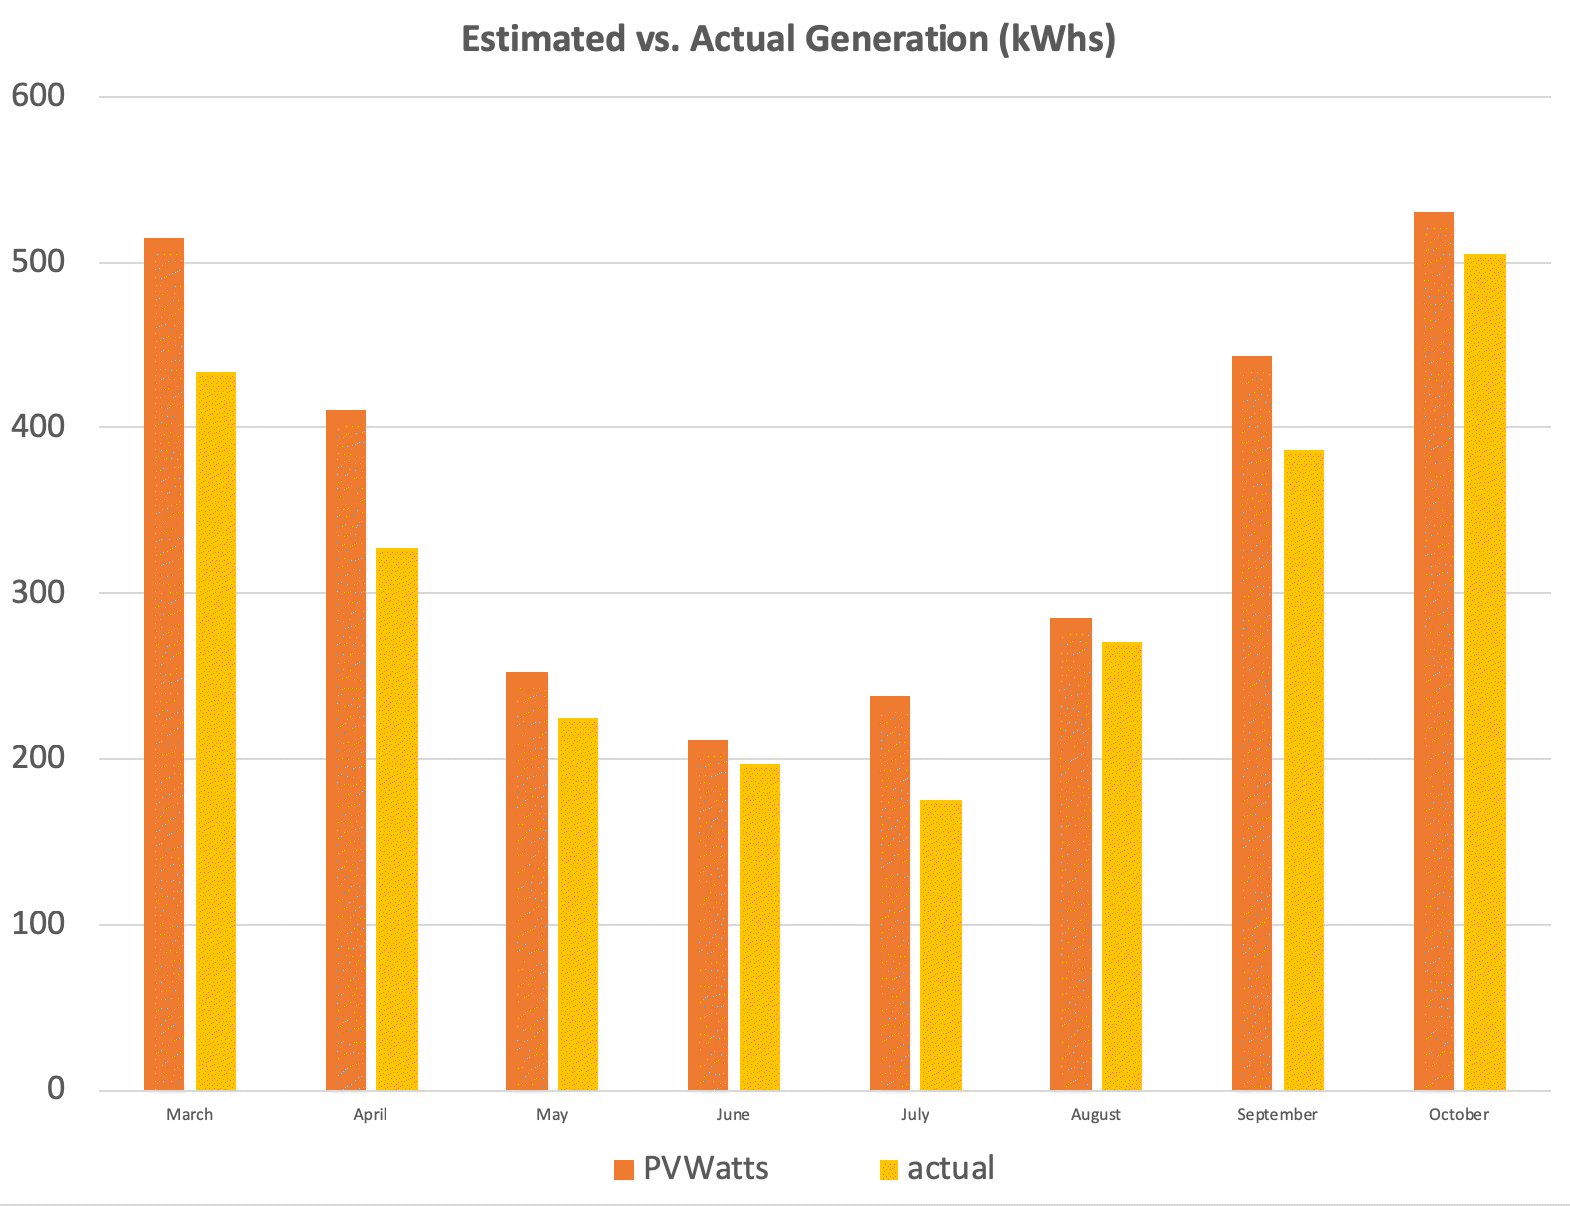
Steve’s system is at 87% of PVWatts’ estimates. Close enough for me to say that it seems to be working OK. I can’t really be more precise than that because PVWatts is using averaged historical data, not actual weather data from those months, and the nearest measuring point is 70km away.
If we compare Enlighten with a good 3rd party monitoring system, Solar Analytics, here’s what my home monitoring system shows me with one click:
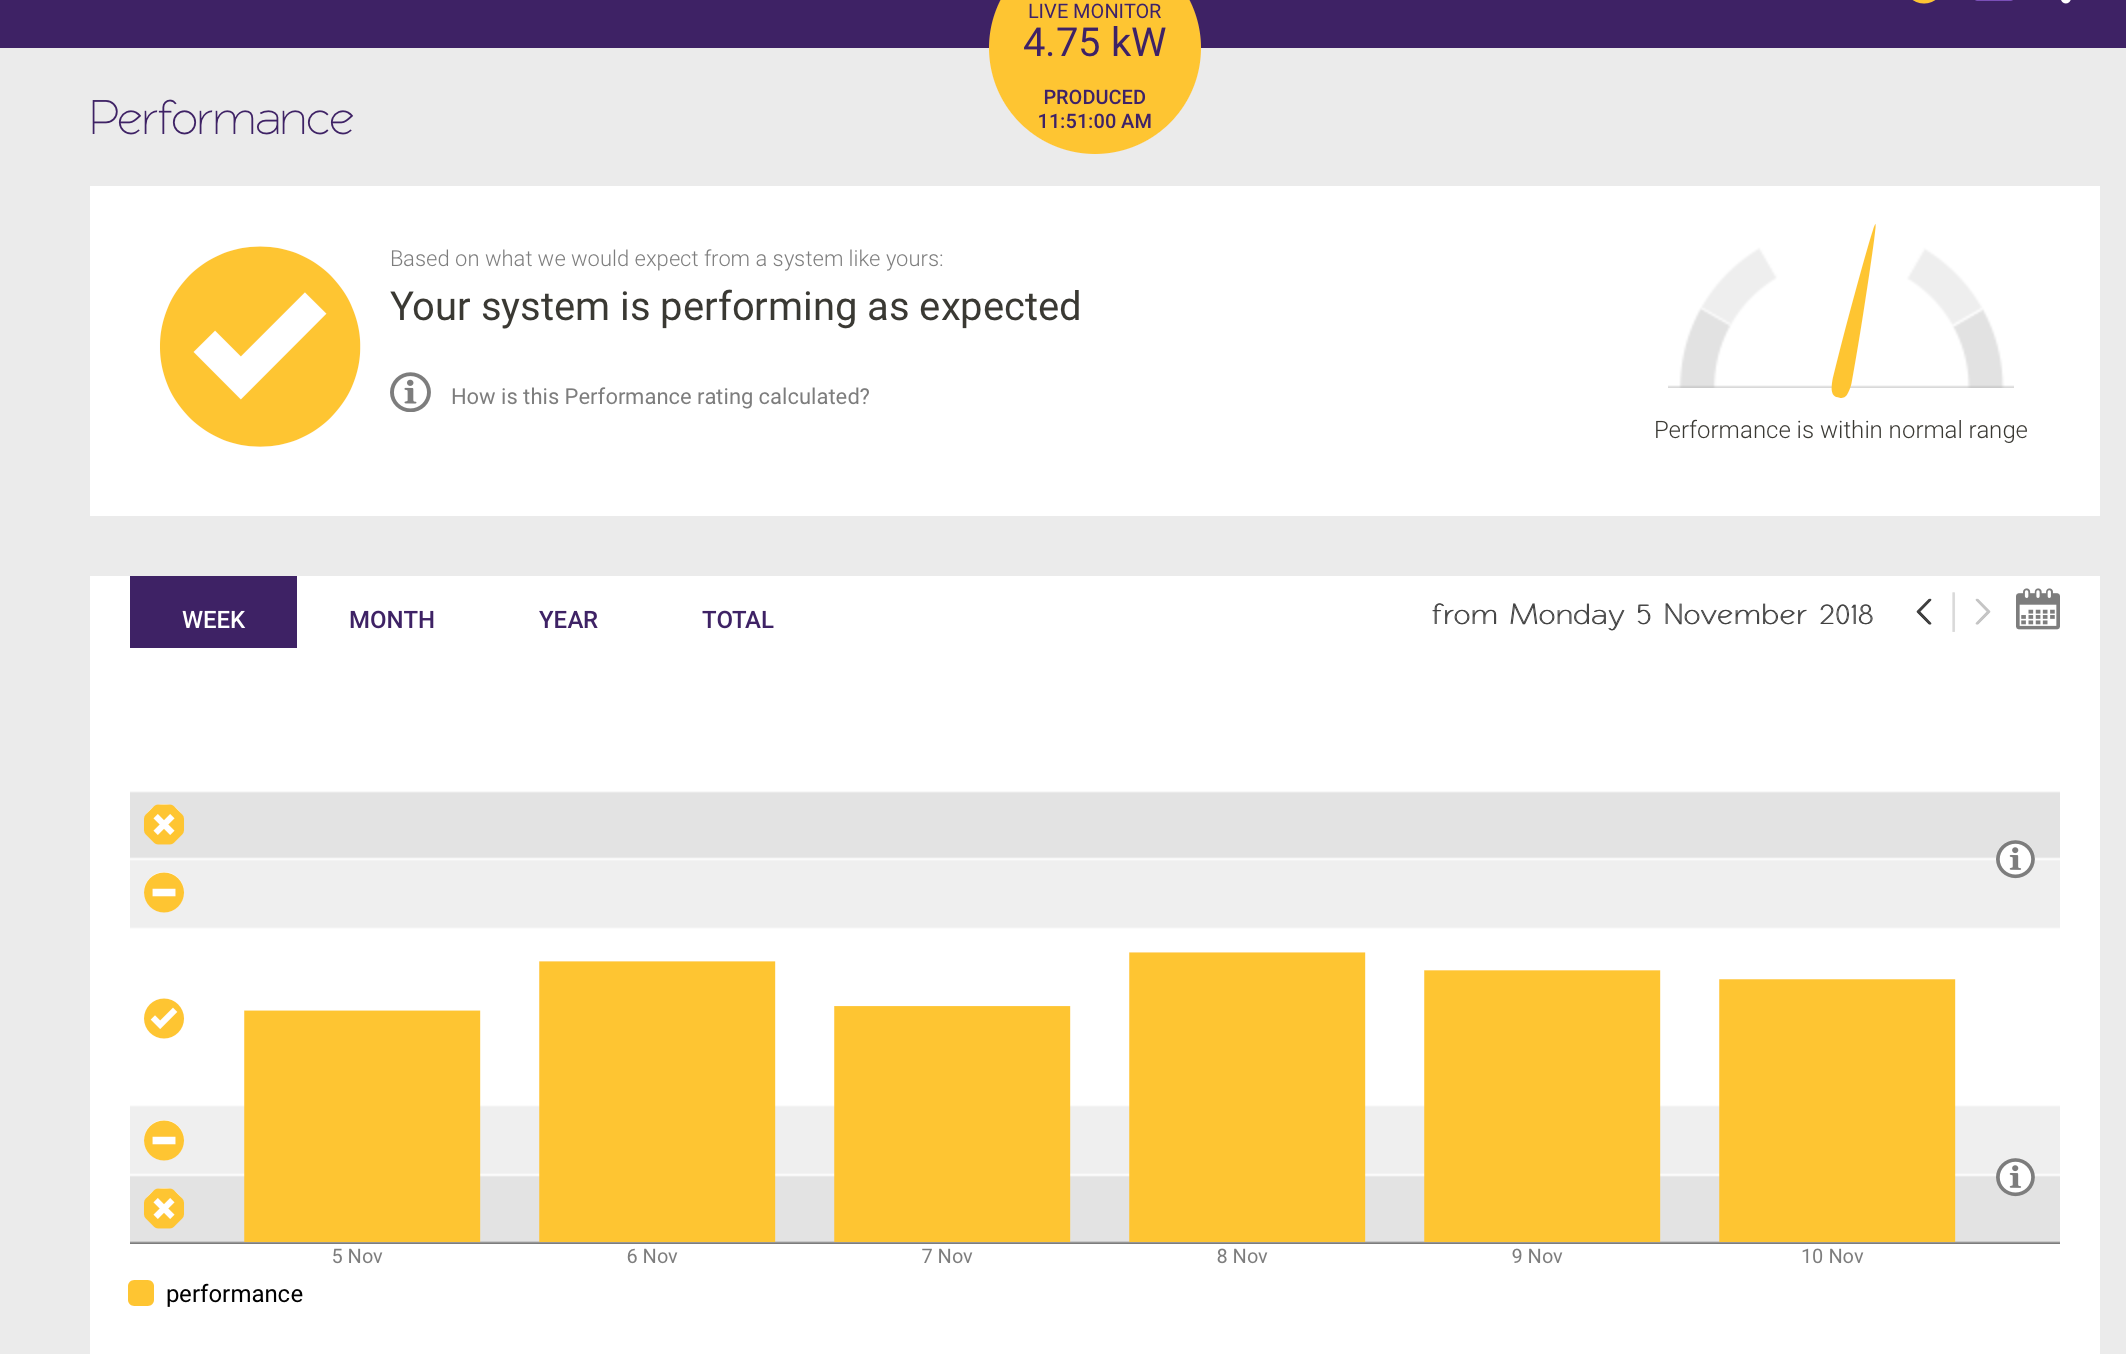
Solar Analytics shows the performance of my personal solar power system
With one click I can see that my personal system is consistently in the normal performance range. I can be confident that the numbers are precise because it uses actual weather data for the period measured. I’m happy that I’m getting the energy I paid for. If it does ever go out of the zone, I’ll get an email alerting me, and it will even try to diagnose the exact issue with some very funky algorithms. Solar Analytics rocks.
But back to Steve’s system. We have established that the system is working OK. Now it’s time to check that Steve is being billed correctly.
Is the bill correct?
Here’s Steve’s winter bill.
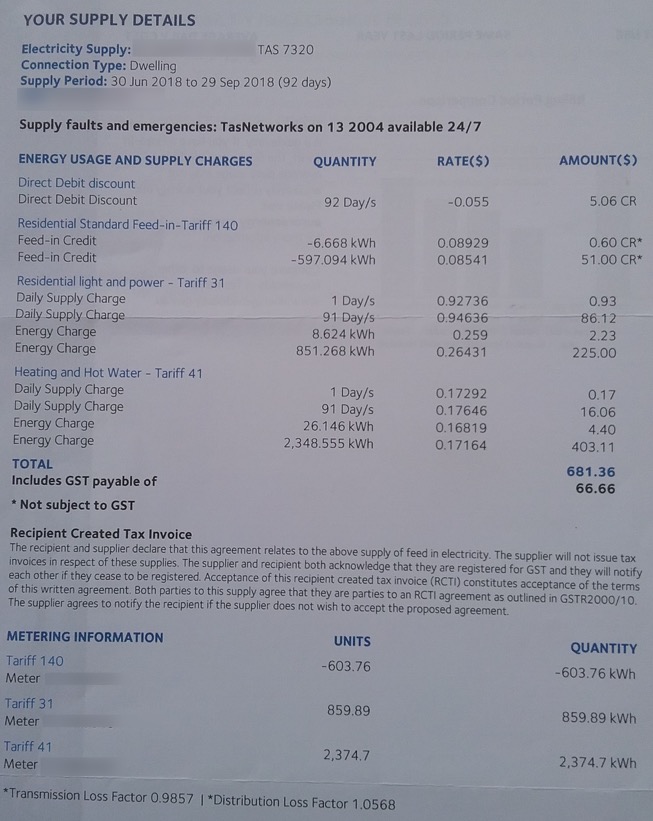
The electricity bill is for July, August and September 2018.
He was credited for 597+6 = 603kWh of electricity export.
He was charged for 851+8 = 859kWh of electricity imports on the regular tariff.
He also has a ‘Heating & Hot Water’ tariff that used a whopping 2,348+26 = 2,374kWh.
The solar power system is connected into the regular tariff’s meter.
Now I need to find out Steve’s measured imports and exports using Enlighten.
What I need to do is use Enlighten to find out:
a) what was exported to the grid so we can check he was credited the correct amount
b) what was imported from the grid so we can check he was charged the correct amount
Here’s how I did that:
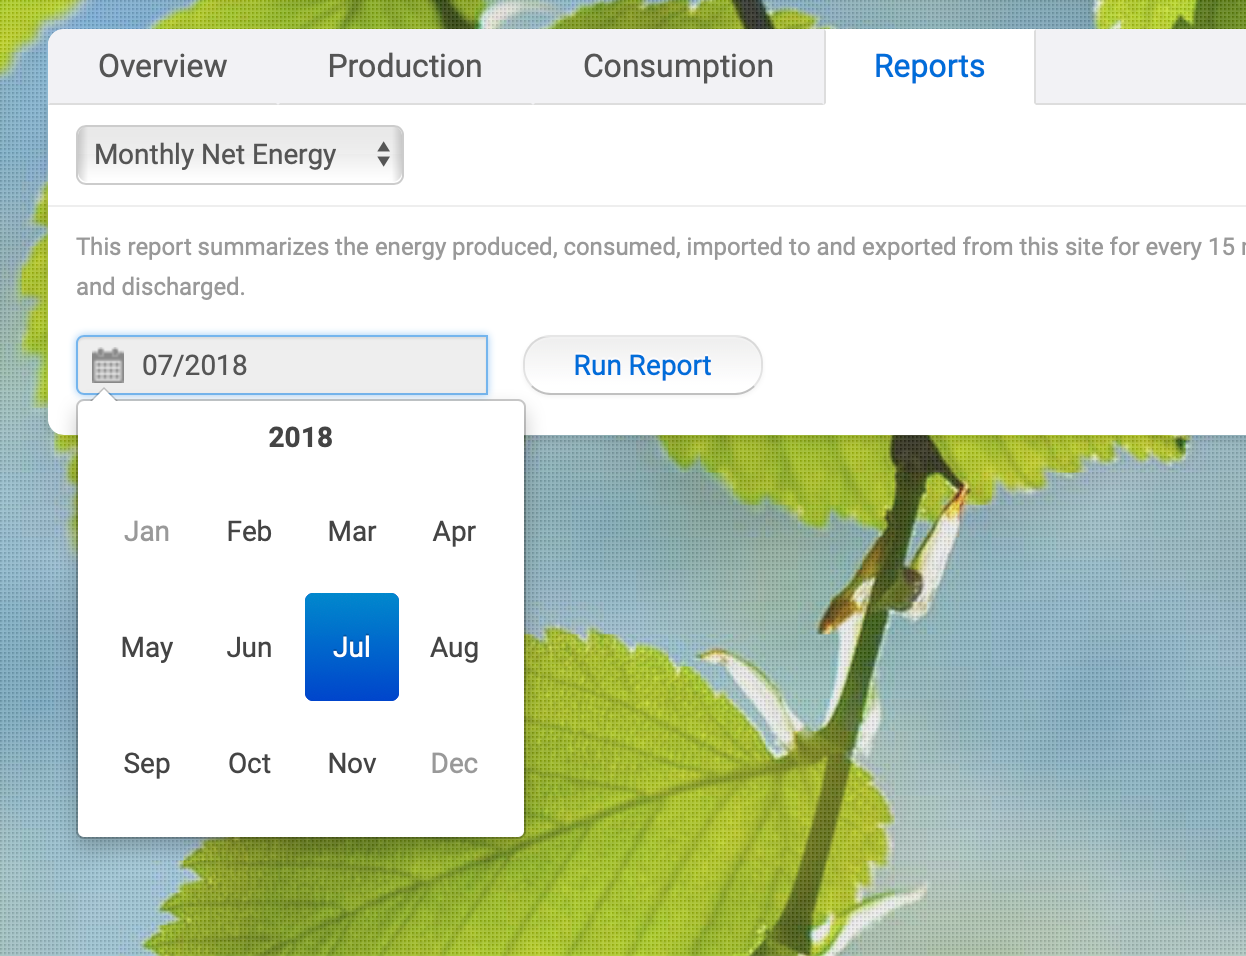
1. In Enlighten, create a ‘Monthly Net Energy’ report for each month of the bill.
The result is 3 ‘csv’ files emailed to me with the following columns:
- Energy Produced (Wh)
- Energy Consumed (Wh)
- Exported to Grid (Wh)
- Imported from Grid (Wh)
The files contain a data point (row) every 15 minutes for the whole month.
2. Import each file to Excel.
3. For each month, find the sum of Exported to Grid (Wh) column
4. For each month, find the sum of Imported from Grid (Wh) column
5. Convert to kWh (divide by 1000)
6. Create a new spreadsheet to add the months’ totals together:
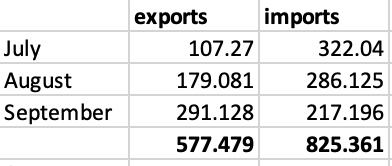
Phew, now I have some numbers to compare with Steve’s bill.
The bill credits Steve for 597kWh of exports. Enlighten has measured 577kWh of exports. The difference is 3.5% or 20kWh difference or $1.80. Close enough.
Steve’s bill is charging him for 859kWh of imports. Enlighten has measured 825kWh of imports. A 4% difference, or $8.84. Again, close enough to be confident the meter is working properly.
That was quite an effort. My Solar Analytics monitoring provides the same numbers over those dates with 2 mouse clicks. Just saying.
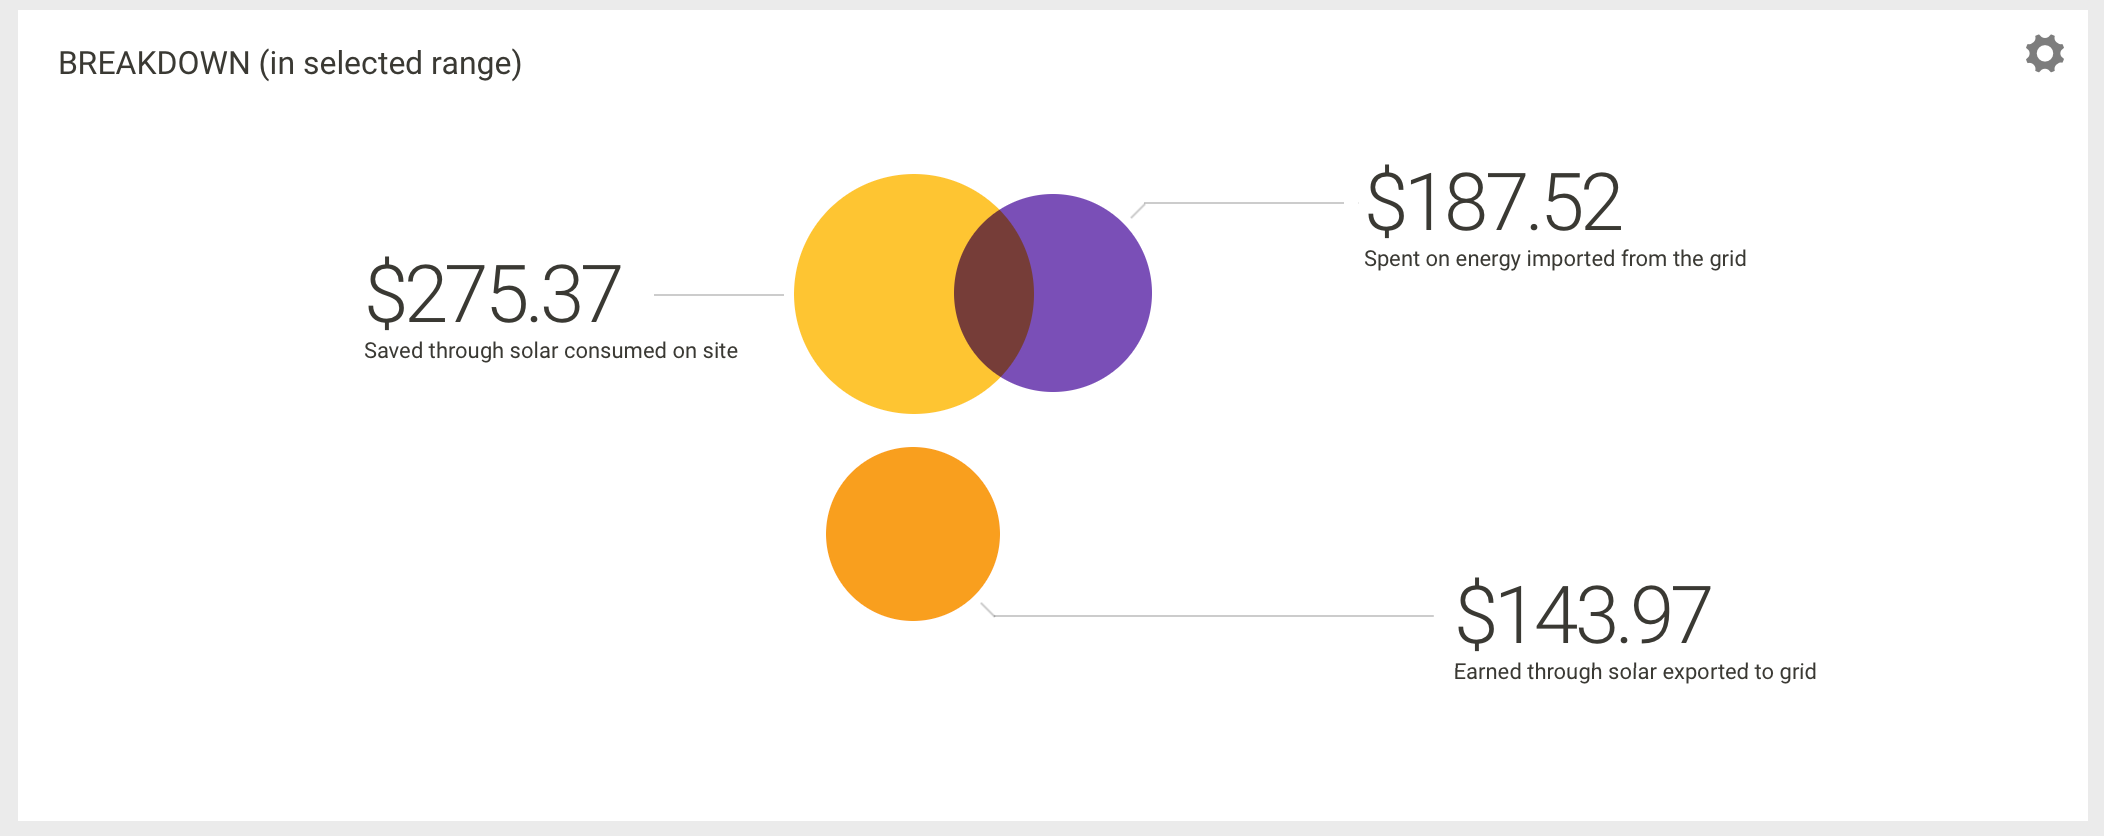
Solar Analytics provides imports and exports over a given period with 2 clicks. Note: these are numbers for my solar system (not Steve’s).
What would Steve’s electricity bill have been without solar power?
So now that I’m happy that the electricity bill is correct – I want to advise Steve how much money his solar power system has saved him over the winter’s quarter. We know he’s earned $51.60 through his exports, but what about his savings from self consumed solar power? His bill cannot show those savings because there is no way for the billing meter to measure self consumed solar electricity: that solar goes straight into his house, bypassing his meter.
Unlike Solar Analytics, which gives the self-consumption savings for with one click (the yellow circle in the image above), I need to do some more Excel number crunching to get the data from the Enphase Enlighten software.
I know that:
Self consumed solar = energy generated – energy exported
So I need to put the solar production numbers from Enlighten into my spreadsheet, and subtract that from the exports to generate a new column: “self-consumed”.
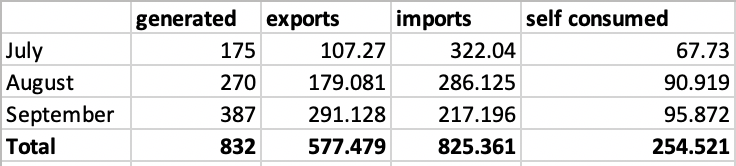
Now I can see Steve generated 832kWh total, and self consumed 254 of those, giving him a self-consumption ratio of 30%.
At 26c per kWh +GST Steve has saved $72.64 with self consumed solar.
So Steve’s total savings for the billing period = $72.64 + $51.60 (for exports) = $124.24.
I know. Not particularly impressive.
How can Steve get his winter bill much lower using solar?
Tasmania is the most challenging state to get good payback with solar power. It has a low feed-in-tariff, less sun and expensive solar installs compared to the mainland states.
But that doesn’t mean it is impossible. Just harder.
I maintain that any reasonably efficient house in Australia should be able to get tiny bills with a reasonably sized solar power system and basic energy efficiency measures. You just need to follow the correct steps.
That’s why I wrote The Good Solar Guide: 7 Steps to tiny bills for Australian Homeowners.
Let’s look at the the steps and see how Steve could have approached solar power differently if the book had actually been published back then.
Here are some key takeaways that Steve might have picked up and implemented.
Step 1 – The basics: Understanding a few key solar concepts increases the probability that you’ll buy a system that makes you happy. One of the reasons Steve’s electricity bills are still high is simply that his self-consumption ratio is very low for a smallish 3.6kW system. One of the many concepts explained in Step 1 is the importance of self-consumption.
Step 2 – Measuring your energy use: This step would have identified that Steve had a second meter – an off peak/controlled load meter. It would have encouraged Steve to consider the costs of that off peak energy as part of the solar buying process. It would have also encouraged Steve to measure his regular tariff consumption in daylight hours by taking a morning and evening meter reading. He would have seen his daytime usage is bugger-all, as shown here:
Step 3 – Hot water: This step would have identified hot water as an issue that needs addressing before even looking at solar panels. It would have suggested either a heat pump or a hot water diverter as a solution.
Step 4 – Show me the money: This step would have shown that a 6.6kW solar power system is almost always the sweet spot for a house on single-phase, and explained how the last 3kW of panels would be much cheaper than the first 3.6kW.
Step 5 – Hardware: This step would have explained that if you are on a budget and there is no shading, expensive microinverters are not needed. Steve could have spent the microinverter premium on extra solar panels, potentially getting the suggested 6.6kW system for only a little more than the 3.6kW microinverter system he actually bought. It would have also recommended he invest in Solar Analytics, which as we’ve seen is very handy. Solar Analytics has 3 channels allowing him to monitor:
- Solar
- Regular tariff
- Off-peak Tariff
on the same screen.
Step 6 – Getting quotes: This step would have suggested that Steve insisted on quotes that showed Steve’s predicted generation in every season, so much lower winter electricity generation would not have been a surprise.
Step 7 – After the install: This step would have explained how Steve could use the monitoring to identify opportunities to move electricity consumption into the daytime. It could have also shown that his two-star heat-pump heating system is quite inefficient.
What would Steve’s system look like if he’d had this information?
Firstly, Steve would have likely heeded this advice in the book:
“Key point: If you have a big enough roof, my advice is to go for at least 6.6 kW of panels, no matter where you are in Australia and no matter how small your daytime consumption. It will almost certainly will give you a better return than a smaller system.”
So Steve would have bought almost double the solar generation capacity – especially useful over a Tasmanian winter.
Obviously 6.6kW will cost more than 3.6kW – but as the book points out, the last 3kW of solar should be much cheaper than the first 3.6kW thanks to the way the solar rebate works. That and the grid connection rules make 6.6kW the best way to minimise the cost per kW of solar installed while still buying a quality system.
Further, Steve chose to install microinverters. Now there’s nothing wrong with that – microinverters have lots of advantages over string inverters. I have micros on my roof. But they do add 20% or so the the cost. As far as I can see from Google Maps, Steve has no shade issues. If he had chosen a string inverter over micros, then a 6.6kW string system would have not been much more than a 3.6kW micro system – but delivered much lower bills.
But there is more to low electricity bills than just getting more solar panels.
Have a look at what makes up Steve’s bills. This is a graphical representation of the bill he sent me:
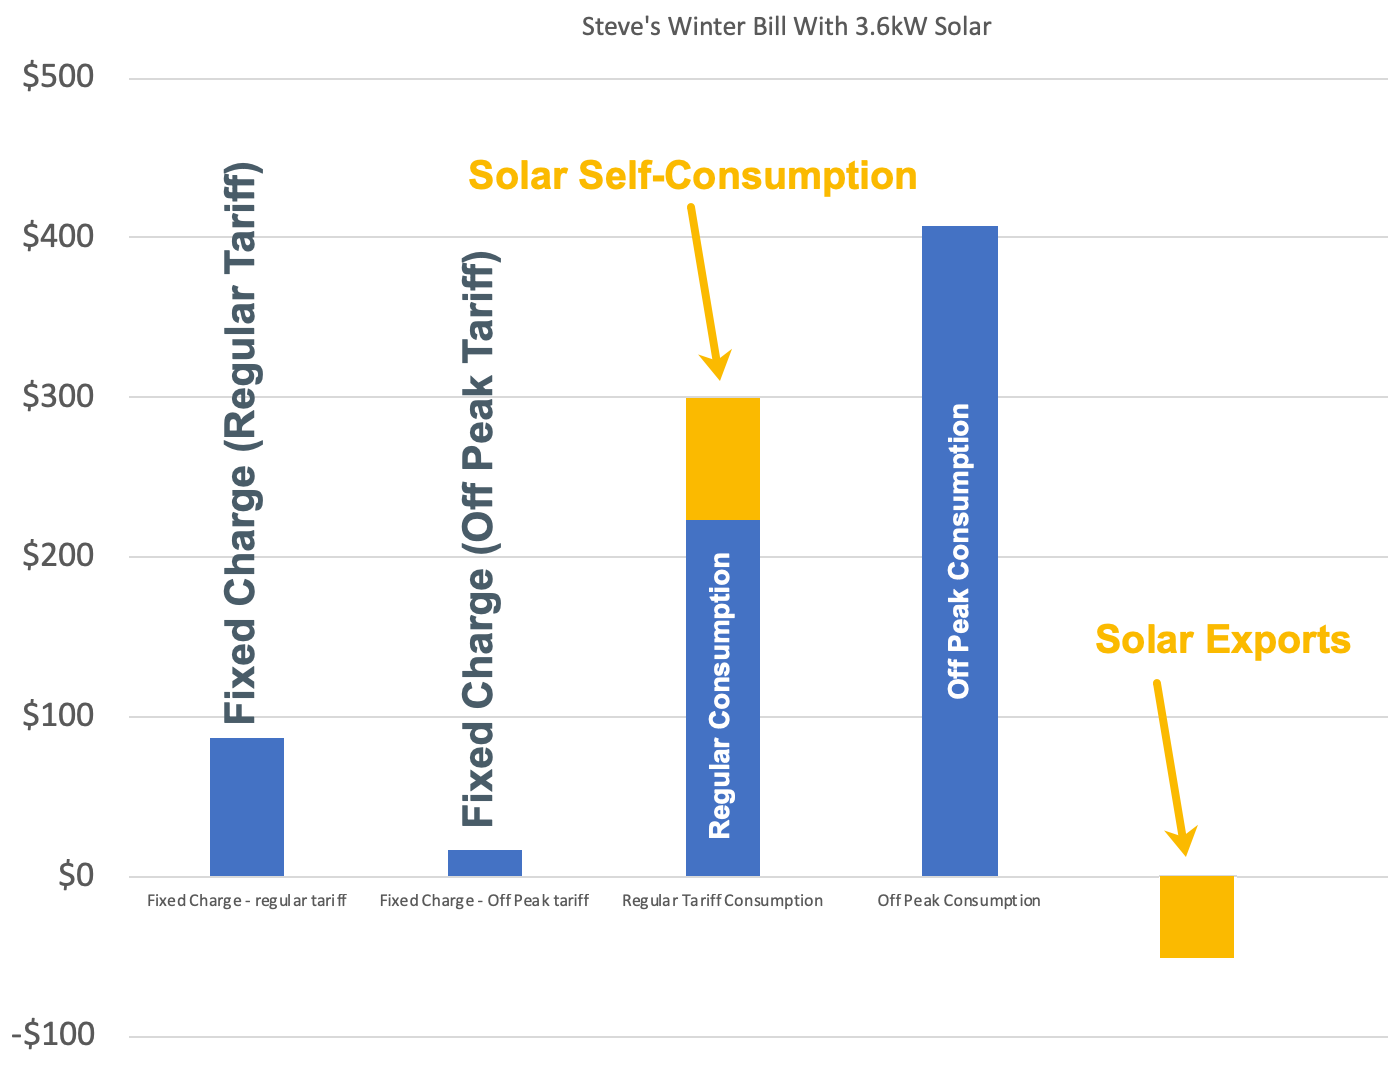
Steve’s existing electricity bill
The blue bars are his costs and the yellow bars are his solar savings.
Sticking out like my friend Lee’s second toe is the Off Peak Consumption. If we can reduce or eliminate this, we are making a big difference to the bill.
The only appliances connected into this meter are:
- Steve’s old Rheemglas 1125007 electric storage hot water heater.
- A 2 star-efficient reverse-cycle air conditioner that is used as a heater.
I’m going to guess that of the daily 25kWh of off peak energy used, 18kWh is for the hot water and 7kWh is for the heating.
That means he is using about 18kWh per day to heat water over winter. This is a lot but not unrealistic if the cylinder is old and inefficient.
In the Good Solar Guide I devote a whole chapter to hot water because it can easily make up 30% of your energy use; so related considerations should be part and parcel of any solar installation.
The chapter goes through all your hot water options. Because Steve has an old cylinder that looks like it is due for replacement anyway, my number one recommendation would be to replace it with a high quality heat pump hot water system. This would drop his hot water energy requirements down to closer to 4kWh per day over winter. They really are that much more efficient.
Combine heat pump hot water with a bigger 6.6kW solar system, and he should be able to run it from 10 am to 2pm almost every day on solar power alone. He would need to connect the heat pump into his regular tariff meter so it is solar powered.
So upsizing to 6.6kW (very cheaply if he chose a string inverter architecture) and investing in a heat pump are the 2 big takeaways from my 7-Step process.
Add to that the book’s advice to do some time-shifting: moving as much consumption from the evening to the day helped by the installation of better monitoring software, and Steve could be looking at a winter bill that looks more like this:
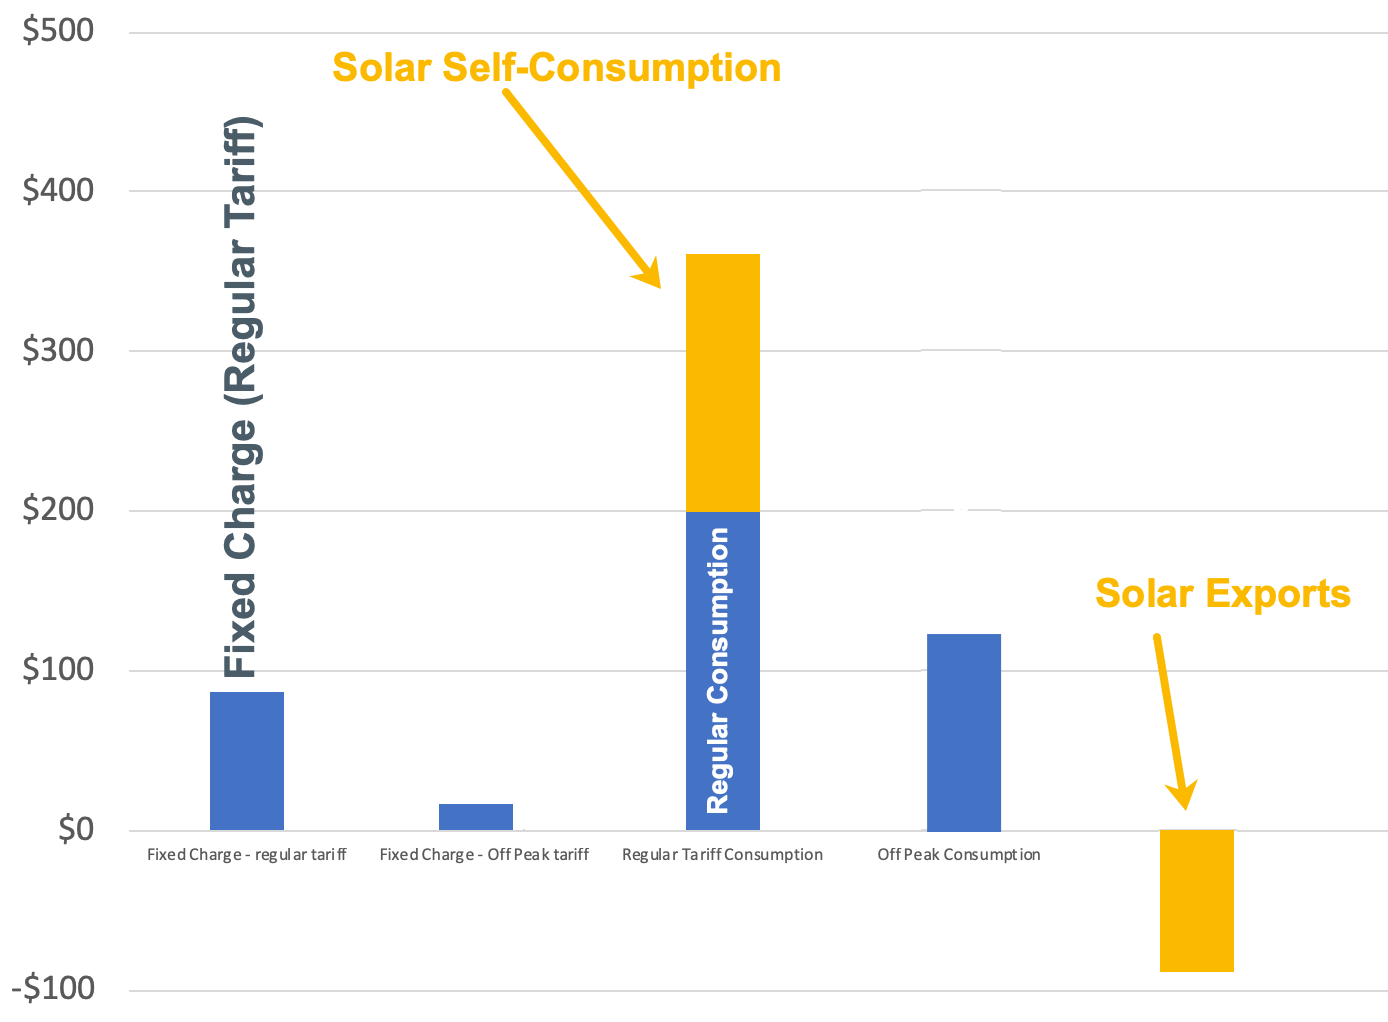
Steve’s hypothetical new electricity bill
Solar electricity self-consumption has increased – mostly due to the heat-pump running during the day – on the regular tariff, but also due to the bigger system offsetting more appliance usage on overcast days. The bigger system also generates more exports.
I guesstimate this scenario would lead to a winter bill of closer to $300 than $660. And I’d guess his summer electricity bill would be between $100 and $150 (depending on his summer consumption).
He could get that down even further by upgrading his space heater to a 6-star efficient one, which should use at least half the energy of his old 2-star one. He should also look at the “gaps, glazing and insulation” in his home to ensure his thermal envelope keeps the house warmer for longer in winter and cooler in summer.
And Steve could use his Solar Analytics software to easily check that his system was performing without reaching out to me for help (although I don’t mind helping at all) and to verify that his retailer was billing him correctly.
Of course there is an extra cost to buying a heat pump and a bigger system. A top-of-the-range Sanden heat-pump will cost about $4000, or a Bosch/Stiebel Eltron one around $2,000. His upgrade to 6.6kW of panels could cost as little as $1,000 if he had changed his system design to a string inverter.
But that big solar power system combined with a heat pump should comfortably save Steve over $1,000 extra per year for decades to come.
Back in the real world
Of course Steve can’t turn back the clock. So what should he do now?
As a priority he should upgrade his hot water system to a heat pump. That will immediately reduce his water heating bills by about 75%.
He should also look for opportunities to move consumption into the daytime.
I’d also look at quick and cheap efficiency fixes like gap sealing, secondary glazing and insulation.
Then I’d look at upgrading the air-conditioner to a six-star efficient unit.
Finally I’d consider adding a 3kW system to the west facing roof of the main house.
Once that’s in place I’d move the hot water to the regular tariff so it can be solar powered.
How to buy solar well
We lead busy lives. But if you want small bills then it is worth taking few hours to consider the big picture before buying solar.
As mentioned, The Good Solar Guide is now available online for free. I have made it free because I want as many people as possible to have access to the information before they buy a solar power system. If you are considering solar, I recommend going through it first, so that instead of disappointment, you are pleasantly surprised when you get your first electricity bill.
Footnotes
- Enphase are trialling using Solar Analytics software with Enphase monitoring hardware – let’s hope the trial is successful so all Enphase owners can simply connect their systems to Solar Analytics without any need to install more hardware ↩
- unless I am too stupid to find it ↩
- kW = Wh / time-period (h) / 1000 = Wh /0.25h / 1000 = Wh x 0.004 ↩
 RSS - Posts


You can check instantaneous generation by going to your Envoy home page, ie just type the IP address of the Envoy (shown in the LCD window) into a browser.
An excellent article Finn, well compiled.
Third party monitoring technology is an absolute must have technology moving forward.
Functionality is further enhanced through the inclusion of built in “system dynamic controls”, which is essential functionality for Off Grid and Microgrid Solutions (Monitoring & Control Systems) but also will quickly become mainstream for On Grid Solutions.
Well done Finn.
Lawrence Coomber
I’d offer some further advice (probably not wanted) – check out the cost of a decent roof mounted evacuated tube system for hot water (say at least 50 or 60 tubes in Tassie), ideally combined with an instantaneous gas hot water heater (if natural gas is available). This is by far the cheapest and most efficient system. Using solar electricity from panels to heat your hot water, even with an expensive heat pump is still not as efficient as heating the water directly with solar radiation, especially in Tasmania during winter where the heat pump has to work overtime because transferring heat comes at a much higher temperature differential.
I’m also confused as to how he could be using off-peak electricity to run a heater – surely it would only run in off peak times?
Looking at Steve’s winter power bill and living in Tasmania myself I would suggest that a lot more of his hot water tariff charge is being spent on powering that old heat pump than to heat his hot water. You don’t say his family circumstances but I’ll almost wager he is single with no kids as a wife at home would be using more power during the day so how much actual hot water could he be using ?).
In Tasmania we all have our heat pumps running on the hot water circuit because it is almost half the cost of the ordinary light and power and that is what bumps the winter bills up so much – not hot water usage (unless you have teenagers !).
For Enphase users who might find it a hassle to find their Envoy IP address – type http://envoy into the browser you use……
then book mark the page
After reading an article in Choice magazine about solar PV systems and seeing that they recommended Solar Analytics’ system, I thought that it seemed like a good idea to get one retrofitted to my existing system. Solar Analytics provided me the details of a reseller in my area. I contacted them but I found that they only install the module with a new system. I contacted Solar Analytics and they have found someone within 10 Km of my place who could do a retrofit. He asked for images of my switchboard and inverter set up, which I have sent some time ago. I haven’t heard anymore from him. I accept that he may be quite busy, but an acknowledgement of my e mail would have been nice, and a quote for the work would be good too. I’m going cold on the idea now, as I use the display on my inverter to build a spreadsheet data base of my electricity consumption etc. Solar Analytics would make it a lot easier though. I’m still waiting.
Hi Finn,
There is so much that the consumer needs to understand about solar isn’t there. But I also think that installers need to be aware of the consumers needs. Correct me if I am wrong, but I thought it was standard practise, or common sense for solar panel installation companies to at the least check and inspect a consumers previous yearly power consumption and help them understand how to achieve the best outcome before quoting what size and type of solar installation is necessary for them. If this had have been done maybe the correct system would have supplied in the first place and you would not have had to go through this exercise.
There are other suppliers for energy monitoring including Effergy Engage. I’m not recommending them as they have no TOU built into their cost system (I’m not sure Solar Analytics do either?) and they can require some changes to the switchboard but this is probably true of any energy monitoring system.
You can organise it yourself with just an electrician who knows what they are doing. I did – but I did some research and worked out what changes had to be made before hand and told the electrician what to do.
Just a moment to remind owners of old hot water systems that many of them include a sacrificial anode to reduce corrosion. When its sacrificed itself your tank starts to corrode and soon after you have 100 gallons of hot water sloshing around your floor.
Install your next HWS outside or in a dam with a drain to outside. Or replace with a heat pump or solar system.
Incidentally do the vacuum solar systems suffer from icing up? From what I’ve read the reverse flow valve eventually fails and you get a big bill. If this is true it makes sense to use solar electricity to heat the hot water, I think I have read that people use a separate couple of panels for the hot water so they don’t exceed the max allowable generating capacity.
Vacuum tubes do not suffer from icing up as no water flows through the tubes themselves. Instead they have a heat transfer fluid built into the sealed copper rods inside the vacuum tube. The copper tube filled with heat transfer fluid heats up and expands into a copper bulb at the end of the rod which is in direct contact with a copper manifold that carries the actual water to be heated. Think of it like a molten salt heat storage system – although I’m not sure exactly what fluid they use inside the copper tubes.
The copper pipe used to supply the hot water could ice up but controllers have a safety cut off that senses the temperature and stops them from trying to pump in that situation. They are rated down to -12 deg C and suitable for the coldest Australian conditions.
Why not use PVoutput for monitoring, comparing the production and consumption data?
I use PVoutput. As far as I’m concerned it is all I need. I have a pretty good handle on my own consumption habits so don’t see the need to track it real time. I know when I’ve popped the toaster.
I also don’t buy the argument that monitoring my system in real time is essential to spot something failing. I’ll see it soon enough with PVoutput and a casual eye on the weather.
I agree, you don’t need to monitor it real-time to find the system is not working. However, it’s very hard to pinpoint if most of the panels are working properly and overall system is looking to function properly.
I think panel level monitoring and reporting should be an essential feature so that anyone can pickup these issues timely and consumers don’t have to rely on installers for ongoing monitoring.
I liked the above guide and debugging process but not sure why PVoutput is not mentioned, when it’s such a useful tool and could be helpful for production/consumption monitoring, performance comparison etc.
Thanks to Ashish and Scott for the tip about PVoutput. There’s a wealth of free PV software tools to be found on various websites which could be handy to those people who love crunching numbers for themselves, or simply want to gain better understanding.
You can find a large number of links to various tools (including PVoutput) located on ‘photovoltaic-software’ com. That website also has links to websites such as PVwatts which is mentioned elsewhere on SolarQuotes
Remembering always the old saying – ‘ Little knowledge can be a dangerous thing” , one might at least learn enough to better recognize how ‘even more dangerous than ourself’ some PV system sales people can be. There is thankfully, still a difference between ‘little’ and ‘microscopic’.
It’s also reassuring to use the various tools available on photo-voltaic software, and then compare their results to those shown by any software provided by your inverter manufacturer, and find you get much the same answers.
Hi Finn, just wondering if my comment ended up in spam again.
Cheers,
Darrell
Can we get ris of this #@%$! ?
“You are posting comments too quickly. Slow down.”
Solar PV Installations Monitoring & Control technology (it’s not just for system owners)!
On-Grid Solar installations already have in place rules and regulations (via a written contract already in place) that networks and electricity retailers are entitled to enforce with customers (commonly referred to as the network service agreement fine print). These contracts are all encompassing ones formulated by the networks and electricity retailers without negotiation with the customer.
Importantly, these contracts involve customers agreeing to allow utilities to control the entire “system to grid interface” functionality of a customers solar /battery installation, and particularly system performance as it applies to grid feed in power and battery system charging and discharging logic controls.
As the number of grid connect systems increase, the more sophisticated will become the “system to grid interface” control algorithms, applied to customers systems.
Third party “approved by the network” monitoring and control systems (similar to the current network smart metering arrangements) will become mandated by networks to be fitted by customers to their systems (at the customers cost) in order to be eligible for an initial On-Grid connect approval. In the case of existing systems, the owners will be given a short period to retrofit a third party “approved by the network” monitoring and control system, to remain compliant as an On-Grid installation.
Lawrence Coomber
Like most of your posts Lawrence very informative. Not sure what it had to do with the discussion but that info should definitely be posted somewhere.
If the point was you can now get a lot more info just from your supplier then that has been my experience with AGL. If it was more of “utilities have you by the short and curlies” then I also agree 🙂
Hi Lawrence,
Your comment is very informative and verifies what I’ve long suspected, being that retailers are looking to control as much of the connected PV systems as they can. It minimises their losses as well as helps them control base line power balances. I can appreciate both, however it does not explain my situation, recapping- my power consumption for identical periods of summer 2018 and 2019 was fairly similar, in fact having increased by 6% when I’ve installed a 13kw PV system half way through my billing cycle! I’m using the Fronius web site for monitoring and it is actually very good in giving me all the necessary info I want. The system tells me that I have used about 225kwh more for the period it has been installed for, than I’ve generated. However checking daily graphs I can see that during peak generating times I’m putting heaps into the grid. The burning question for me remains that how can I possibly have used 6% MORE than for the same billing period last year, when my consumption habits have been fairly similar?
Kurt third party system monitoring and control science and technology is a huge and mature industry in its own right and a much bigger global industry that the renewable PCE industry.
It has always been my foremost priority recommendation to PCE design engineers / manufacturers to take notice of this point and not attempt to reinvent the wheel regarding semi intelligent monitoring and controll technology embodied within the functionality of the PCE itself.
The current approach by manufacturers is a dead end road. It leads to weak (non specialist) solutions incapable of achieving a high level of semi intelligence through the lack of precision and breadth of I/O capability for one.
Importanly it is a very high risk strategy subverting the primary PCE functionality to the high MTBF probability of PCE intrinsic monitoring and control circuits.
You will soon see A shift towards PCE ‘outside of the box’ specialist monitoring and control solutions, as iOT technology and standardised protocols for sensors and transducers get traction.
Lawrence Coomber
I hear what you are saying Lawrence, but how much more monitoring equipment do you think the average Joe needs to see what is happening with his brand new PVs at any one time? The solarweb web site has good functionality, it tells me what I’m generating from each inverter, what I’m using, sending to the grid at any time of day every day, month, year and totals. I can type in the parameters I wish to view and it puts everything into a nice multi coloured graph. It also monitors current flows between PV, Grid and Home with a slight time delay, dependant on internet speeds, I guess. There is also a provision for batteries, whenever that happens. It only requires the install of a smart meter, (not to be confused with the retailers ‘smart meter’) and the basic setup and commissioning of the system, which is done at the beginning. There are a number of other parameters, which I have absolutely no idea what they mean, but they would only make the graphs look busier than they need to. I agree with the importance of monitoring, but there is no need to make it more complicated than it needs to be, unless you’re a real stickler for statistics. ;^)
Hello Finn,
We are currently building a new two story house in Sydney and this story got me thinking. As far as solar panels go should you wait until you know your new consumption in both winter / summer before trying to dimension what size of solar system you need? This would mean waiting a full year though ….
Builder doesnt do solar so will have to do ourselves after build complete anyway.
Some general info if it helps … House is 52 squares, north facing rear yard, has 2.5 insulation all external walls and 4.0 ceilings, fully ducted AC unit (Actron Air ESP Ultima Unit – SRD233C 23kw), rinnai instant gas system for hot water, pool filter and heating (heat pump) with exact specs tbc (pool equip. not installed yet), led downlights/floodlights etc.
Hello Anthony, Ronald here.
I don’t think you should wait to get solar. In my opinion, at today’s solar prices, the best option is to simply install as much as can reasonably fit on your roof:
https://www.solarquotes.com.au/blog/fill-your-roof-with-solar/
With your pool and an air conditioner that can draw 6.5 kilowatts of electrical power (23 kilowatts is its cooling power) I expect your home will use a lot of energy. But for the solar energy you don’t use you will receive a feed-in tariff, so it is still of benefit to you.
If your home will have a 52 square meter footprint you won’t have a large roof so you can consider using south facing panels to increase the size of your system. The average output of south facing panels will be about 28% less than north facing ones but but because solar has come down so far in price and grid electricity is so expensive it can still be cost effective. But note south facing panels will produce most of their output in summer and little in winter.
It may also be cost effective to use a heat pump or a standard hot water system for household hot water. If this lets you do without a gas connection it could be cost effective as it will let you avoid the daily supply charges that apply regardless of how much gas you use.
Hey Ronald, thanks.
I meant 52 squares (52 sqs), which is approx 482 sqm … roof space from basix certificate is 320 sqm.
Just wondered how big you go re solar ie. 10kw system or something when not knowing how much you use. I’ll take a read of your other blog post.
Also, am I dreaming or what there a time when there was a kilowatt limit on the size of household solar systems?
Will look into things in the new year once house gets closer to completion.
Sorry, I thought you were building a little Japanese style home there. Because you’ll have a lot of roof space the limit on solar will depend on whether or not you have 3 phase power. It will depend on the distributed network service provider where your home is but generally there is a limit of a 5 kilowatts of solar inverter capacity for homes with single phase power and 30 kilowatts of inverter capacity for homes with 3 phase power. With a 5 kilowatt inverter you can install up to 6.66 kilowatts of panels without problem and with a 30 kilowatt inverter you can install up to 40 kilowatts of panels.
If you have single phase power you can install larger solar system if you export limit it. This is likely to make sense for you as you can set your pool filter etc. to run during the day. You can also consider getting something like a Fronius relay which can switch on your pool’s heat pump when there is enough surplus solar power being produced.
https://www.solarquotes.com.au/blog/using-fronius-inverter-smart-meter-relay-make-solar-electric-hot-water/
Given how much energy pool heating requires you are probably going to want to install a lot of solar.
The 29th November was a rather hot and humid day in my area, and I used two inverter air-conditioner for a good portion of the day.
Checking the numbers – my total usage jumped 7 Kwh units due solely to the added consumption, however 6 of those were contributed via ‘self-consumption, pushing my self-consumption ratio up to 66%. As well, due to a very good production level from my panels, I still sent surplus electricity to the grid ( which no doubt helps reduce the load on the local grid). So in essence my own air-conditioning costs for the day were zero.
I should emphasize though, I didn’t achieve that simply because I installed solar panels on the roof and hoped for the best. I ‘rescheduled’ the timing of a couple of activities ( laundry and dishwasher), kept the air-con temperature setting at 26 degrees etc in order to minimize the total power demand.
Prior to installing my current solar PV system, I’d followed the valuable advice I’d found on Solar Quotes, and did my best to ‘optimize’ the relative split between North and West facing panels. I also know pretty accurately the power likely to be used by other ‘high-consumption’ items such as washing m/c etc, the times when the T3 hot water system normally draws power from the grid and so forth.
To get the most out of your solar PV system, you need to do that kind of ‘homework’, and change your ‘consumption timing habits’ somewhat, in order to maximise the benefits. One thing that always surprises me is that people will do all kinds of detailed research when buying a new motor car eg, fuel consumption, make of airbag, luggage compartment room, scheduled maintenance needs and its cost etc, but will blithely spend a possible similar significant amount (ignoring any subsidy) on a PV system and do little or no research of their own.
Thanks for this great article, was an interesting read.
My question is, how does solaredges production and consumption monitoring app compare to solar analytics? Would you spend extra to get solar analytics if you had solaredge?
Text,our answer would be to install a generac unit.Our goal is to have power daily.Do they make a meter to tell when our power has been,how many times and how long.This needs to be monitored.All our power co. wants to do is ride new trucks and do nothing and they are robbing us poor people and there’s nothing we can doGovern these people.I can’t ride around in new trucks.My truck is 20 years old and I have no way of changing that.I just have to keep patching it up to keep ity goiong.These high hosp. bills keep my credit ruined.Help if you can