
If you have decided to invest in a hardware consumption monitor to measure your solar energy flows, there are three prominent options on the market:
- Buy the inverter manufacturer’s consumption monitor and use the inverter manufacturer’s monitoring software (subscription-free for most inverters).
- Buy the inverter manufacturer’s consumption monitor and connect its data to the ‘Solar Analytics Integrated’ solution ($6 per month or $60 per year).
- Buy dedicated ‘Solar Analytics’ hardware (made by WattWatchers) which communicates via 4G to the ‘Solar Analytics Classic’ solution ($6 per month or $60 per year).
If you have rooftop solar, but don’t want to pay for a hardware monitor, and are happy with seeing day-old data, you can use your retail smart meter as a pseudo-consumption monitor using ‘Solar Analytics Integrated+’, which Finn explains in depth here.
Many other third-party monitoring options are available, but this is a review for people considering whether they should pay extra for Solar Analytics or use their inverter’s consumption monitoring.
In this review, I’ll compare your options using the free Sungrow monitoring software as the challenger.
I’ll explain:
- The difference between Solar Analytics ‘Classic’ and ‘Integrated’ monitoring systems, and the pros and cons of each.
- Compare Solar Analytics with Sungrow inverter monitoring.
- Show a real-life case study, including removing hardware, connecting devices, and comparing functionality between monitoring solutions.
Solar Analytics Classic Vs Integrated
Solar Analytics Classic
The ‘Classic’ option uses additional hardware, in the form of a device that is installed in the customer’s switchboard. Sensors (AKA CT clamps) are connected to the device and clamped around the measured circuits.
Solar and consumption data is transmitted via 4G (goodbye 3G) every few seconds, analysed by Solar Analytics software, and provided in (almost) real-time to the user.
The ‘Classic’ solution is flexible, and designed to be compatible with any inverter or AC load.
Solar Analytics Integrated
The ‘Integrated’ subscription allows direct access to solar data via the inverter, eliminating the need for the add-on hardware mentioned above. It relies on WiFi or ethernet connectivity to send data in 5-minute intervals.
This option offers several advantages, and of course, some disadvantages. An additional consumption monitor is needed if you want to measure consumption data. This is not mandatory but strongly recommended. Some inverter and battery manufacturers provide a consumption monitor in the form of a smart meter, so it may not be necessary to buy one.
The other downside of the “Integrated” model is that it’s only available to an exclusive club of compatible inverters – Fronius, Sungrow, Goodwe, LG, and GE. Solar Analytics assures us that this list is growing.
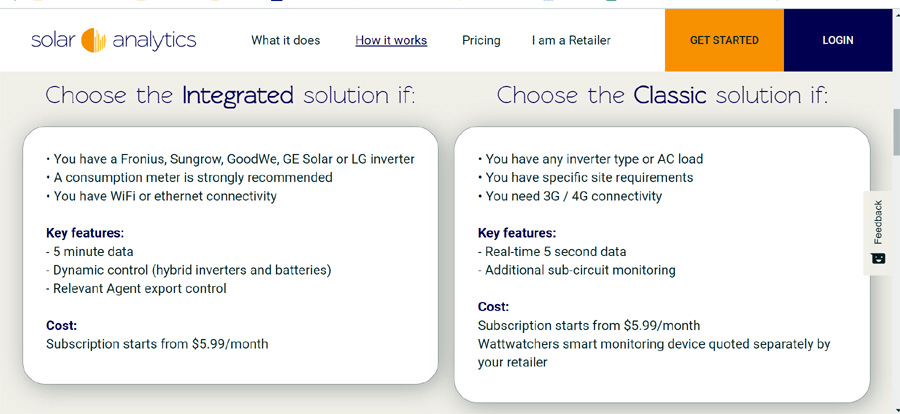
Solar Analytics subscription plan overview. Image: Solar Analytics
The Pros And Cons of Solar Analytics Subscription Models
‘Classic’ Pros
✅ Comprehensive Real-time Monitoring: Allows you to closely monitor both solar generation and electricity consumption in real-time.
✅ Versatility: It is compatible with various inverter types and AC loads.
✅ Sub-Circuit Monitoring: Includes the additional feature of monitoring specific sub-circuits such as hot water or heating systems.
‘Classic’ Cons
❌ Additional Costs: In addition to the monthly subscription fee, a smart monitoring device will need to be purchased and installed by a licensed electrician.
❌ No Battery Monitoring: This can be a drawback if your solar setup includes battery storage.
‘Integrated’ Pros
✅ Direct Inverter Data Access: Accesses solar inverter data via APIs, eliminating the need for an additional monitoring device. This simplifies the setup process.
✅ Reduced Costs: No smart monitoring device is required for measuring solar data. (A device may still be needed for measuring consumption data).
✅ Battery System Monitoring: Unlike the Classic subscription, the Integrated subscription can monitor battery systems.
✅ Advanced Features: It offers additional features such as dynamic control for hybrid inverters and batteries, and ‘Relevant Agent’ authority.
‘Integrated’ Cons
❌ Limited Inverter Compatibility: Only compatible with specific solar inverter brands, such as Fronius, Sungrow, Goodwe, and GE.
❌ Consumption Meter Required: To fully utilize the Integrated subscription, a consumption meter must be installed.
Connectivity Options for Solar Analytics
‘Classic’ utilizes the 4G mobile network to transmit data. ‘Integrated’ relies on a WiFi or ethernet connection. Either could be a blessing or a curse, depending on your particular location. Typically, a hard-wired ethernet connection is the preferred option for any device to avoid dodgy WiFi drop-outs or issues with a lack of 4G network coverage.
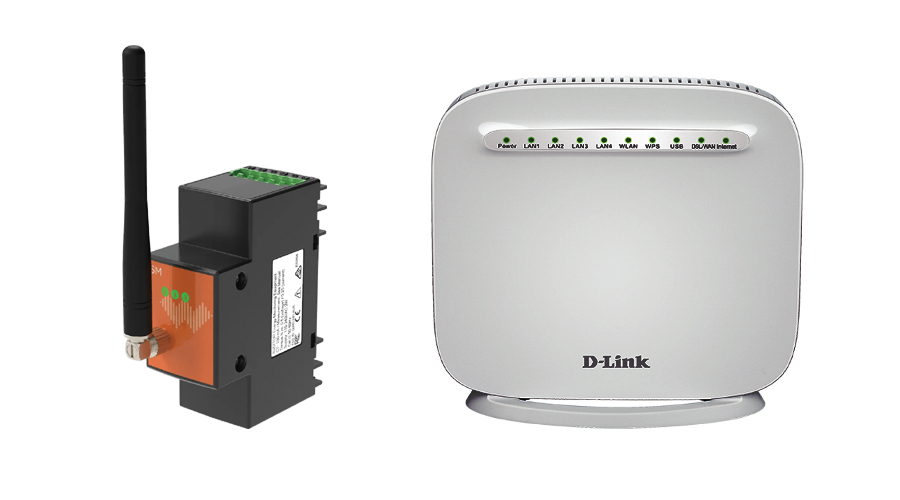
Left: Wattwatchers smart meter transmits on the 4G mobile network (for ‘Classic’ connectivity). Right: Home WiFi/Ethernet router (for ‘Integrated’ connectivity). Images: Wattwatchers and D-Link
Proprietary Inverter Monitoring
Most popular inverter brands available in Australia come with their own proprietary inverter monitoring platform, so why not just use that?
Good idea. Why spend more cash on bells and whistles for a rooftop solar system you bought to save yourself money in the long run?
And therein lies the answer – ‘saving yourself money in the long run’.
First, let’s look at why anyone would be interested in monitoring at all: Solar and consumption monitoring enables real-time tracking of energy production, understanding energy usage patterns, and identification of optimisation opportunities, ultimately leading to cheaper electricity bills.
These things can save you money. The problem is that not everyone is an energy geek, glued to their respective devices and apps, trying to determine the best time to export to the grid or turn on the hot water system.
That’s where Solar Analytics steps in. It has features that keep an eye on the big picture, so you don’t have to. It can alert you when there’s a problem, find the best electricity plan based on your usage patterns, and recommend battery size based on your accumulated energy data.
This is starting to sound like an advertisement for Solar Analytics, but I can assure you it’s not. Many proprietary inverter monitoring apps do a great job and may be all you need. Due to the number of inverters available, it’s not within this article’s scope to list each one’s pros and cons.
I can, however, show you a case study in which a solar/battery owner ditched his old Solar Analytics 3G smart monitoring device, and now uses the ‘Integrated’ subscription in conjunction with the proprietary inverter monitoring app, to get the best out of both worlds. And that solar/battery owner happens to be Finn Peacock, the founder of SolarQuotes.
Case Study – Solar Analytics ‘Integrated’ Vs Sungrow iSolarCloud
Finn had a battery installed to his existing rooftop solar system on a property in March this year. This provided a good opportunity to remove his soon-to-be redundant Solar Analytics 3G monitoring device and move from the Solar Analytics ‘Classic’ subscription to the ‘Integrated’ subscription.
He’s had about three months to monitor the system, collect some data, and compare with the proprietary app (Sungrow iSolarCloud) that came with the battery/inverter. Let’s take a look.
System Specs
- Solar Panels: 6.6kW Winaico panels (12 x 300W panels facing west, 10 x 300W panels facing east).
- Inverter: Sungrow SH5.0RS hybrid inverter.
- Battery: Sungrow SBR128 (12.8kWh of storage).
- Monitoring 1: Sungrow iSolarCloud.
- Monitoring 2: Solar Analytics ‘Integrated’ subscription.
Removing The 3G Monitoring Device
The original monitoring device installed in the switchboard was a Solar Analytics SC-23 3G Solar Smart Monitor. This rebranded Wattwatchers device is no longer available because of the imminent 3G shutdown.
This device was removed due to the 3G phase-out, but also because Finn changed to the Solar Analytics ‘Integrated’ subscription, which measures the solar data via the inverter.
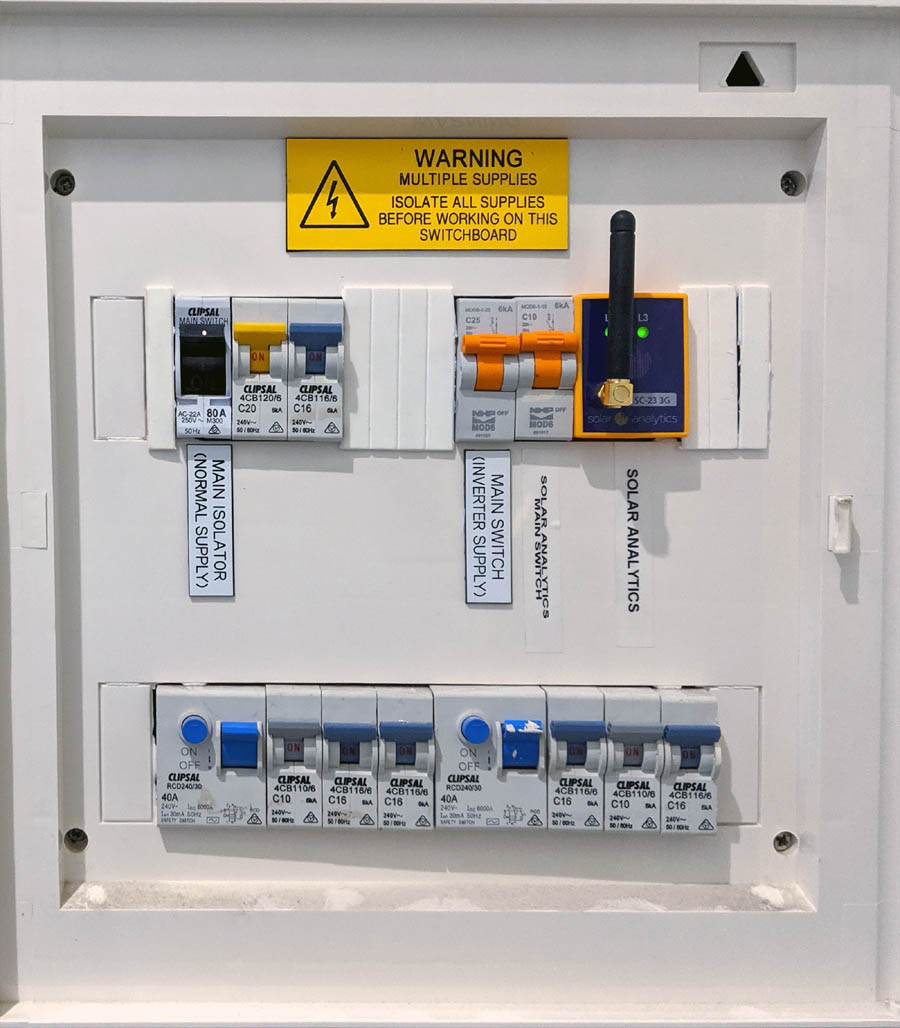
Switchboard with old 3G smart meter.
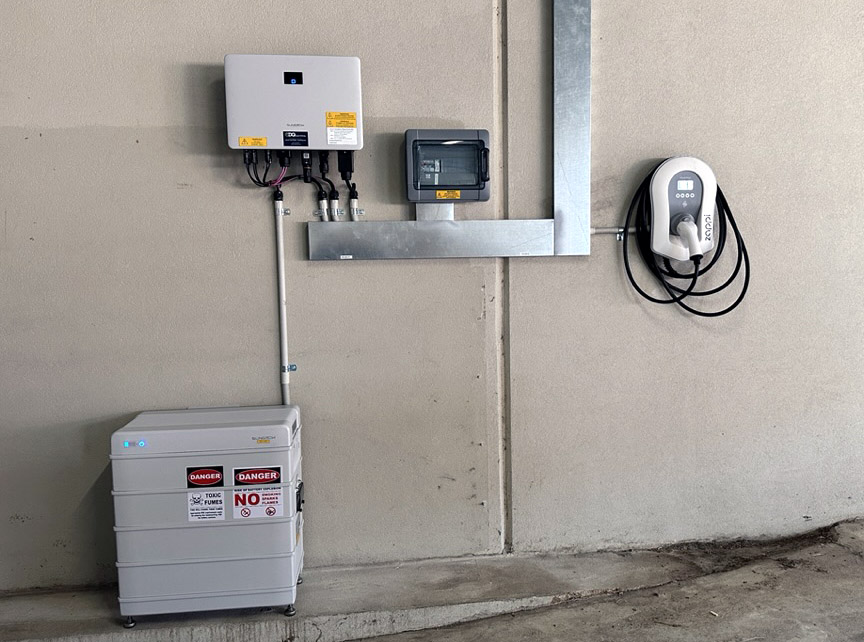
The removal of the Solar Analytics device conveniently left room in the switchboard to install a Sungrow S100 Energy Meter, which would be used to measure consumption data. This device was ‘free’ as part of the battery installation.
The Sungrow Energy Meter comes with a CT (current transformer) that clamps around the incoming supply, plus an RS485 cable connected from the energy meter to the inverter. The removal and/or installation of these devices is to be done by a licensed electrician, so yes, this is an additional expense.
Miser’s Tip: It’s not necessary to remove or disconnect the redundant Solar Analytics 3G device if you don’t want to go to that expense. It will quite happily sit there transmitting data out to the world for the rest of its life, even if no one is listening. However, removing it would make sense if another meter was being installed, as was the case here.
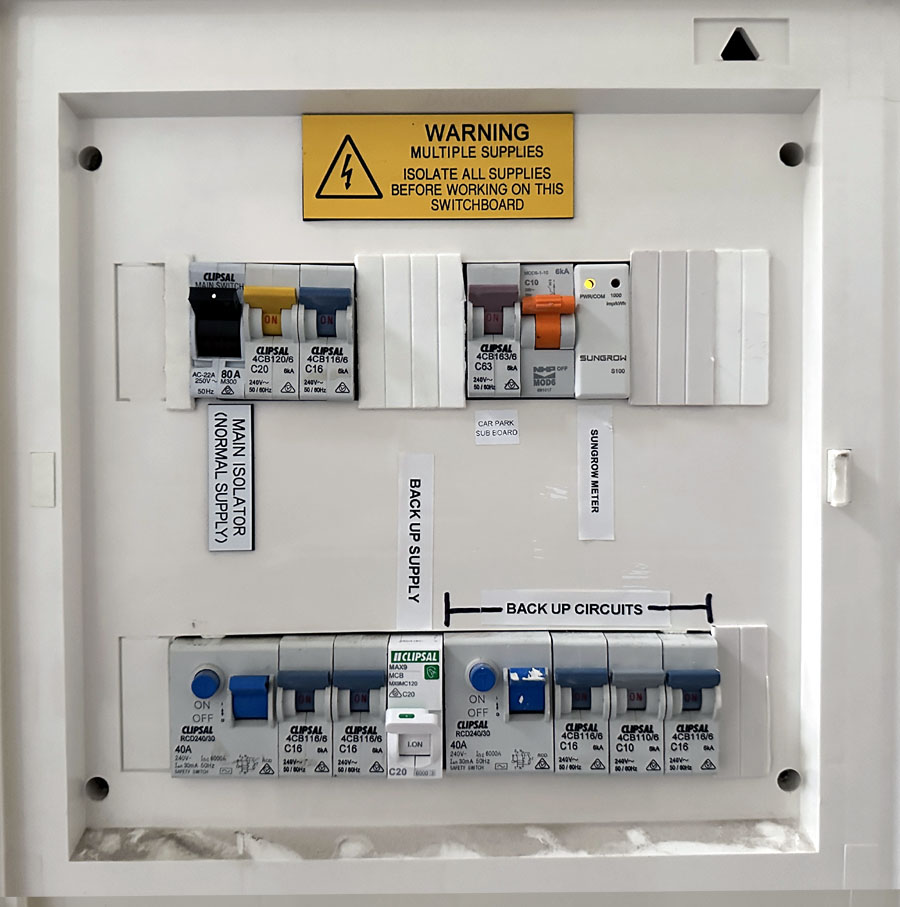
Switchboard with new Sungrow consumption monitoring device installed.
Integration Of Solar Analytics With Sungrow iSolarCloud
Finn tells me that integration was simple.
“I gave the inverter serial number to the Solar Analytics guy. Then I went into iSolarCloud, and to Plant Configuration > Plant > Scroll down > Settings > Add channel Partner > Type in sungrow@solaranalytics. Done.”
After integration, Finn’s rooftop solar and battery could be monitored using either/both the Solar Analytics dashboard and/or the iSolarCloud app. Each has its own benefits.
Overview of the iSolarCloud Portal
After logging into iSolarCloud, and assuming you’ve already registered and entered all your details into the configuration settings, you’ll come you the ‘Overview’ page. This is where all the action happens for the user. Note that the following info is regarding the desktop app, and may appear slightly different on the mobile app.
The ‘Overview’ page is clear and well set out, starting with a nice animated power flow diagram in real-time showing energy flows of PV production/self-consumption, grid purchased energy/feed-in, and battery charge/discharge.
Beside and below that show numerical values for ‘Self-consumption of PV’, ‘Today Revenue’, ‘Today Yield’, ‘Real-time Power’, ‘Current Month’s Yield’, ‘Revenue This Month’, ‘Total Yield’, and ‘Total Revenue’.
Scroll down a bit further to find historical data by clicking on buttons for ‘Day’, ‘Month’, ‘Year’, and ‘Total’. You can select any day/month/year you like. The data is output nicely on two pie/circle charts, and a linear chart for easy viewing.
The two pie charts show energy inputs/outputs (PV/ battery/ grid) on the left chart and consumption on the right, broken down into ‘Self-sufficiency’ and ‘Purchased Energy’ with percentages for all.
The linear chart has PV/ Grid/ Battery/ Load data appearing in five-minute intervals, is easily zoomable, and is large enough for visually challenged people like me. The vertical and horizontal movable crosshairs on this chart are particularly good for reading precise values rather than having a bit of a guess.
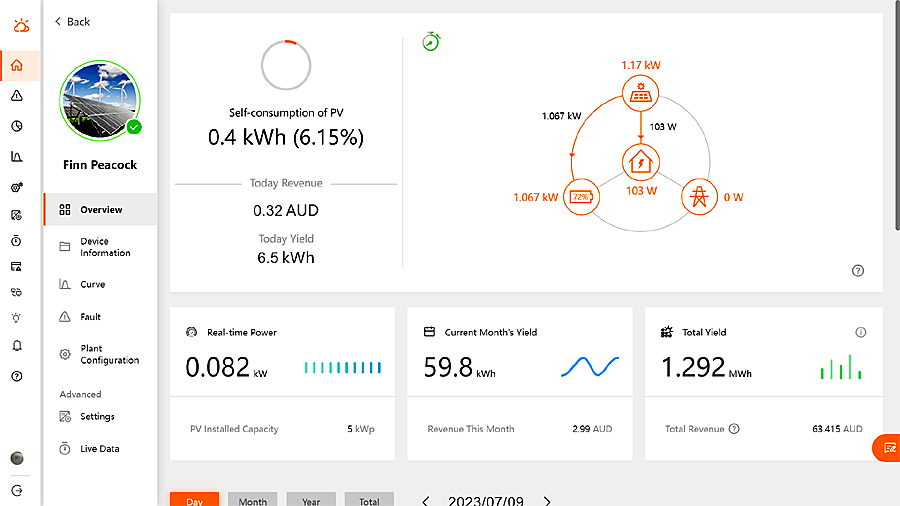
Desktop view of the iSolarCloud ‘Overview’ page. This screenshot was taken at around 2pm on a dreary, cloudy, winter’s day. Although the solar output is low, it’s still enough to meet the small household loads and charge the battery without drawing from the grid.
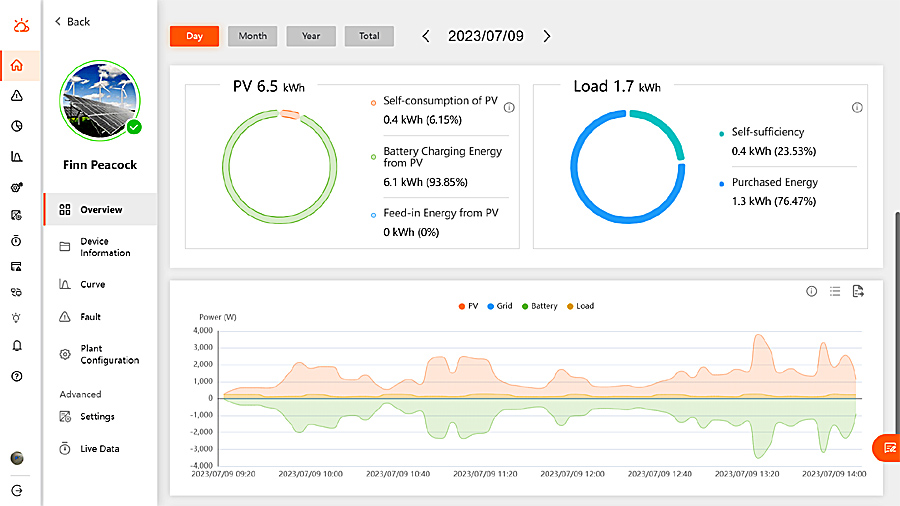
This the scrolled down view of the page above. See the linear chart on the bottom showing the battery charging mirroring the intermittent solar output, while the daily load looks like only standby power.
Additional Features of the iSolarCloud Portal
Without going into full-blown detail, the toolbar on the left of the page lets you access more features. From top to bottom, they are:
- Home – This brings you to a page where you can manage multiple ‘Plants’ (PV systems).
- Fault – Allows you to set up alarms for a wide range of fault conditions.
- Report – Generate statistical reports daily, weekly, monthly, yearly, or customise your own.
- Curve – Detailed histograms are here such as total DC power, phase currents and voltages, MPPT currents and voltages, and grid frequency. These are useful for diagnosing faults and analysing performance.
- Advanced – This tab contains a sub-menu here with ‘Settings’ and ‘Live Data’ amongst others. These are diagnostic tools for the installer/technician. The ‘Live Data’ button gives similar diagnostic information to ‘Curve’, only in real-time.
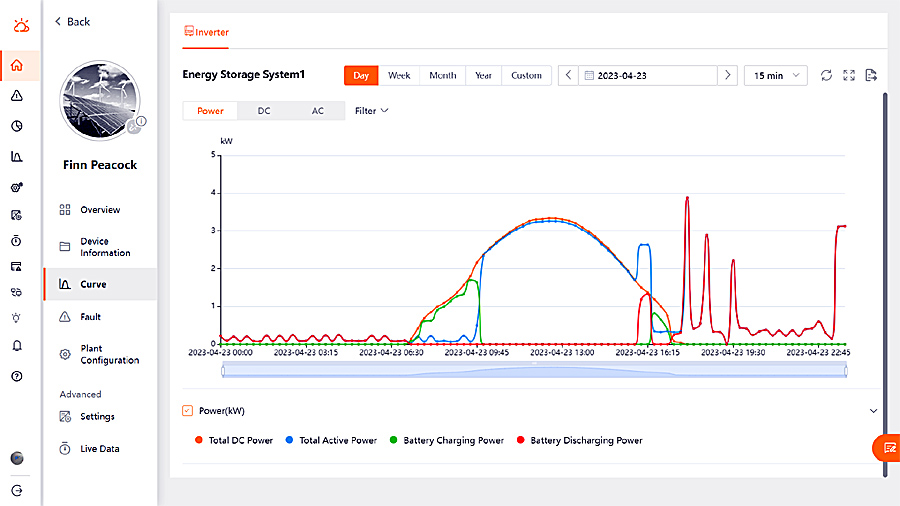
This is a view of the ‘Curve’ page. This screenshot is taken from a sunny spring day with an almost perfect solar curve. The battery tops up in the morning from solar, then helps out to meet demand in the late afternoon.
For comparison, let’s have a quick look at the Solar Analytic portal.
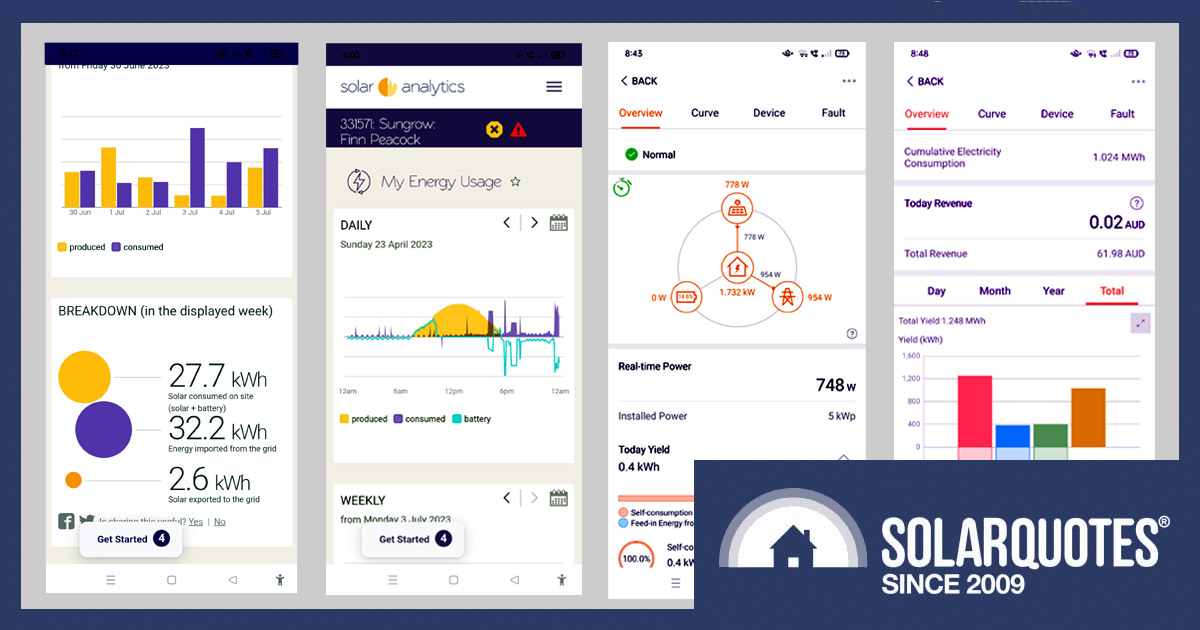
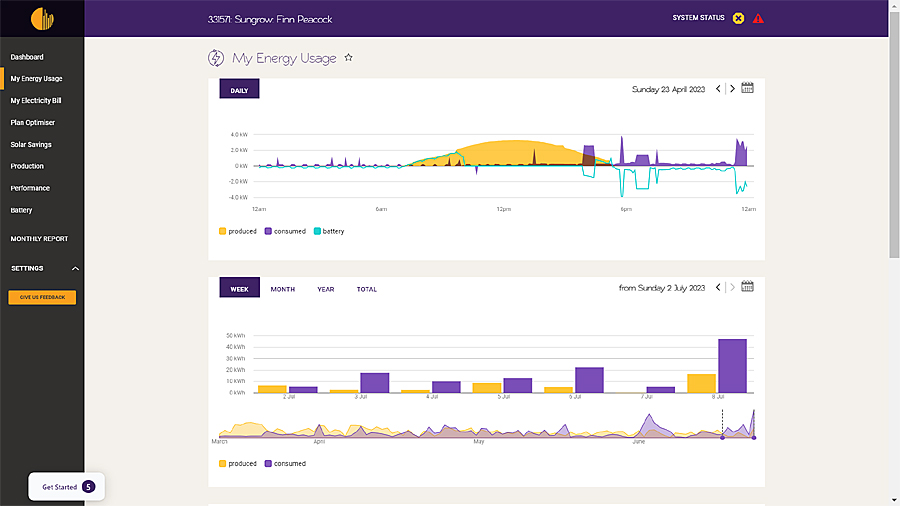
Solar Analytics ‘Integrated’ Portal Dashboard
Logging into the Solar Analytics portal brings you to the ‘Dashboard’. This starts with a linear chart showing energy produced and consumed today with data logged in 5-minute intervals. The chart is clear enough, but the iSolarCloud one is larger and gets the win for the visually challenged.
The other thing disappointing about the Solar Analytics portal is the absence of live data, particularly the real-time animated power flow diagram. There’s something satisfying about watching those little arrows pushing electricity into your house from the solar panels, and filling up the battery.
Back to Solar Analytics. Under the linear chart are large clickable buttons ‘System Performance’, ‘My Energy Usage’, ‘My Electricity Bill’, ‘Solar Savings’, and ‘Plan Optimiser’. These buttons show basic information such as relevant numerical totals etc. Clicking on each of the buttons takes you to a more detailed page with charts, histograms, and breakdowns. The toolbar on the left of the page navigates similarly.
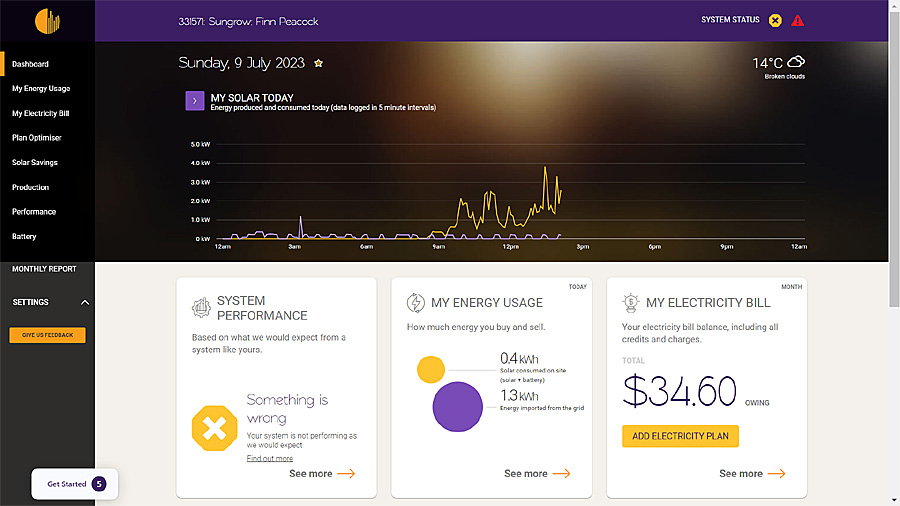
Desktop view of the Solar Analytics ‘Dashboard’. This is a screenshot taken at exactly the same time as the first iSolarCloud screenshot above. See the intermittent solar output in a more compressed view. Notice also the ‘System Performance’ icon is letting Finn know that his system is underperforming. Clicking on the link will give further details and steps to take.
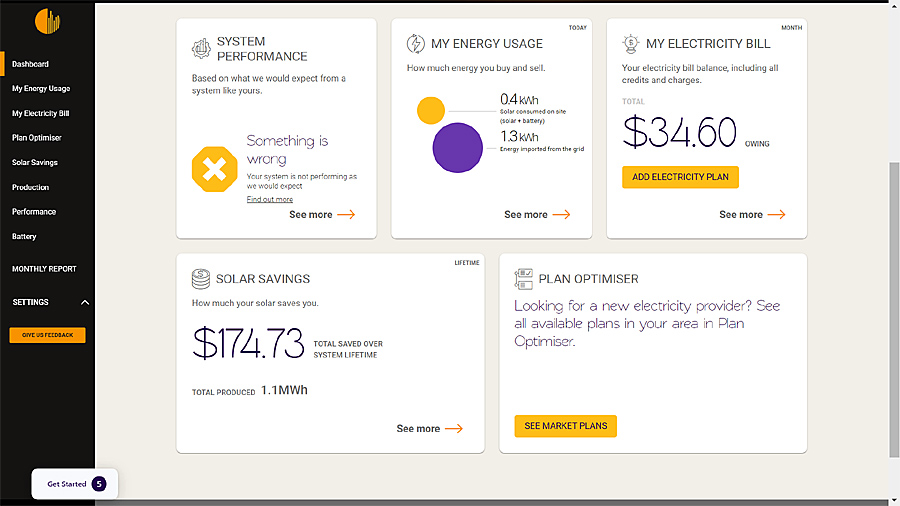
This is the scrolled-down view of the rest of the page (description above). See again his ‘System Performance’ notification. Finn is too busy at the moment, but he’ll get around to following this up, and we’ll let you know the outcome.
Best Features of Solar Analytics
The standout features of Solar Analytics are, without doubt, the ‘System Performance’ reports, and electricity ‘Plan Optimiser’.
- System Performance
Measures the actual energy production from your solar power system compared with the expected energy production based on a combination of historical data, location, and weather. It notifies you when something isn’t quite right, and recommends an action. - Plan Optimiser
Looks at your solar and consumption data, to compare available market electricity plans with your current plan. These show projected (not actual) savings based on previous data. The more data you have, the more accurate projections may be.
This is a Solar Analytics view of the same sunny spring day shown on the third iSolarCloud screenshot above. The same detail is there, but not as large or zoomable like the iSolarCloud view.
One More Option for Solar Analytics Connectivity
Finn could have upgraded his 3G smart meter with the current 4G version and kept using the Solar Analytics ‘Classic’ subscription. This would have given him real-time monitoring, plus the ability to monitor sub-circuits within his installation, but no battery monitoring, or advanced features such as dynamic control and ‘Relevant Agent’ authority.
No problem – the Sungrow iCloud app would handle the battery monitoring, plus a more intuitive real-time display for all power flows. Also, upgrading to a Solar Analytics 4G device comes with the added expense of buying and installing another device.
Would I Upgrade to Solar Analytics or Stick with Sungrow’s Monitoring?
Monitoring apps for both solar and consumption are so useful, I’d go as far as saying they’re a must-have for any rooftop solar system. This is particularly so as the system gets more complex, with additional factors to consider such as batteries, EV chargers, TOU tariffs, DNSP shut-down requirements, etc. As usual, there is no ‘one size fits all’ solution. Each monitoring platform has its benefits and shortcomings.
I’d Choose Sungrow
From my perspective, if I had to choose only one of the options listed above for a solar + battery system, it would be the Sungrow iSolarCloud. The display, plus the depth of diagnostic tools is the deal-maker for me.
Non-Energy-Nerds Should Get Solar Analytics
For the average Joe/Jolene, who isn’t an energy nerd, and is time-poor, I’d say Solar Analytics Integrated is the way to go. The ‘System Performance’ and ‘Plan Optimiser’ features take the hard work out of it. We all want an easy life. The $6 per month will put many people off, but just the savings from the retail plan optimisation tool should more than cover that cost.
After I’d written this article, I asked Finn some questions to see if we were on the same page. Almost!
What do you miss most about the old Solar Analytics monitoring now that the 3G device is gone?
“I miss the extra channels for measuring individual appliance usage – for example seeing how much hot water the kids are using with their bloody 30-minute showers at midnight!”
If you had to pick only one out of – old Solar Analytics vs Solar Analytics integrated vs Sungrow iSolarCloud, which would you choose for (a) yourself, and (b) a solar newbie?
“Solar Analytics integrated. I’m a firm believer that you should always have monitoring with your solar. If you buy the inverter’s monitoring (integrated) instead of Solar Analytics (now Wattwatchers) hardware – you are much more likely to be able to integrate it with a future battery or solar smart EV charger. For example, if you have a Fronius inverter, it needs the Fronius smart meter to talk to the Fronius EV charger, or to control a battery (with the new Gen 24 inverters). And I think the $60 per year is worth it to get an early warning if there’s a problem with your system. Speaking of which I really need to go and figure out why my system is only performing at 75%…”
 RSS - Posts


Being a technology Luddite, I find the sungrow system adequate for my needs. Sungrow 13 kW panels and 25 kW battery
Installed a year ago in Darwin by GEM. Power bill down to almost nil.
I use a combination of both platforms, as I added the Solar Analytics Classic as part of my install with the Sungrow inverters, I don’t have the Sungrow Energy Meter though.
For me, I find that Solar Analytics is better for a quick overview view of the information I care about – how much am I generating and how much am I using. Admittedly I don’t get usage info in iSolarCloud since I don’t have the Sungrow Energy Meter, so that does mean I’m only getting partial info in there.
One big win for me with Solar Analytics was the integration into Home Assistant, someone had produced an integration that was easy to add and I’m able to pull the data from their API so I can view that in my automation platform. I struggled to find something comparable from Sungrow for my inverters (although given they are on my network there’s probably something possible that I could do).
Another potential selling point of Solar Analytics is the sub-circuit monitoring that you can do (at least, with Classic), so you can have specific things, like an AC, EV charger or whole room added to the dashboard (https://info.solaranalytics.com/s/article/Isolate-the-sub-circuits-consumption). My only wish is that I could send up my own data for that too, since I have local power monitoring on circuits that I want to add to the visualisations and (hopefully) enrich the data that they use for giving me predictions. I don’t believe you can do that with iSolarCloud.
FYI to help with understanding I’m a user of Solar analytics classic 3g/4g I love it. I can see pool usage separate to house. Live usage helps to see when best to use appliances.
Be aware if you have iContled load 2 which is what. I have for hot water is that Solar Analytics ca can’t capture CL2 usage .
6.5kw REC with Fronius 5kwh inverter
Of the total watt usage of my house monthly half is for the hot water. Circa 450kwh per month
max production of my system is 36kwh a day.
export approximately 1
Currently for our household of shift workers Origin TOU is best energy provider – due to the Controload 2 cost.
The reduced FIT from 22c/21c( install 2019 to June 2022) down to the current first 14kw/day and 7c every kWh after has been a $50 increase . Note. The recent energy increase by origin was offset by increasing to 7c that FIT Ffrom 5c – no obvious difference really but bjust as fyi in case you export a lot.
If export on average 14kw per day – being in northern rivers we e had incredible amount of sunshine last 2 months
My panels are all north facing.
Panels Produced 28kwh on shortest day of year 21 June 2023
36.6kwh on longest day 21 December 2022
I got a quote from SMART ENERGY last week when they were in area for battery installation- $24k payment plan with qcell inverter I think it was . Seems a lot of money and doesn’t include my hot water.
Any thoughts from the gurus about what diverter best to change CL2 onto solar and when replacing hot water eventually what do I replace with to capture directly. From Solar (still gathering information and eager to learn and understand).
Many thanks for reading
Cc
Your best diverter option (assuming single phase as you seem to be) is the Catchpower Green
It will also allow you to keep your CL2 (if it is not an additional daily charge) and use that as a “backup” if your water has not heated sufficiently during the day.
If you wanted to see realtime data you could look at an emporia vue which will allow you to monitor upto 16 circuits (solar, battery, HWS, CL2 etc etc)
Craig
Where are you located? My understanding is that in QLD you cannot have the HWS both on solar and on CL, but in other states you may be allowed to have that setup.
Nice comparison, Kim. I would be interested in a comparison between Solar Analytics and Reposit monitoring, which I currently use for my solar + battery setup with Solax inverter and charger plus LG Chem batteries.
This seems like a good monitoring solution for many solar installations.
Alas, I am unable to use it.
I have a solar installation without an inverter producing only DC electricity for direct consumption which I would like to monitor.
This installation has been a bit of a problem since it feeds into a DC appliance which, also, uses AC, and it seems to have a current leak which as much as I have tried, I have been unable to stop.
Moreover, finding a monitoring solution is even more of a challenge for DC.
My direct DC solar installation produces close to 300 VDC at less than 11-amps, and it is difficult to find DC meters for this voltage and amperage.
A very good article covering the topic in a lot of detail. You mention that the Classic solar analytics solution does not allow monitoring of a battery. I believe that it does because it comes with 3CT’s. Since I don’t have a battery, I have asked the installer to monitor my aircon instead of leaving that CT unused.
Could you please elaborate on why it does not offer battery monitoring?
For my part, I have decided to get the Wattwatchers’ device as I had an developed around it that does look and simulations, and was not keen on redesigning parts of it to suit potentially new data structures.
It turns out I need to redesign parts.of the ap.anyway because the CSV download from SA have changed. Instead of getting each circuit as a additional column on the same record, you now have three records for the same timestamp, so you need to do the consolidation into a single table yourself..
The major weakness I find with any other solution than SA, including the Wattwatchers’ software, is that they don’t send out alerts when your system stops producing and from what they say, you cannot set them up yourself. You can define some alerts, E.g. when your usage exceeds a certain level, but there is no reporting of faults on the inverter. This is IMO the most fundamental purpose of a monitoring system, so unless you want to monitor your system actively yourself, SA remains the most robust and automated solution.
For those who like tinkering, there is another option using Raspberry Pi and Home Assistant, all freeware. It’s not an easy plug and play, but again, for those who like to tinker, it’ll keep you busy.
Hi Gaetano. Re your battery monitoring question – Solar Analytics ‘classic’ can monitor energy flows in and out of an AC-coupled battery with a connected CT, but this won’t give the battery SOC (state of charge). To determine the SOC other parameters have to be measured. Also, the CT won’t ‘see’ current flows of a DC-coupled battery because it works using AC induction. The ‘integrated’ subscription works differently. It can monitor the battery using internally measured data from the inverter/battery which is provided by the manufacturer’s shared API and sent via wifi. This data would include the battery SOC.
I see what you mean. Personally, I would monitor the SOC separately with the app that the battery came with, typically if I expect the battery to be supplying or receiving power and it isn’t at any given point in time.
‘Cept it sort of isn’t working (for me). To be fair, solaranalytics have agreed my data isn’t being processed correctly, but it doesn’t change the fact that it makes it fairly useless. Basically it counts my grid usage as negative figures and just logs that again my production and comes up with some very weird usage figures. E.g. that I used 16.1kwh on a day I used 3.74, and that I used 1.4 on a day I used 4. I have a fronius inverter, and confusingly in the short 10 days I’ve been signed up it was coming through correctly only for the first day or so, and since then it’s been very messed up.
I’m getting my actual grid usage from my power company (Energy Australia)
Based on the many reports I have seen on Solar Q&A AU/NZ, this sounds like the CT’s have been installed incorrectly. I’d suggest to post those observations on that Facebook group for confirmation.
What about IoTaWatt ?
I asked my installer (Genr8 Electrical) for Solar Analytics, but shortly before installation, I cancelled the Solar Analytics in favour of IoTaWatt.
I did not like the on going subscription of Solar Analytics and having to use their cloud. But reneging on their former life membership to Solar Analytics was the point that turned me right against them.
IoTaWatt is for nerds, I understand that and I enjoy controlling every thing myself. My data stays with me, if I want to share my data, that is my choice at the time.
– Tom.
We have a 5kW Sungrow inverter with Trina panels.
We use ‘tariff 41’ for heating and ‘tariff-31’ for everything else (on two separate switchboards in the meter box) – we avoided a TOU tariff as the vast majority of electricity use (heat pumps and cooking) is on-peak. We can trickle charge the EV mostly through solar as our mileage is generally low.
iSolar Cloud only tells us what is being exported but doesn’t monitor consumption. I can get an idea from the Aurora+ data, but nothing precise.
I was told by the installer that the Sungrow energy meter wouldn’t work due to our tariff structure, so I’d like to know what the options are!
Thanks!
Any thoughts on Fronius Solar Web vs Solar Analytics?
Paul, Finn wrote this article in 2019 comparing Solar Analytics to Fronius Solar.web…
https://www.solarquotes.com.au/blog/solar-analytics-fronius-smart-meter/
Although it’s based on the Solar Analytics ‘Classic’ subscription I think the essence of the article still stands. You might even see an update some time in the near future.
Does the iSolar thing that goes with the Sungrow SH5.0Rs, dynamically display the BESS State Of Charge?
I cannot find an image, that shows that it does display this.
The regotcha thing that is designed to obstruct communications, and obstruct posts, does not know arithmetic.
It has twice returned that 29 +4 != 33 .
Solar Analytics has really taken a nose dive in reliability. I couldn’t recommend it to anyone. When it works, it’s great. When it doesn’t… the company will jerk you around for months.
When I first got the system it was amazing. I have it tied into my Home Assistant which was the biggest draw card.
A few years later and the SA gizmo goes offline several times every day and no longer seems to transmit real time data even to their own app. Company suppprt more or less shrugged it off (have you tried turning it off and on).
Look elsewhere.