
Over the next week or so I’ll write some articles busting solar myths because, if I’ve learned anything from 25 years of internet use, it’s way easier to complain about something than go through the effort of doing something useful. Today I’m tackling solar energy output in winter in Australia.
Internet commenters have told me, right to my internet face, solar power doesn’t work in winter. These statements don’t even come larded with provisos, exceptions, and caveats. They are bald internet faced lies. While my initial reaction is to roll my eyes so hard I can count all four of my brain cells1 and ignore the idiots, if left unopposed, their nonsense can seep into people’s brains.
To prevent idiocy oozing into people’s brain cells, I’ll show…
- Solar does work in winter.
- In some parts of Australia, it works damn well.
- While output can be reduced in winter, it never disappears.
By the time you finish this article, your brain should be idiocy resistant. This is because exposure to my idiocy acts like a vaccine.
Solar Obviously Works In Winter
It’s easy to see solar power works in winter. Here’s the daily output of a 10.56 kilowatt solar system in Adelaide since it was switched on at the start of April:
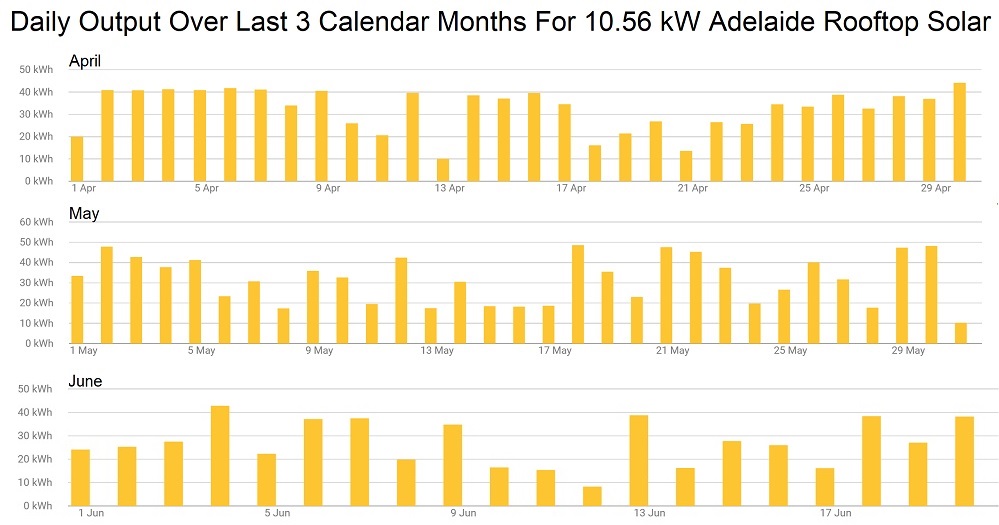
As you can see, while some days were clearly better than others, there were no days when zero solar energy was produced. This includes the winter month of June, the worst month for solar output in most of Australia. The worst day was the 12th of June when only 8.3 kilowatt-hours were generated. This is 19% of the average daily output of this size system in Adelaide. Only 19% isn’t wonderful, but it’s infinitely more than the 0 kilowatt-hours it would provide if “solar doesn’t work in winter” was true.
June: Month Of Least Sun
While July is the coldest month, in most of Australia June is the worst for solar energy output because thanks to the winter solstice. This is the shortest day of the year. Usually, it’s on the 22nd, but this year it’s the 21st.
If you’re considering getting solar power, near the winter solstice is the best time to check if your roof suffers any significant shading from nearby trees or buildings, because shadows will be at their longest. If your roof is free of shade on the winter solstice it will be free of shade all year — unless you have some fast-growing trees or buildings nearby.
In Darwin, Winter Is Best For Solar
Here’s a graph showing the average daily generation of a 6.6 kilowatt north-facing solar power system versus its average daily generation in June for each Australian capital:
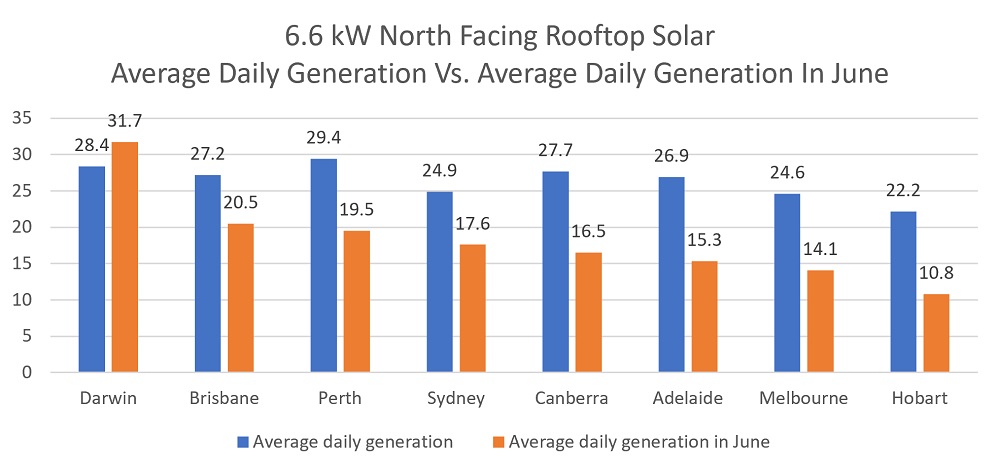
Darwin stands out with higher solar energy output in winter than summer. This is because:
- In the tropics, day length varies less in between summer and winter.
- Summer brings the big wet with cloudy skies and endless rain, while winter brings the big dry and clear skies.
In the rest of the capitals, the figure for June is considerably lower. As a percentage of the annual daily average, the June daily average is:
- Darwin 112%
- Brisbane 75%
- Sydney2 71%
- Perth 66%
- Canberra 60%
- Adelaide 57%
- Melbourne 57%
- Hobart 49%
The percentage falls the further south the city. Hobartians are the worst off in winter with the lowest total generation and the largest relative decline. This is no surprise at all to people who subscribe to certain modern theories about the shape of the world.
But it’s not all bad for Hobart in winter.
No, wait, it is all bad. If we consider average electricity consumption in winter, it makes the apple capital look even worse.
June Consumption Vs. June Solar
The graph below shows average daily electricity consumption in June for each capital compared to the average daily output in June for a common 6.6 kilowatt north-facing solar system:
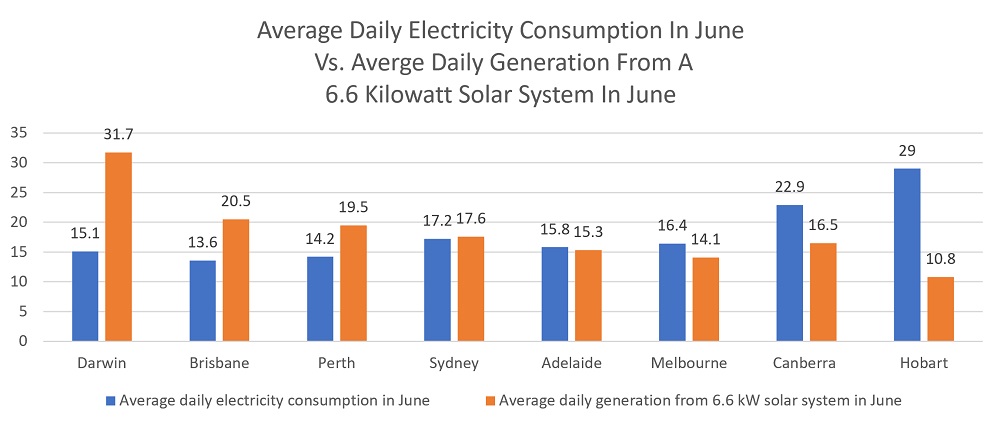
In Darwin, Brisbane, Perth, and Sydney average June solar energy output exceeds average household electricity consumption, but in the other capitals, there is a shortfall. The mainland capital with the largest shortfall is Canberra, thanks to high electricity consumption in their cold winters. But the worst capital by far is Hobart where the average solar output in June for a 6.6 kilowatt solar system only comes to 37% of average household consumption.
The easiest way to improve this is to install a larger solar system — provided there is room on your roof. All else equal, a 10 kilowatt solar system will provide 52% more energy than a 6.6 kilowatt one. If more solar panels aren’t an option, you can look at alternatives such as improving your home’s gaps, glazing and insulation, using an energy-efficient reverse cycle air-conditioner for heating, or violent shivering.
Dark Days Will Come
When a bored sadist on the internet looking for someone to annoy says solar doesn’t work in winter, there is a small corn kernel of truth inside the stinking lie. While solar power definitely does work, there will be days of awful output. Below I’ve made a chart showing the output of a 6.6 kilowatt north-facing solar system on its worst day so far this year. The figures below are only approximate because I came up with them by eyeballing curves — something I’d normally never do3:
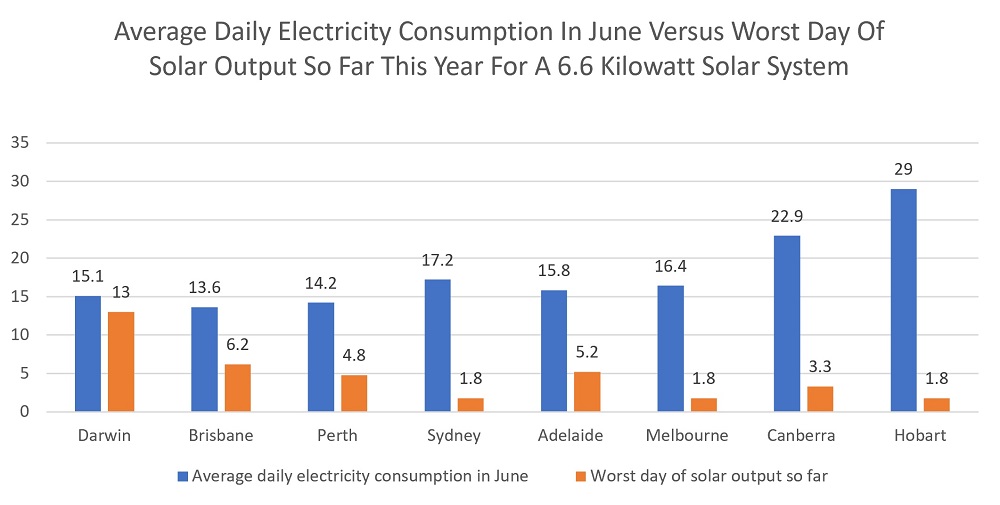
While Darwin, Brisbane, Perth, and Adelaide haven’t had a terrible day so far this year, Canberra has had a day of quite low output and Sydney, Melbourne, and Hobart have all had a horrible, dark day. While a day of low solar output isn’t good, it’s not a disaster if you’re on-grid. Even if you are off-grid the good news is periods of unusually low solar energy output normally don’t last long, as demonstrated by the first graph near the top of this article showing the daily output of a solar system over the past three calendar months.
But if you are off-grid it’s vital to prepare for rare patches of particularly bad weather and/or high electricity consumption.
Coping With Poor Winter Performance
There are four main ways of tackling the problem of poor winter output. If I had to sum each one up with a single word, I would describe them as:
- Move
- Tilt
- Store
- More
- Reduce
But, thank god, I have buckets of words here, so there’s no need for excessive concision.
1. Move North: Moving closer to the equator reduces the angle sunlight hits clouds in winter. This will cause otherwise identical cloud cover to cut solar output less in Brisbane than Melbourne. However, most people don’t consider this a practical approach due to the expense of moving and if you head into the far north you’ll have to fight giant spiders for territory.
2. Increase Panel Tilt: Panels can be tilted to maximize their winter output. This can be an excellent idea for ground-mounted off-grid systems. But because tilt racks on a roof are a major expense, it rarely makes sense for rooftop solar panels. The ideal angles (from horizontal) for maximum winter output from north-facing panels are:
- Darwin: 46 degrees
- Brisbane: 53 degrees
- Perth: 58 degrees
- Adelaide: 58 degrees
- Canberra: 59 degrees
- Sydney: 60 degrees
- Melbourne: 62 degrees
- Hobart: 67 degrees
3. Buy A Battery: Installing a battery can allow storage of surplus solar energy for use on days of lousy output. While not cost-effective at the moment, hopefully we won’t have to wait long for it to make financial sense.
4. Install More Solar: Installing more solar panels will allow you to produce more electricity, not only in winter but throughout the year. For most households, this approach will provide the best financial return thanks to savings on electricity bills throughout the year. But unless you live in the far north, south-facing panels will have particularly low output in winter.
5. Reduce Winter Electricity Consumption: A penny saved is… barely worth the effort. But improving your home’s thermal envelope with better insulation and sealing gaps, or using an energy-efficient reverse cycle air conditioner for heating, can save hundreds or even thousands of dollars per year.
Myth Busted!
Hopefully I’ve convinced you solar works through winter. A combination of big solar and a thermally efficient home will result in pleasantly low winter bills and a cozy home to see you through the not particularly dark days of an Australian winter.
Footnotes
- I’ve always been the smart one in my family. ↩
- In Sydney May averages slightly lower solar output than June due to local weather conditions. This figure is for June for consistency. ↩
- In Toowoomba, rather than learning calculus to determine the area under a curve, we’d cut the area out of the graph and weigh it. But once we switched to using computer monitors this method became excessively expensive. ↩
 RSS - Posts


It evens out, at least here in Brisbane.
Reverse cycle air con for heating to 20°C in Winter (which is 3x or so more efficient in than cooling) from 7pm to 7am plus nearly cloudless skies, and our energy bill is Zero.
In Summer, cooling to 26°C in the late afternoon and evenings only with the occasional overnight on very humid days, and we’re still in nett Credit then too.
All in, a plus.
“Internet commenters have told me, right to my internet face, solar power doesn’t work in winter.”
I wonder how they feel about the Tooth Fairy, or Santa Claus, or Climate Change? I’ve kept a daily spreadsheet record from June 2009 showing, inter alia, monthly and daily figures of generation, consumption, and more importantly (for me) the percentage of my consumption my panels supply.
Daily generation. Over the past 12 months, I’ve had a single day where NO power was generated. And that was because I had to have my meter box rewired, so was totally disconnected from everything.
Monthly Percentage of consumption. Despite the fact I have three electric or hybrid vehicles which get all the power from the sun, in the past three years, I have had only one month per year (including June 2021) where my panels have supplied less than 60% of household requirements of power.
Monthly generation. In the last 7 years there has only been one month where my panels have generated less that 100 kWh – and that month is June 2021.
Of course solar panels work in winter.
I think the degree of ‘myth’ about the ‘solar panels don’t work in winter’ story depends on where you live.
In the northern hemisphere, about a billion people rely on huge amounts of heat for winter survival, at the same time of year that the Sun is barely clearing the horizon for more than a few hours a day, and output totals 20 to 30 full capacity hours a month.
For the other half of the year, the panels produce fantastic amounts of power… but we just don’t need much. It’s light enough to read from 5:00 AM to 10:00 PM, and while it might hit 35 C in the afternoon, it’ll be 23 C in the basement family room.
It’s the corner cases which get you. The “solar panels don’t work in winter” story would be pretty convincing inside the arctic circle, and even south of there, where the panels may be under a foot of snow. But my brother has been ringing me weekly from Sydney, where his 19 kW system has been meeting domestic needs and exporting all afternoon, all winter so far.
Here in the Dandenongs we were without mains power for half of June, and without internet for 8 weeks. Self sufficiency is not to be underestimated.
My mantra would be: More roof, for more panels!
The seasonal variation at 52 degrees latitude is from a production of 300 KWh per month in December, to 1500 KW in summer. From a 10 KWp systm
Yes, snow and ice on panels can be problem, but the largest effect is simple geometry and the tilt of the Earth.
Sydney is at about 33 degrees, the Arctic Circle is at about 66 degrees, so ypur friend is still closer to the equator than the pole.
The billion people who live at those 40 to 50 degree higher latitudes in the northern hemisphere might be surprised to know they are ‘edge cases’, since a billion is a lot of people, and the Earth is more of a sphere than a plane.
I too struggle with the dilemma of ignoring trolls spreading BS or wrestling with them. The former would be much better for my blood pressure
Yes, the past two weeks in Adelaide have been pretty poor for my old 2.5kWp system. I am happy to shiver violently though. I am on a strange self imposed quest to delay activation of the heatpump this Winter. The crankcase heater is warmed up and ready to go but thus far I have remained resolute.
D2 left the nest last year and SWMBO is ecstatic about her gift of a heated throw. Unfortunately my fluffy footwarmer abandoned me for my wife’s heated blanket. Traitor.
A combination of our sunroom, a beanie and a relatively efficient living area has thus far been enough to delay any mechanical heating and we are net positive about 35kWh for June
I live in the Adelaide Hills and have thought for a while that we tend to design solar systems to fit a roof, but never (hardly ever) design a roof to fit solar panels, let alone design the system for WINTER not Summer. So, East-West blocks, long North-facing roofs of 45° to 60° pitch and utilise the roof space as a second storey. Hydronic heating by heat pump into a high thermal mass slab and one could ride out a bad day or two with the system off!
Thanks, good post.
Solar works in winter in Australia. Not necessarily so well in other climes. UK for example (52North) has too much cloud cover and barely registers output on a dull or sunny day [caveat: fixed angle installation]
I would add (I know you have covered this elsewhere) that ‘fill up your roof’ need not include additional (relatively expensive) inverters if you are looking for the lowest cost as your existing inverters will clip additional power when not needed. There are some complex calculations to do with regard to feed in tariffs which I am simply to simple to do…….
Simple Simon
The key question for me is why we are not allowed to have more solar panels being hooked up to an inverter. In my case the inverter’s nominal 10kW is only really limiting output during midday for about 4 to 5 months.
I simulated that I could easily add about 25% to 40% more panels added to the strings for 6 months only without violating the inverter’s 13.33kW max capacity.
There would be a great return on this investment for me and the environment without any technical drawback —— if we only were allowed to.
If I think of the nation’s installed inverters capacity and how little it is used in winter time, I fell sick! But maybe that is what our government wants.
I suspect it’s to try to make it easier for the grid to balance the supply / load across all three phases as your regular domestic residence is only connected to a single phase.
I have no evidence, nor have the engineering background to investigate (I am but a humble electrician), but it makes sense when you consider that buildings running off three phase do not have the same limits in place. With a three phase PV system it is much, MUCH simpler to balance the energy generated across all phases!
Unfortunately we do not have a vaccine for stupidity.
The ‘average daily generation of a 6.6 kilowatt north-facing solar power system versus its average daily generation in June’ graph is rather interesting and informative, but I’m not quite sure how to translate it to a 10 kW inverter system. Is it simply a case of doubling the stats? That still doesn’t quite seem right to me.
Being ultra-new to solar I don’t have any complete months to compare but here’s my June figures for an East-West+North system in case they’re of interest and\or use to anyone:
Worst day of month to date: 11.9 kWh (Ugh!!!)
Best day of month to date: 51.5 kWh
Average June daily yield as claimed by installers: 32 kWh
Actual average to date for June: 42.7 kWh
Performance above estimate: 10.7 kWh / 33.5%
Average May yield (Part month): 45.9 kWh
I’m still trying to determine if I’m getting a flat increase over the installer estimates – most beneficial in winter, or a percentage increase – most beneficial in summer.
Regardless, based on the figures I’m seeing, winter solar isn’t too bad – most days.
A 10 kilowatt system is 152% the size of a 6.6 kilowatt system so, all else equal, it will produce around one-third more energy. But note the figures in the article are for north facing solar. output will be a little less for east and west.
I don’t know your location, but it looks as though your system is doing well for winter.
Ah sorry I should have just said inverter, not inverter system – my bad. We aimed for the 13.3 kW in panels + 10 kW inverter, but couldn’t quite manage the roofspace so have a ‘non-standard’ sized version.
Yes I’m aware North =/= East\West. I’m not sure if North is always 15% better than East\West, or if it depends on the month, but I’m still pleased with how our system matches up with your north figures.
I’m a bit north of Brisbane but think I’m getting slightly better results than your graph shows. 🙂
My 10.8 kW system in Canberra has produced 500.9 kWh so far for the first 20 days of June. Ok, not as much as we have consumed and no where near as much as the 1,191kWh produced during the first 20 days of Jan but still 500kWh better than nothing!
With my 2kw system on my truck and 8kw of lithium and no other means of power it has indeed been a hard month, glad to know the worst of it is behind me because hiding in a small room with a tiny 13 inch laptop and one light on for that long was a bit to close to what I would call roughing it.
Today coincidentally was the first full day of sun in at least two weeks and now I am at 100% so time to break out the big external display/stereo and subwoofer for some movies tonight 🙂
The negative temperature co-efficient of solar cells also gives a significant increase in efficiency during the colder months.
Take care when using EXCEL to generate charts to illustrate a point. Your first chart has different vertical scale for the middle series than for the other two. This is something that EXCEL auto scaling generates. In this case it’s not much but manual scaling can make them all the same. That would completely avoid any accusation of an attempt to mislead and is good scientific practice.
RE: Tilt Panels
Do you have an estimated increase if there was a way to Tilt Panels to the Degree that you are suggesting?
Excellent article. We are into our third year of solar with a battery and I am surprised at the low net usage, roughly 30 Kwh over the last month from our 5Kw system that is E-W in Adelaide. Net input is trivial, but we are obviously getting good amounts of solar.
While cost of a battery is still not viable without some helpful rebates, winter solar is still pretty good and definitely not something to write off if your planning……??
We got 9kWh yesterday in Adelaide on the shortest day for the year from an old 2.5kWp array that gets 17kWh on a good day in Summer
Yep, solar works just fine in Winter
Good article Ron but….
PLEASE label the axes. The horizontal (x) is obvious but the vertical should be clearly labelled kWh. Hopefully this will help educate some people (media writers especially) in the difference between power and energy.
I live in Rockhampton, Central Qld and installed a 6.6kw Solar Edge system about 18 months ago. due to the roof style I have 3.6kw facing N.E. and 3.0kw facing s.w.
Over the last 12 months my system has produced an average of 790kwh per month, a total of 9500 kwh for the year. For the last 3 months I have averaged 620kwh per month
620 Kwh per Month?
Did some strategic tree lopping in April and now we are in June output is up by 10kWh/day compared with similar days last year. Shade can suck the life out of Winter solar!
Mine did over 5kWh/kW in January and June is merely 2.37kWh/kW so less than a half. As it is big, it still does 7.4kW peak in sunny day but in summer there is 5 hours of 10kW flat.
Worth to run of course but this is one of reasons why I installed it in September, just before season for cash.
Covered entire roof so that tilting was not an option, could be last row up but mere dollars it may add vs cost of rack made it not worth to install.
Overall I was always in credit since my meter was registered and I moved to Origin (somehow all retailers have reasonable offers for up to 5kW only), June was $2 in credit and probably I will pay first time in July. Yet only if my house decide to turn on heating as I am leaving such decisions for my house 😛
Yearly my power bill has been cut in half winter time on a clear sunny day 60% capacity cloudy days 10% capacity
We live in Melbourne and purchased a 6.6kw system (22 panels) in Jan 2019. So far it has been working well and am glad to have made the purchase. We suffer a bit of shading to our north and west but overall it’s been positive.
Average daily power output
June = 11.78kwh
July = 11.89kwh. (we suspect this is due to greater cloud coverage in July)
Dec = 33.81kwh
Average daily consumption
June = 15.6kwh
With regard to solar working in winter then we go negative (av consumption > av output) in June and July. Also because of the low FIT relative to the grid price we also go financially negative in May and August.
Because we consume 65% of our total power from the grid (mostly in the evening) what we really need is a battery however they are currently still too expensive for us. That would make a huge difference to us especially in winter.