
Wondering if your solar panels’ are still operating at their optimum efficiency? A free online tool from Solcast precisely calculates how much energy your panels should have generated yesterday, enabling you to swiftly identify any performance issues. Here’s how to use it.
Who The Heck Is Solcast?
Solcast is was an Aussie solar forecasting and modelling company based in Canberra. They provide global weather data to a range of commercial energy markets, utilities, and mining companies.
In January 2023 they were acquired by Norwegian assurance and risk management provider DNV. Solcast founder and CEO James Luffman assures us that the company is in safe hands.
The Free Home PV System Checker
Although Solcast’s core business focuses on providing premium services to commercial clients, they also recognize that helping out everyday rooftop solar owners like you and me aligns with their vision. Lucky us.
The Home PV System Forecaster provides users with short-term solar data forecasts for a particular location, taking into account basic custom configurations such as system capacity, azimuth, and tilt of the array.
But of more use to solar owners, is that Solcast can look backwards too. It can tell you what your solar panels should have produced yesterday so you can check they are still performing well.
This information is provided via an API1.
API? WTF?
API (Advanced Programming Interface) is simply a unique code that allows one computer to request and receive information or services from another. Although I’m not privy to the inner workings of Solcast’s API, the request would contain information such as date, location, and system parameters, etc.
So, if you send that code (API) to Solcast servers, Solcast will return the requested information in a particular format. One of those formats is a CSV file2.
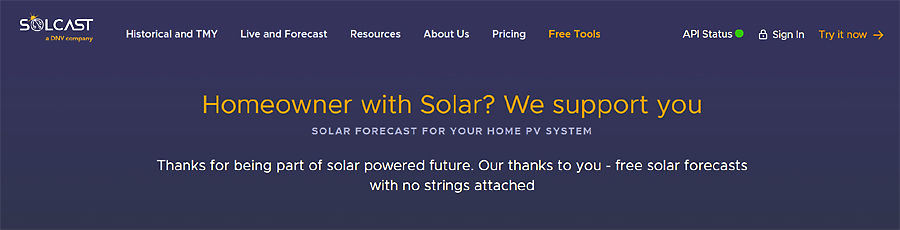
Solcast – free solar forecast for your home PV system – no strings attached.
OK, I’m In. Let’s Get Started
Follow these four easy steps:
1. Registration
Jump on their website and follow the prompts, or save time by going straight here – toolkit.solcast.com.au/register, and click on the big ‘Home User’ button on the bottom left.
2. Account Setup
You’ll come to the page entitled ‘Tell us a little about you’ (sounds creepy, but carry on). Fill in their data fields such as account type (select hobbyist), name, email, and location, agree to their terms and conditions then hit the ‘Submit’ button. A page will pop up asking you to select a password. Do it and hit ‘Submit’.
3. Activation and Login
Yay! Your account has been created successfully. Check your inbox, activate your account, and log in. You should have been redirected to the Home PV Systems dashboard. Click on the button in the middle marked ‘Add your first Home PV system to get started’.
4. Adding Your PV System
On the ‘Add Home PV System’ page, add Site Name, Tags (ignore it), Location search (or drop a pin), Capacity AC (inverter) in kW, Capacity DC (panels) in kW, Azimuth, Tilt, Installation date, Efficiency factor (leave default for now, see below), then hit ‘Save’.
Congratulations! You’ve created your first Solcast Home PV System Forecast Site. Now What?
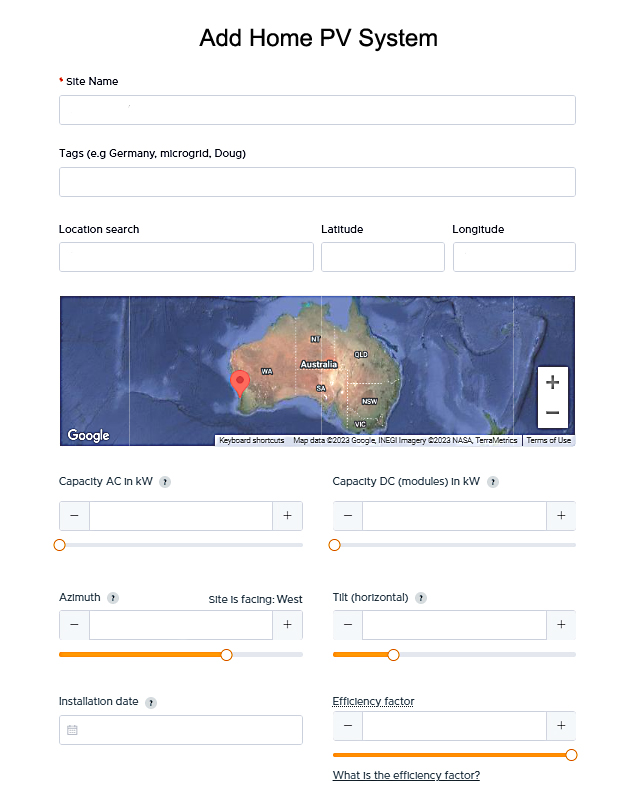
Add your location and configuration details into the Solcast Home PV System dashboard.
Using Solcast To Check Solar Power Production (kilowatts)
The ‘free’ service only provides estimated averages of power in half-hour intervals, so it’s not really a true reading of instantaneous power. However, on a bright sunny, cloudless day there’s a pretty good chance your system output will be stable enough for a close estimation. You can do this in 2 easy steps.
Step #1
Your Solcast Home PV System dashboard will have a graph showing power output (kW) estimated over a 6-day period. This will consist of 3-day estimated actuals (history), and 3 days forecast (including the current day). Simply hold your cursor over the current day/time (indicated by a vertical dotted line). The latest estimate for power production (kW) will be shown on the right-hand side of the graph. Write down the number (kW).
Step #2
Now open up the proprietary rooftop solar production app provided by your installer/manufacturer. Don’t tell me you haven’t got one, or you’ll be off my Christmas card list. The power being produced right now will be shown in a similar way to the Solcast dashboard, or numerical form somewhere on the proprietary app dashboard. Write down the number (kW).
That’s it! How did you go? Do the two readings reflect one another? Maybe not exactly. Don’t worry, I’ll show you how to tweak this later in the article. This method of verifying instantaneous power has its flaws, so let’s move on and check yesterday’s energy (kWh).
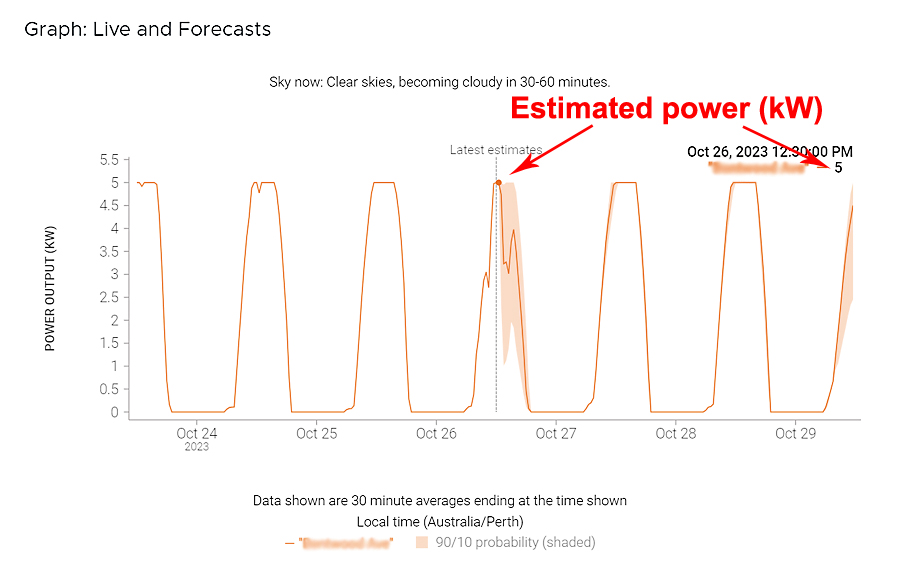
Solcast Home PV System Live & Forecasts Graph for a 6.6kW solar system.
Using Solcast To Check Your Previous Day’s Solar Energy Production (kWh)
This is a more accurate method than above for checking that your rooftop solar system is performing as it should. It’s a bit clunkier than simply pressing a button to get the answer, but don’t complain – it’s free.
Step #1
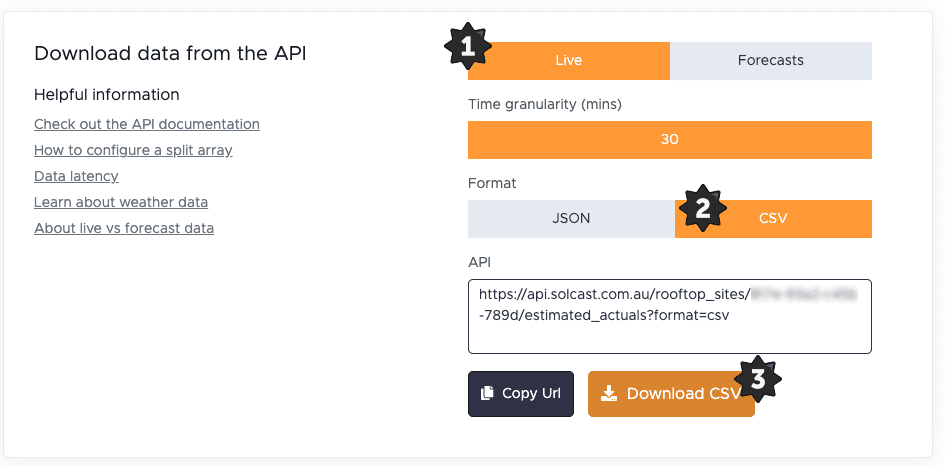
Scroll down on your Solcast dashboard, and you’ll see underneath the power graph a box that says, ‘Download data from the API’. The default position shows the ‘Forecasts’ button activated (in orange). Click on the ‘Live’ button so it turns orange and becomes active instead. This selects the estimated actuals (history) for your PV system.
Underneath, you’ll see the format in which Solcast will send the requested data to you. Select ‘CSV’ so it turns orange and deactivates the ‘JSON’ button.
The API appears in the lower box as a URL (web address). You can either press ‘Copy URL’ and paste it into your browser, or press ‘Download CSV’. Either way, a dialogue box will appear with the downloaded CSV file named ‘GetRooftopSiteEstimatedActuals’. Download it.
Step #2
Here’s the clunky part. Only basic spreadsheet skills are needed for this. Open up ‘GetRooftopSiteEstimatedActuals’ with your favourite spreadsheet app.
If you need a free spreadsheet, Google Sheets works well for this.
To open a CSV file in Google Sheets, from your browser click File->Open->Upload and find the CSV file you just downloaded.
Once the file is open, you’ll notice 3 columns containing a whole lot of gobbledygook. You may have to manually widen the columns to see better while we decipher this mess. For this example, we will look at the previous day’s solar production.
The spreadsheet contains 3 columns. We only care about the first column.
The first row of the first column is the column header: ‘PvEstimate’. The first number below that is the average power (kW) that your solar panels produced in the most recent half hour.
Finding the most recent complete day’s energy data
We want to add up all the numbers in the first column for yesterday’s data. The 2nd column contains date and time values but it’s in the wrong Timezone (UTC). So we just need to scroll down, past a nighttime’s worth of zeroes (no solar power at night) to get to yesterday.
If you are working during the day, you’ll need to scroll past today, to see yesterday’s data:
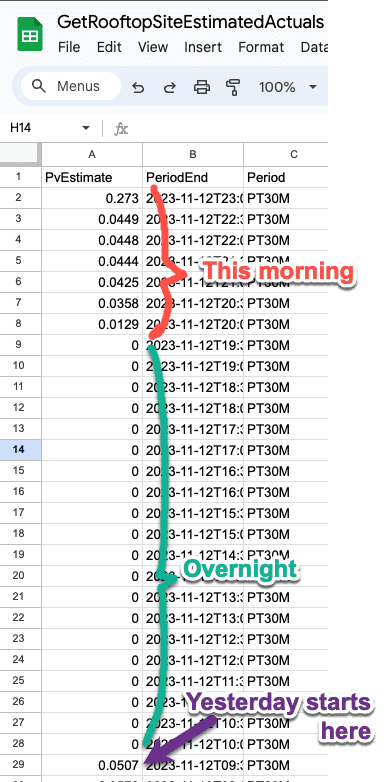
I downloaded this data at 10am so I need to look down the spreadsheet to find the start of yesterday’s power data.
Click on the first number of yesterday’s solar production number and drag down until you get to the next set of zeroes. You will have selected about 28 cells:
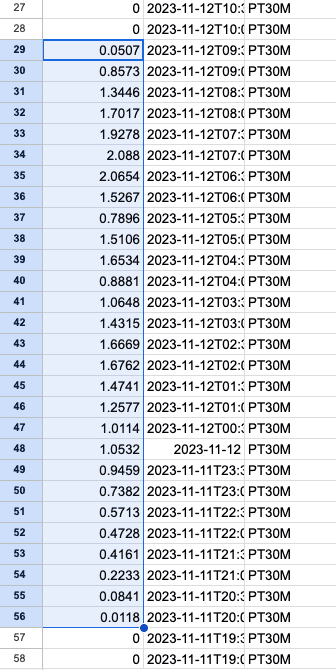
All the solar data for a full day is selected
We now want to add up all the cells we’ve selected.
In Google Sheets, simply click the Σ in the toolbar (you may need to click the three vertical dots first) then click ‘SUM’, then hit the ‘Enter’ key:
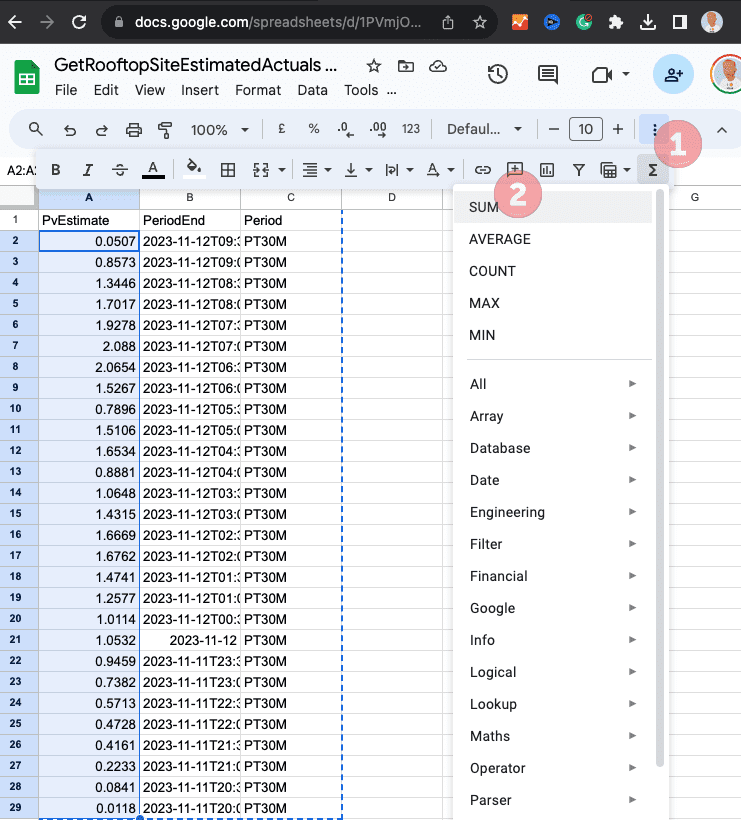
Voila, under the previously selected numbers is the sum of your rooftop solar total power (kW) readings every 30 minutes over the previous day:
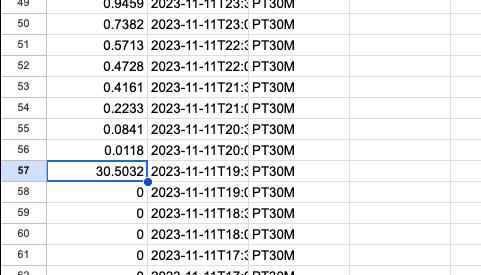
But kW (power) is not useful, we need kWh (energy)
To find the day’s estimated solar production in kilowatt-hours (kWh) multiply the figure by 0.5.
In this case the kWh produced yesterday is:
30.5 kW x 0.5 = 15.25 kWh3
Step #3
Open up your proprietary rooftop solar app and check out the previous day’s generation. Does it look similar to the figure calculated from the Solcast spreadsheet? Hopefully, it’s within about 15%. If so, you’re on to a good thing. If not, it needs further investigation.
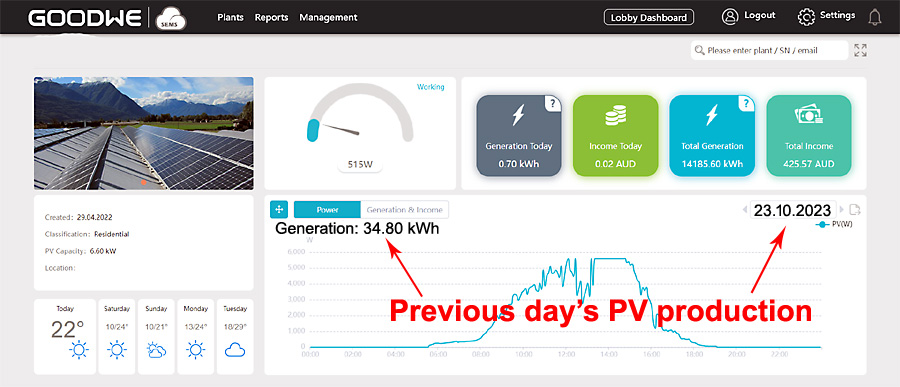
The previous day’s actual PV production is shown by scrolling back through on the proprietary GoodWe SEMS online portal. Note this screenshot is for a different, 6kW system, not the system shown in the spreadsheet example above.
Tweaking Solcast’s Estimations
You can retrospectively edit the configurations of your PV system in the Solcast dashboard if you like. This is particularly relevant when determining the ‘Efficiency Factor’. Their default setting is 90%. There is a tonne of good information on their website that explains the whys and hows of their methodology for this and other settings.
Multiple Roof Directions?
For those of you who have split arrays facing in different directions don’t despair. Although they don’t support multiple azimuth systems directly you can model each array separately and add up the resulting energy values.
The free tool allows up to two PV sites within a km of each other, but if you have more than 2 roof directions, there’s nothing to stop you downloading the data from 2 arrays, then deleting those and creating more so you can download the data for as many arrays as you need.
Integrating Solcast Into 3rd Party Apps
For more advanced users – Solcast’s API can be imported into third-party monitoring apps such as GivEnergy and Victron Energy. It can be integrated into DIY automation programs such as Home Assistant etc. But wait there’s more! How about PV simulation software such as PVsyst, SAM, PVSol, PlantPredict, Helioscope, and Homer Pro? Yes, there may be even more!
Solcast can forecast tomorrow’s solar.
If you want to get fancy, you can use Solcast to tell you what tomorrow’s energy yield is likely to be. Handy for deciding whether you should charge that EV tonight or wait for the sunshine tomorrow.
Let’s face it; most of us aren’t going to do that to check the next day’s solar forecast. However, if you suspect an issue with your solar output, this tool can be a lifesaver to verify your system’s performance.
Next time: Solcast + SolarEdge data + Drone Imagery
Next time, I’ll show you how one Hobart solar owner has integrated Solcast into his SolarEdge monitoring system and used drone imagery of his house to create 3D visualisations of his system performance. Stay tuned, it’s pretty awesome.
Footnotes
- One of my pet hates is the overuse of acronyms by industry commentators when they are communicating with people outside their own line of business. The solar industry is sometimes as guilty of this as the medical profession, and others. Information Technology is the worst. They even proudly name their industry with an acronym (IT). ↩
- Not another esoteric acronym! You’ll have to look that one up yourself ↩
- A sanity check is that the final number should be about 4 x your system size (more in summer, less in winter). This example is for a 3 kW array and is taken in spring. 3kW x 4 = 12 kWh, which is in the ballpark of the 15.25 kWh derived from the spreadsheet. ↩
 RSS - Posts


Just tried registering and the website keeps looping back. Tried on 3 different browsers, Safari, Chrome and Edge. Issue appears with website. I’ve emailed their support team.
SolarAnalytics really does it for me on this front as I have a Goodwe inverter with Goodwe HomeKit.
I also have an account with PV Output, whilst this is also good, there are limitations with Inverter suppliers API’s to interface the data to PV Output automatically. Enphase works well with PV Output given the operating API, but PV Output can be too sophisticated to use for the layperson whom is not tech savvy.
Solar Analytics (in my humble opinion) really does the job well in solar system monitoring.
This sounds like time consuming and eventually could and would come at a $ cost $, because nothing is free. Just purchase Enphase Microinverters at the very beginning and then the potential problem is alleviated.
Invest in quality and you get quality results.,
Where does the Enphase app tell you how many kWh your system should have produced yesterday vs what was actually produced?
My 2009 installed Latronics 1KW system has no app 🙁
But it is still chugging away, based on my power bill consistently being noticeably less than the average household for my demographic.
Before the inexorable rises in daily connection and metering charges ( admittedly a considerable number of years ago now) i used to even be in credit!
Cameron
I have a similar story. Invested in a 1.5kW system in 2011 with feed-in at 66cents. System paid out and added a 3.1kW system in 2015 for less than the first system. Heaps of credit and savings. Removed the 1.5Kwh system and installed a 6.6kW system for$3,550, way less than the 3.1kW system. Now generating more power than needed. Expected results will see us in credit by end of year and following years.
Delaying reduces your credit savings and increases your debit.
If you are lucky enough to have Victron kit, Solcast forecasts are integrated and presented in the Victron Web app. They also forecast consumption, which is not useful for me as the EV charging follows no pattern and messes with their algorithm.
It is all great to have a way of monitoring your solar array, but most of us are just too busy to keep checking that all is well, after that honeymoon period of vigilantly watching a new system.
So, is there any monitor that would have told me that my Sungrow inverter had stopped workin 3 months ago, and prevent us from getting an extrodinarily large power bill? AGL had a solar failure warning on our home page which we only check when our bill notification comes through. Yet they have elected not to email their clients of solar failure, for some strange reason!
Note that we charge our EV, heat our water and run the A/C off our solar, so it is an interesting exercise to see what we have actually been saving.
Solar Analytics would have warned you.
Spot on… loving Solar analytics
Hans, is there any monitor that would have told you that your Sungrow inverter had stopped workin 3 months ago? Yes, there sure is. In addition to Solar Analytics, you probably already have the capability to do just that in your Sungrow iSolarCloud monitoring app. You can set it up to send you an alert for various performance and fault conditions. Read this and contact your installer if you’re unable to configure it yourself.
https://www.solarquotes.com.au/blog/isolarcloud-useful-alerts/
thanks Kim for that interesting journey through Solcast’s API toolkit.
Assuming I followed your instructions accurately, Solcast gave me yesterday’s production forecast of 24.65 kWh compared with a generation figure from SMA Energy’s app of 34.8 kWh, a difference of 29.2%.
What further investigation of my PV system is indicated?
cheers Shane
Shane, better an underestimation than the other way around! I agree that it sounds a bit too far out though. Based on my feedback that Solcast is extremely accurate I’d be double checking everything you’ve done. Start by editing your PV system (orange button top right of your Home PV system page). Are all the data fields you entered 100% correct? Next move on and do all the spreadsheet calculations again. The other thing that might be adrift – The Solcast app refers to AC power and energy produced by your inverter. It’s possible that your SMA app is referring to DC power from your solar panels, which is not the same thing. Not being an owner of that app I couldn’t tell you, but you need the be able to compare apples with apples – in this case AC power and energy from your inverter.
thanks Kim
I had the same thought that Solcast was giving an underestimation and the AC v DC suggestion makes sense. I left the system characteristics blank as you suggested and didn’t go back and update any data because I had no idea what to insert. I’ll revisit the exercise. Shane
Shane, look at what solcast indicates for the past day. It shows you a forecast for the future and also a view of what it thinks then actually did happen. The forecast is usually close but the estimated actuals are often spot on.
Thanks for helping out with the API.
I’ve been on Solcast for about four months. It is pretty handy in Winter time for setting Forced charge targets the next day.
One thing it lacked was the ability to add split arrays of panels: For instance our roof has panels on the North and South faces of the roof. There was no way to input that when I signed up and only allowed for the 21 degree rake on a 4 degree North axis.
I did read that you can add 2 systems for the same address. Use each direction as it’s own system. I have the same issue, but just split the difference with direction but that’s obviously not going to be very accurate.
Thanks Frank, I’ll have a look into that. Could be handy toward next winter and coming into spring when considering a panel clean too. Yes, I did similar with the split too. Problem was the differing number of panels with the South face being lesser.
Enjoy your day Frank…
My Commissioning Report states the orientation of my panels as “N1 – 8 degrees”. Any idea how I could convert this to Azimuth? Thank you.
Hi Siew. You would write the same as on your report – anywhere from 1 to 8 degrees. If you don’t know I’ll pick one for you. How about 8 degrees? You should have a diagram on your report that shows the proposed layout and if it’s a bit west of due north that might be about right! This is what it says on the Solacast site – Azimuth: The direction on the horizon the PV modules are facing, expressed in degrees. Values must be between -180 and 180. 0 is north, 180 is south. Eastward facing = negative values. Westward facing = positive values. For example, -90 is due east.
Thank you, Kim, I just learned from your reply that the solar industry does not use the near-universal convention that azimuth in degrees is measured clockwise from North, 0 to 360! Cf. navigation, astronomy, meteorology…
Why on earth not?
Eight degrees azimuth should mean 8 degrees East of North, and it is sowing needless confusion to adopt some other convention!
Hi Iain. I don’t think it’s a ‘solar industry’ thing, but more of a Solcast oddity. I’m no boy scout but I agree it sure does seem strange of them not following convention.
Registered ok, but I have a battery in my system, and there is no allowance for that, because even though I have a 5kWh inverter, the battery allows the system to go well over 5kWh. Is there a solution for this?
Hi Frank. I’ll try to interpret your question the best I can. Forgive me if I’m not quite understanding your problem and stating the obvious.
You say “I have a 5kWh inverter, the battery allows the system to go well over 5kWh.”
I presume you mean that you have a 5 kW inverter? We’re not interested in the battery because it’s not a generator.
If I’ve misinterpreted your question please let me know and I’ll try again.
The first graph I looked at showed the production clipped at 5kW, but I’m saying that because I have a battery in the system, I’ve had the panels producing sometimes 9kW, and the graph doesn’t reflect this. I’m not an electrician, so maybe I’m missing something.
Hi again Frank. If your solar/battery system is DC coupled it may be better to enter your system capacity differently into your Solcast Home PV System page. This is my idea for a workaround to account for any energy going into your battery before being clipped by your inverter. Try entering the ‘Capacity in AC’ (inverter) with the same info as ‘Capacity DC’ (modules) in the Solcast page. That way Solcast won’t take any clipping into account. So both AC and DC capacity showing on the Solcast page would be the amount of PV you have on your roof (kW). You then can compare that with your DC solar production from your app. Make sure you’re comparing apples with apples. If however your solar/battery system is in fact AC coupled then just keep the system capacity details as before (AC = inverter, DC = panels) and ignore the battery as I previously said.
To find the day’s estimated solar production in kilowatt-hours (kWh) multiply the figure by 0.5
What is this factor of 0.5 is used in converting kW to kWh?
For example, my SMA app says my system produced 23.588 kWh yesterday and Solcast suggests 27.474. As my system was installed in 2011 I have applied an efficiency of 75% based on 2% loss per year.
Jim,
Solcast provides kilowatts every half hour. To convert that to kilowatt-hours you multiply by 0.5.
If that’s not intuitive, think about using 1kW for half an hour. You’ve used 0.5 kilowatt-hours.
Hope That Helps,
Finn
I have Sunpower panels totalling 6.5 kW and Enphase micro-inverters – so no DC number to enter. Do I just put 6.5 in both fields or what?
You find the DC rating of the micro inverter model and multiply that by the number of micros.