
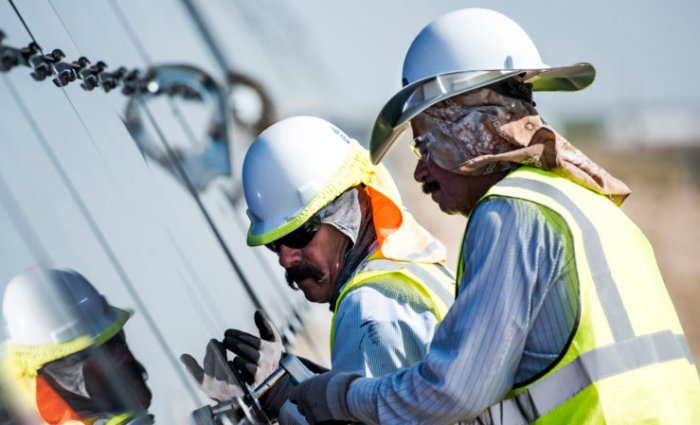
While U.S. solar industry employment dropped 3.85% last year, there’s still just over a quarter of a million Americans working in the nation’s solar power sector – twice as many as in coal.
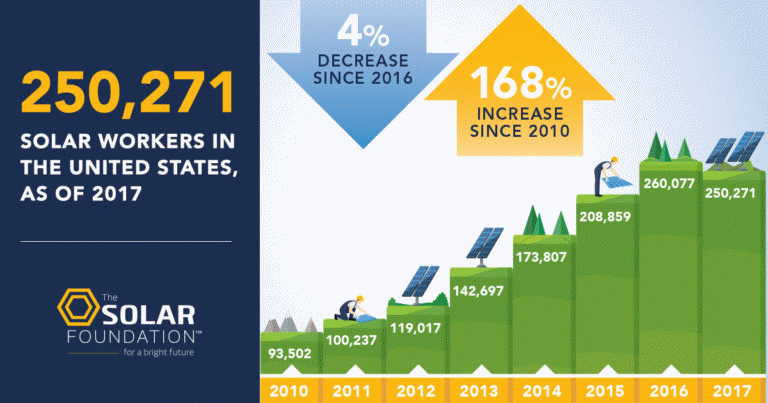
The Solar Foundation’s latest Census found there were 9,800 fewer jobs compared to 2016, the first decrease since the original release of the report in 2010.
“After six years of rapid and steady growth, the solar industry faced headwinds that led to a dip in employment in 2017, including a slowdown in the pace of new solar installations,” said Andrea Luecke, President and Executive Director at The Solar Foundation.
Installation, sales/distribution and project development shed approximately 7,500 jobs in 2017, while the manufacturing sector lost around 1,200 jobs.
One of the possible reasons given for the decrease were fears over the outcome of a trade case that eventually turned into the Trump Solar Tax, Trump Solar Tariff (or whatever you want to call it), which was announced in January. The trade case that triggered it started in April last year.
The Solar Energy Industry Association (SEIA) had warned 88,000 Americans that were currently employed by the solar industry risked losing their jobs if the punitive tariffs were introduced, however, that was prediction was based on a higher tariff level than what was introduced. The final fallout relating to jobs remains to be seen.
While a few solar stronghold states saw significant job losses last year, for example, California shed 14%, employment increased in 29 emerging market states. Among the standout performers in terms of percentage growth were Iowa (+45%), Minnesota (+48%) and Utah (+40%).
2017’s somewhat disappointing result doesn’t overshadow some eye-popping statistics relating to the evolution of solar jobs in the USA, including 168 percent growth in the past seven years – jumping from approximately 93,000 jobs in 2010 to over a quarter of a million last year.
As well as employing double the number working in the coal industry, solar employs almost five times as many as nuclear power, and nearly as many workers as the natural gas industry (based on 2016 figures).
Wages in the solar industry are remaining competitive with similar industries and above the national average. 73% of all solar companies and 93% of installation companies do not require workers to have bachelor degrees.
More from the National Solar Jobs Census 2017 can be viewed here.
U.S. Installed Solar Capacity
Nearly half of all new electricity generation capacity added last year in the USA was from renewables and approximately half of that was solar power. Total installed U.S. solar capacity is now over 50 gigawatts.
Just as a comparison, by the end of last year, there were 1.79 million installed solar power systems in Australia, with a combined capacity just north of 7 gigawatts – around one-seventh of the USA’s installed capacity. However, the USA has a population of around 323 million, whereas Australia’s is 23 million. On a watts of installed capacity per capita basis (rough figures), the USA has 155 watts of solar PV per person, whereas Australia has 290 watts per person.
 RSS - Posts


Speak Your Mind