
Most of us know that home batteries inevitably degrade over time, but understanding how to quantify that degradation and take proactive steps remains a mystery.
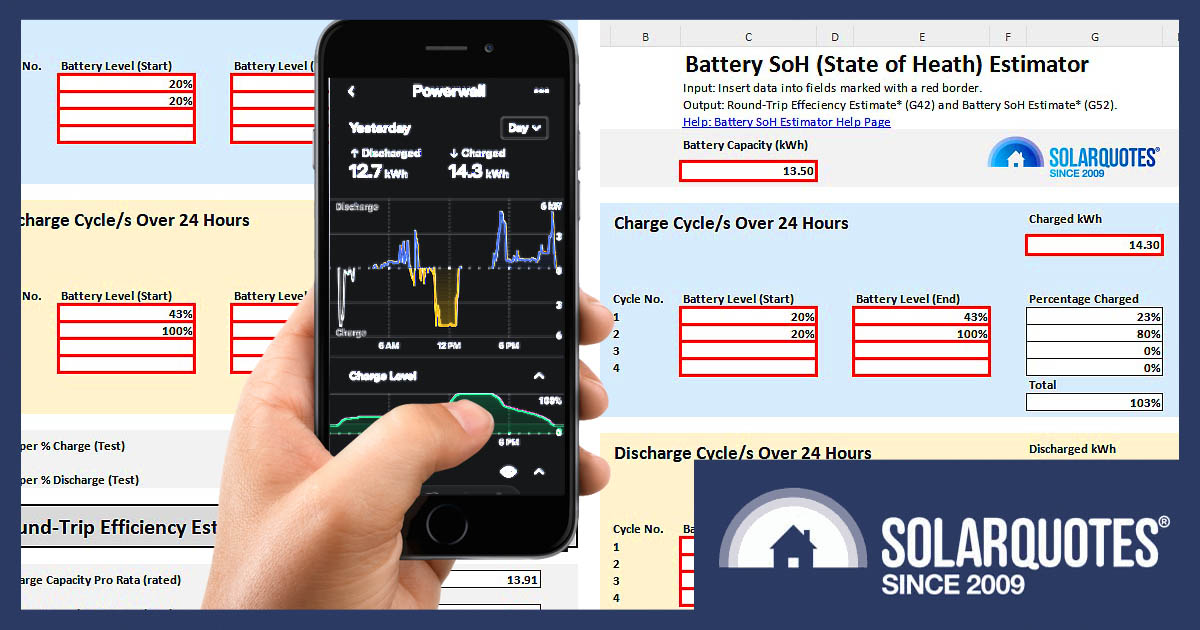
In this article, I’m excited to introduce you to a DIY battery health estimator spreadsheet. By the time you finish reading, you’ll have this handy tool at your fingertips and the know-how to assess your battery’s State of Health (SoH) and make informed decisions about its performance.
What’s This Spreadsheet All About Then?
Recently, SolarQuotes blogger/installer Anthony wrote two interesting articles about why and how a battery degrades, and how to measure it using a monitoring app. I recommend reading both of them as a starting point for this article.
Anthony outlines a method to estimate a battery’s health by manually calculating and estimating its round-trip efficiency and SoH using selected data points over 24 hours. You can do the same thing with this spreadsheet by simply adding the data. The spreadsheet will do the rest.
Note that this method provides a rough estimate only, and may not be as accurate as more sophisticated battery management systems or monitoring tools that use other metrics and specified test conditions.
Recommended reading – Anthony Bennett’s battery degradation articles.
What Is Round-Trip Efficiency And SoH?
These are two of the metrics used to measure the condition and performance of a battery.
Battery Round-Trip Efficiency: Represents the ratio of the energy output from the battery during discharge to the energy input during charging, accounting for losses in the process. A higher round-trip efficiency indicates that a battery can store and release energy more effectively.
Battery State of Health (SoH): Indicates the current overall condition and health of a battery relative to its original capacity. It is expressed as a percentage and considers factors such as capacity degradation, internal resistance, and other wear-related effects.
How To Use The DIY Battery Health Estimator
In a nutshell, to measure the SoH over 24 hours, there on only four parameters we need to know.
- The SoC at the beginning and end of each charging cycle.
- The SoC at the beginning and end of each discharging cycle.
- The daily kWh used to charge the battery.
- The daily kWh discharged from the battery.
Sounds simple enough, but the bad news is that not all monitoring apps will give you this information.
However, the Tesla Powerwall’s app will! The following example uses the Tesla monitoring app to estimate the round-trip efficiency and SoH of a Powerwall 2.
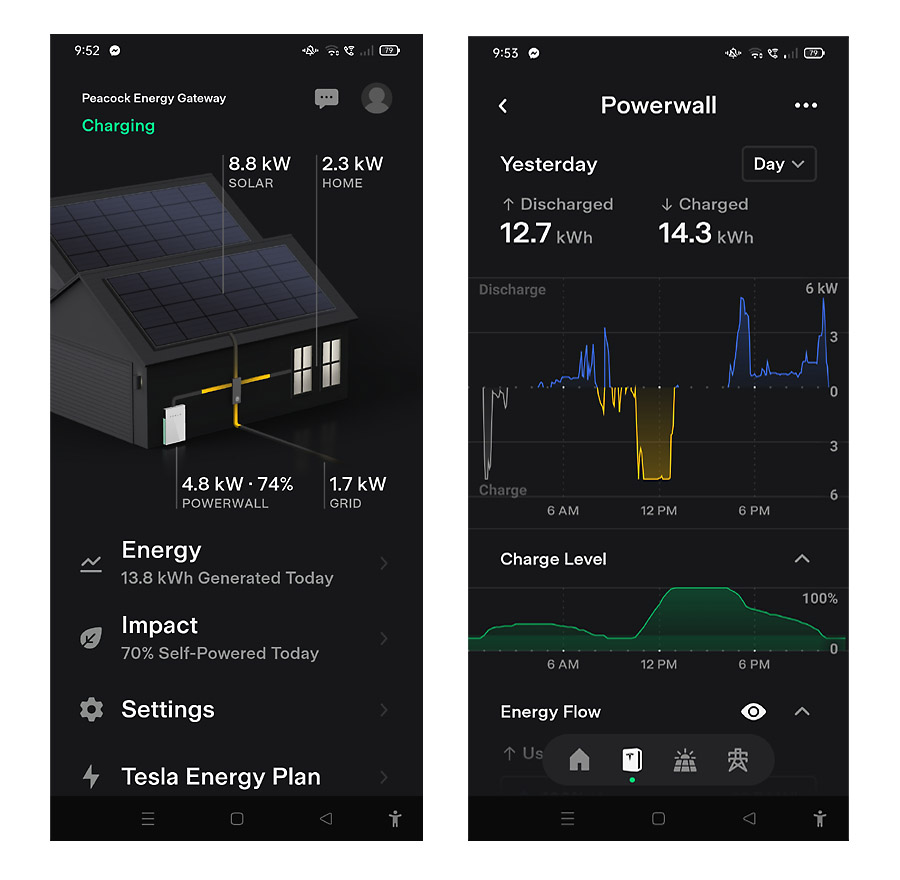
Tesla app main screen (left) – click on ‘Powerwall’ tab to open the Powerwall screen (right). Discharged and Charged kWh are shown numerically on top, by graph (middle), and by battery Charge Level by graph (bottom). Use the touch screen on the lower graph to obtain numerical percentages.
Steps:
- Download the spreadsheet from the link at the bottom of this page and open it up. All the data entry cells are marked with a red border. Enter your battery’s rated capacity into the first cell (C7).
- Open the Tesla app on your phone and click on the ‘Powerwall’ tab.
Make sure the tab on the top-right is set to ‘Day’. - Swipe the ‘Discharge/Charge’ graph to the right, until you find a suitable day to measure. The charge level at the end of the day should match the start (%).
- Note the kWh charged and kWh discharged for that day, then go back to the spreadsheet and enter those figures into cells G12 and G26 marked ‘Charged kWh’ and ‘Discharged kWh’.
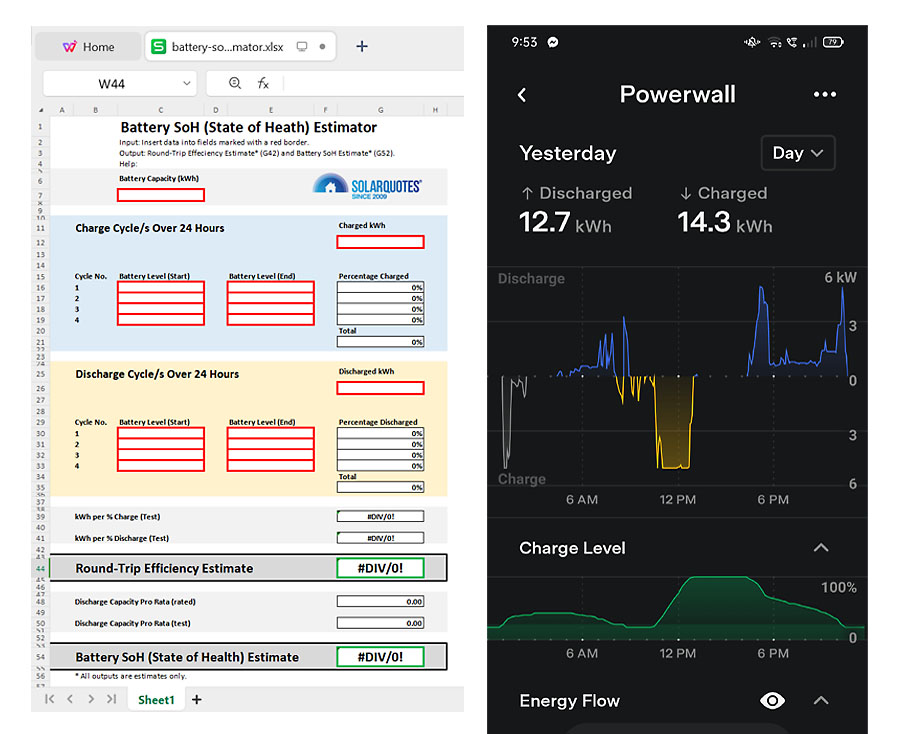
You must toggle between the spreadsheet and the Tesla app as you enter data. Easiest is to view the spreadsheet (left) on desktop, and Tesla app (right) on phone.
Charge Cycle
- Go back to the Tesla app and look at the ‘Charge Level’ graph on the lower part of the screen.
- Touch the screen at the left-hand side of the graph and note the ‘Charge Level’ at the start of the 24-hour period.
- Go to the spreadsheet and write the number down in cell C16 marked ‘Charge Cycle/s Over 24 Hours/ Cycle No.1/ Battery Level (Start).’
- Go back to the Tesla app and place your finger on the touch screen to the right of your previous %. Locate the highest level the battery was then charged to in the same charging cycle and note the number.
- Go back to the spreadsheet and enter the number into cell E16 marked ‘Charge Cycle/s Over 24 Hours/ Cycle No.1/ Battery Level (End).’
Discharge Cycle
- Also write the same number (step 11) into cell C30 below in the ‘Discharge Cycle/s Over 24 Hours/ Cycle No.1/ Battery Level (Start).’
- Go back to the Tesla app and place your finger on the touch screen to the right of your previous %. Find the lowest percentage the battery was charged to in that discharging cycle and note the number.
- Go back to the spreadsheet and enter the number into the cell E30 marked ‘Discharge Cycle/s Over 24 Hours/ Cycle No.1/ Battery Level (End).’
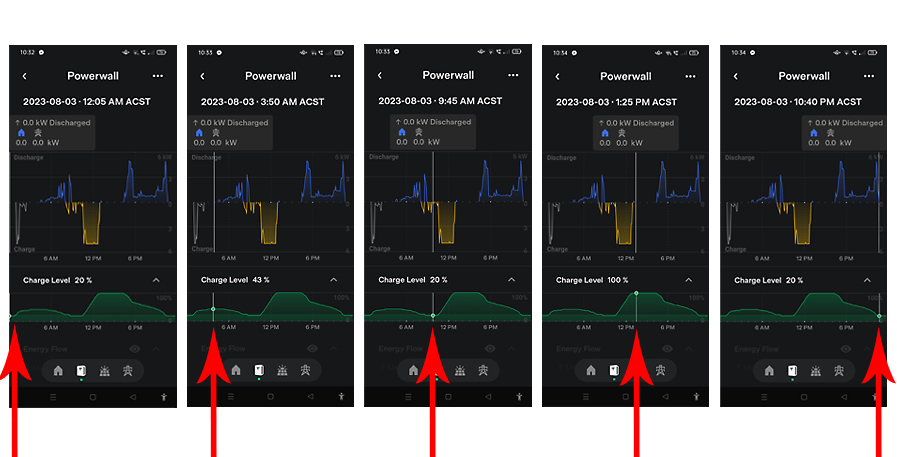
Tesla app with red arrows showing charging and discharging cycle data points through 24 hours. From left to right – 20%, 43%, 20% 100%, 20%.
Additional Charge/Discharge Cycles
If there are more charging and discharging cycles during the 24 hours, continue the above method by moving sequentially right on the Tesla app Charge Level graph, then entering data into the spreadsheet ‘Cycle No.2’ cells for charging and discharging, and so on, until the end of the day. Most days will have two charging and two discharging cycles, however, it’s possible to have less or more. The spreadsheet has allowed for up to four of each.
After entering the data above, the Round-Trip Efficiency Estimate and Battery SoH Estimate will appear in the output cells (G44 and G54) below. Once you have these figures, cross-reference them with other days to ensure your data has been entered correctly. You should get a similar result. The next step might be to retrieve the data from the start of your battery’s life and compare.
Spreadsheet Calculations
For those who like to dig a little deeper and find out how this spreadsheet works, I would suggest first reading Anthony’s article ‘Battery Degradation Part II: How To Measure It‘. The following spreadsheet calculations are based on his methodology.
- Percentage Charged Total: [G21=SUM(G16:G19)] – the sum of all charging cycles.
- Percentage Discharged Total: [G35=SUM(G30:G33)] – the sum of all discharging cycles.
- kWh per % Charge (Test): [G39=G21/G12] – % Charged Total divided by Charged kWh.
- kWh per % Discharge (Test): [G41=G35/G26] – % Discharged Total divided by Discharged kWh.
- Round-Trip Efficiency Estimate: [G44=G39/G41] – kWh per % Charge (Test) divided by kWh per % Discharge (Test).
- Discharge Capacity Pro Rata (rated): [G48=C7*G35] – Battery Capacity (kWh) multiplied by % Discharged Total.
- Discharge Capacity Pro Rata (test): [G50=G26] – Discharged kWh.
- Battery SoH (State of Health) Estimate: [G54=G50/G48] – Discharge Capacity Pro Rata (test) divided by Discharge Capacity Pro Rata (rated).
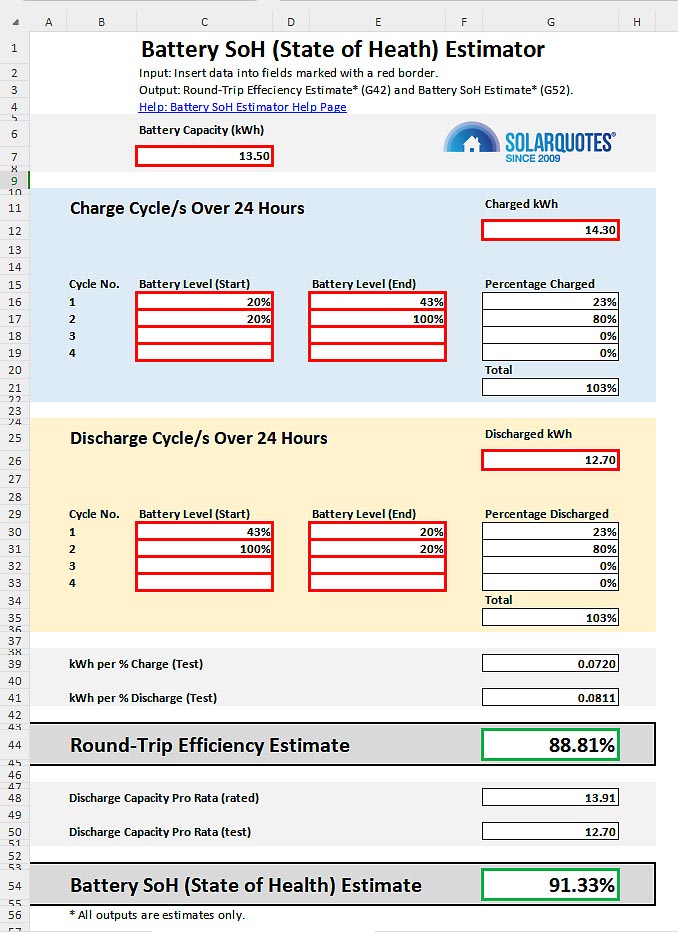
Desktop view of the DIY Battery Health Estimator Spreadsheet. It can be easily printed on an A4 sheet of paper. This is Finn’s 6-year-old Powerwall performance estimate from yesterday’s energy data.
What To Do If The Readings Appear Lower Than Expected
If, after using this method, you’re concerned that the battery is not performing to the specification outlined in your warranty, what’s the next step? Is the data collected from this method useful when approaching a company for a warranty claim due to suspected early battery degradation?
Absolutely!
The data collected from your estimation method may not provide the same level of accuracy as more advanced battery testing methods. However, it can still serve as a starting point for your warranty claim. Here’s what you can consider doing:
Document the Data: Ensure you have a well-documented record of all the data you collected, including SoC percentages, kWh used, and any calculations or formulas used to estimate SoH. This documentation will be crucial when presenting your case for a warranty claim.
Review Warranty Terms: Before contacting the company, thoroughly review the terms and conditions of the battery warranty. Pay close attention to any specifications related to the State of Health, capacity loss, or degradation that would make your case eligible for a warranty claim.
Contact Customer Support: Contact your installer or the battery company’s customer support. Provide them with the collected data and calculations, explaining your concerns about early battery degradation. Be prepared to explain your estimation method and how it suggests the battery is not meeting the specified SoH under the warranty period.
Request Inspection: In many cases, the company may want to conduct its own assessment of the battery’s health before approving a warranty claim. They might ask you to provide access to the battery for inspection and testing.
Be Persistent: If the initial response is unsatisfactory, consider escalating your concern through appropriate channels. This could involve speaking to a higher-level customer support representative or submitting a formal written complaint.
Taking Charge of Your Battery’s Health
The DIY battery health estimator spreadsheet demystifies degradation and empowers you to monitor and address it proactively. Armed with this tool, you can assess your battery’s State of Health (SoH) and confidently engage with manufacturers if performance falls short.
Download the DIY Battery Health Estimator Spreadsheet here, and feel free to post your results in the comments section. I’d also be interested to know of other monitoring apps that give SoC percentages in real-time and daily charge/discharge kWh.
 RSS - Posts


Great idea and job Kim. This will benefit many PW2 owners (not me unfortunately) and should be transferable to other batteries even though on some you’d have to guestimate the round trip efficiency.
Calculated mine just now.
Alpha ESS B3 Plus
Installed Date 4/02/2022
Battery Degradation Calculated on 7/08/2023
Battery capacity 4.8kw
Charged 4.3kwh 12%-100%
Discharged 3.14kwh 100%-33%
Round trip efficency 95.20%
Battery health 96.91%
The Powerwall itself can tell you the figure that will most likely be used in any discussion of warranty.
– Log in to the Powerwall local web page
– in browser, enter https://[Powerwall_IP]/api/system_status
In the response, there is a line with nominal_full_pack_energy.
This is the internal remaining capacity, not the available capacity which is somewhat (10%?) less.
A new Powerwall will return a figure of around 15kWh.
My 6-year-old unit returns 13.508 kWh, so 10% degradation.
Thanks for pointing that out David. It would be good to cross reference that with the spreadsheet to see if it correlates. The more ammunition you have in a warranty war, the better.
Power Wall 2 (5 years old) – 7/8/2023
Two Cycles –
Round trip Efficiency Estimate – 87.88%
Battery SoH (State of Health) Estimate – 92.06%
The app “Netzero for Tesla” available for iOS, Android and as a web app, will give you the current capacity of the battery.
https://www.netzeroapp.io/
The Powerwall Companion app was broken by a Tesla Powerwall2/Gateway2 upgrade to firmware: 24.4.0 0fe780c9, but the developer of the Powerwall Companion app has resolved the Tesla reduction in API access and now the Powerwall Companion app works again, and when configured shows the current Powerwall2 capacity. The windows version has capacity history.
The “Powerwall Companion” app is always used, located on a conveniently placed android tablet to provide a quick view of the battery status / current capacity. (very convenient)
The “Netzero for Tesla” app is also occasionally used to provide additional detailed information if & when required.
Hi, thanks for the spreadsheet calculation which I’ve used with my Powerwall 2 that was installed in March this year.
I had trouble getting the figures from the Tesla App, so I used the Powerwall Companion from Tom Hollander which uses the api to pull data and is easier to see the numbers at the appropriate times.
I’m still not sure I have it right though – I charge the PW2 up 100% overnight when it is cheap so I can sell 10-15kWh profit between 4 and 7PM at peak price. It seems counter-intuitive to ignore the “free” solar during the day, but I can sell that as it’s generated at virtually the same price (ex. VAT) as we pay overnight, so no real loss and we earn a guaranteed £1 – £1.50 every day.
As we are very light electricity users I really only have a period overnight where I charge up to 100% which stays that way until 4PM and then another period in the evening when we discharge and then stay at that level until the cheap rate kicks in. Any usage during the day is covered by the solar panels at this time of year.
So only one charge cycle from 28-100% and then the reverse discharge cycle. PW2 is 13.50kWh capacity of course and I used 11 kWh to charge and 10kWh to discharge.
Calculation shows 90.91% efficiency which is exactly what I expect but battery SoH is 102.88. Is that because the battery is still very new and charging at more than 13.5 (I understand when new it can go to 14.0 kWh) ?
Or have I got it completely wrong ?
Thanks again Roger