

Image Credit: Selectronic Australia
All batteries degrade over time. The battery warranty specifies the maximum degradation you can expect – typically over ten years. But how do you know how much your battery has actually degraded?
Part one of this post helped you understand why and how a battery degrades and how you can minimise degradation (TL:DR; don’t let it get too hot or cold).
In this post, I’ll explain how you can measure your battery degradation and how manufacturers will measure it to verify any warranty claim. I’ll also give you some tips on choosing a robust battery for your home.
How Do You Measure A Battery’s Degradation?
If there’s any suspicion about the performance or longevity of your home battery, the first step is simply observing your battery monitoring. I much prefer this way of measuring real-world performance because you can observe over time and get a really clear picture. Numbers don’t lie, and graphs are great for visualising what’s happening.
Funnily enough, I don’t know of any home battery monitoring software, first or third party, that gives you a battery degradation figure. If you know of any, please let me know in the comments.
It’s obvious why battery manufacturers don’t want to be transparent about battery degradation – the sad truth is the less you know, the less likely you are to make a warranty query1. But I’m surprised no one has made a third-party app that hooks into your battery monitoring and gives you a degradation trend. These apps are common for EV batteries, but I can’t find any for home batteries.
How To Measure Your Battery’s Degradation Using Monitoring
To measure your battery degradation – you are at the mercy of your monitoring software. In this example, I’ll look at my friend Sean’s twin Tesla Powerwall installation using only the Tesla app.
I’ll start by looking for a 24-hour period where the batteries fully cycle once. Sean’s Powerwalls are set to a 15% reserve level, which means charging from 15% to 100% and vice versa makes a full cycle.
July 18 looks good:
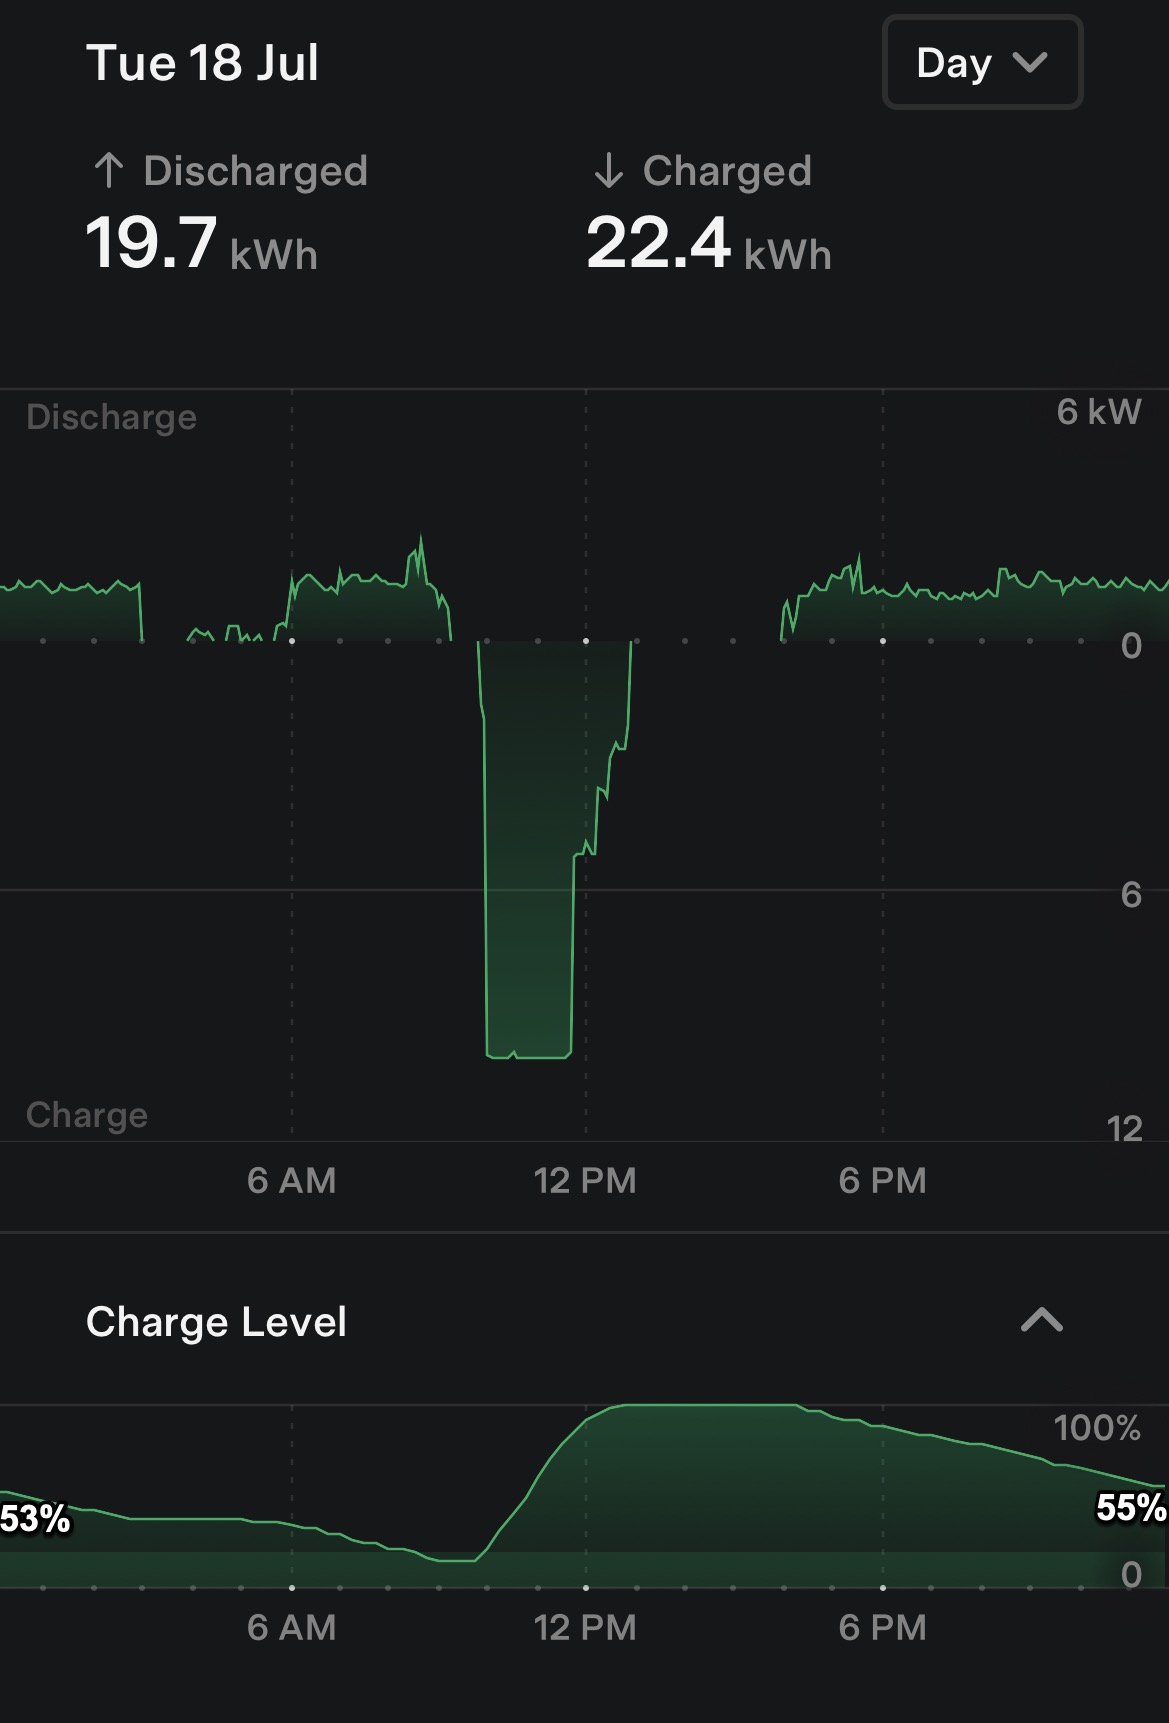
The batteries charge from 14% to 100%, adding 86% of capacity.
The batteries initially discharge from 53% to 14%, losing 39%. Following a top up, they drop from 100% to 55% – losing 45%. So they discharge a total of 86%.
So I’ve found a 24-hour period where the 2 Powerwalls charge up by 86% and discharge by 84%.
To add 86% took 22.4 kWh of electricity. I will normalise that to 84% so it matches the discharge capacity:
- 21.9 kWh was required to charge 84%.
- 19.7 kWh was delivered by discharging 84%
So 2.2 kWh of electricity was lost in the process – a 90% roundtrip efficiency – what I’d expect from Powerwall.
In terms of capacity degradation, a brand new Powerwall is sold with 13.5 kWh of usable capacity, so Sean’s twin battery should store 27 kWh when brand new (and the ambient temperature is 25ºC).
84% of 27 kWh is 22.7 kWh.
So a brand new pair of batteries in ideal test conditions should discharge 22.7 kWh.
19.7 kWh is 87% of 22.7 kWh, so the batteries are at 87% of their specified capacity by this test. Not bad.
Things to note:
- This was a winter day; the temperature overnight dropped to under 10ºC, which would hurt performance.
- It was a nice steady discharge averaging 1.15 kW of power draw. Two Powerwalls can deliver 10 kW of power, so that’s about a 0.1C discharge rate. Expect a faster discharge to generate more heat and inefficiencies.
- This pair of batteries comprises one brand new Powerwall and one 5-year-old Powerwall, so the older one should account for most of the degradation. How you measure the degradation of battery modules of different ages that are connected is a problem I can’t offer a simple solution for.
- The Tesla app lets you download the data – so you could do a better analysis by busting out Excel and combining 2 x 24h periods to watch the battery fully charge, then fully discharge, instead of discharge-charge-discharge.
- It would be easy to build a spreadsheet to automate this – I’ll ask Kim, our Excel whizz, to consider making one. Watch the blog for updates.
- You’ll learn more about your battery’s degradation by tracking how much energy is discharged over time than by a one-off snapshot. It would be nice if Tesla (and all the other vendors) showed degradation curves in their app – or an enterprising app developer launched a Powerwall Health Check app that hooks into the open Powerwall API and trends capacity over time.
How Does A Manufacturer Measure A Battery’s Degradation?
It’s fine and dandy for you to decide that your battery’s degradation is out of spec, but the manufacturer will want to verify your measurements with a more controlled experiment.
Having read battery warranty pdfs until my eyes bleed, I have found some makers very prescriptive in testing, but it’s simple enough.
- Maintain this temperature,
- charge to this threshold,
- discharge with this load
- until you reach this other threshold,
- within this time frame.
Write down the numbers you get at the end. Good documents spell it out, but to be honest, some of the warranty conditions, and the exclusions in particular, aren’t what I’d call fair and reasonable.
Redback for the win
One of the cheapest systems I’ve looked at has one of the longest warranties, while the Australian-developed Redback battery system has the simplest. Their warranty is 10 years, and when I reached out to ask if there’s any catch they just said:
“nup, mate she’s ten years.”
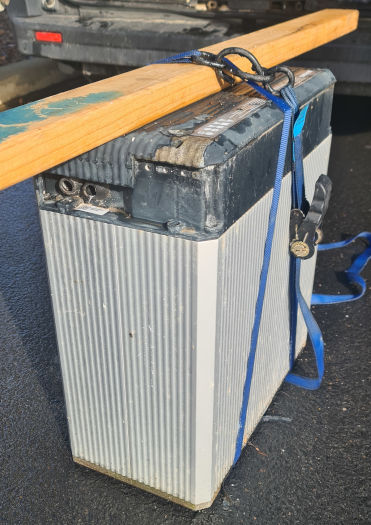
IP-rated doesn’t necessarily mean weatherproof. This garden ornament shows why I always insist batteries go somewhere cool and dry.
An example of a manufacturer’s documented capacity test
If you consult the Pylontech warranty documents, they read like this :
If any testing of the Product’s capacity is required, the testing must occur in the following conditions
a) The test is based on single US series battery module.
b) The ambient temperature of the Product must be 25℃±2℃
c) The initial temperature of the battery pods must be 25℃±1℃
d) Constant voltage(54V) constant current (0.2C-rate) charge till all the cell voltages are above 3.50Vdc or until charge current drops to less than 1 amp.
e) Constant voltage(43.5V) constant current (0.2C-rate) discharge till battery low voltage protection cut-off.
Warranties: Some Examples Are Batshit Crazy
Sorry, but I have to share my pain. This is a (thankfully superseded) warranty condition for QCells Batteries:
– Operating Temperature: If the temperature of Product (Cell/module temperature) is higher than 45ºC but lower than 50ºC or lower than or equal -10ºC but higher than or equal -15ºC for charging and, higher than 50ºC but lower than 55ºC or lower than or equal -15ºC but higher than or equal -20ºC for discharging, apart from the reduction in energy throughput caused by the degradation of cycle life due to the lapse of the operating period, the amount of energy throughput and/or the number of cycles of Product under warranty shall be reduced by (0.0065)%p per 1 minute.
Is it calculated in capacity lost per minute and degree outside spec? Or just per minute over/under the threshold? I guess that’s why they want it internet-connected because to quote the current version of the warranty:
“From the moment the energy throughput reaches the number in the table above, Qcells has the right to terminate the warranty of Product”
This is really where Australian Consumer Law is a saviour. If you’ve followed the instructions, no matter what clauses and excuses they might put in the fine print, a manufacturer must make good on whatever the marketing claims. It’s called an ‘express warranty’ and comes down to the fact a reasonable customer can expect reasonable performance for a reasonable cost.
CSIRO want a star rating for home batteries
Even the CSIRO has reached out to us trying to get a handle, not on how, but what to test batteries for. They’re concerned about the efficiency of residential battery/inverter systems because a 13 kWh battery cycled once daily might consume 3 kWh per day as internal losses, which is quite significant. My example above showed 2.2 kWh lost during a full cycle – so they are in the ballpark.
There is no star rating system or testing for residential batteries, but the CSIRO thinks there should be. I like that idea. Devising a reasonable set of tests is their next challenge, but I’d point out that if you have a large solar PV system, solar energy is cheap enough to “waste”.
At SolarQuotes We Try To Make Batteries Comparable
In our growing list of hybrid inverter reviews we have extracted numbers that makers give you and put them into context so you can compare apples with apples, almost. Some have unique features, but this is an example of our metrics:
- Nominal Warranty: 15 years – 60% capacity remaining / 29.5 MWh throughput per 6.86 kWh module
- Usable Capacity: 6.5 / 13 / 19.5 kWh
- Approx retail: $12,000 + installation for 6.5 kWh
Throughput means the kWh you have recovered from the battery, ignoring that you’ve probably lost some energy along the way as electrical and chemical losses. Note that if you run a full cycle once per day, this “15 year” battery expires prematurely. In car terms, you’ve run out of kilometres before years on the warranty.
- Throughput limit @ 1 full cycle per day: 11 years 9.5months
For a value proposition, we divided the upfront retail price by the size of the battery. It’s bang for buck.
- $-per-usable-kWh: $1,846
For a different value, we have divided the retail cost by the number of cycles you’ll get under warranty, or durability for dollars.
- $-per-warranted-kWh : $0.40 @ 1 cycle per day / $0.20 @ 2 cycles per day
Your Installer Is Your First Port Of Call
Unless it’s a significant performance issue, your installer won’t have hours to spend on your data. We really need good software to run desktop audits like that. Your installer should be happy to explain how to interpret monitoring, but it’s in your interest to take notice of the performance.
Enthusiasts are the best and worst friends of installers. They examine new products and raise issues all too readily sometimes. However, I’ve got first-hand experience with a GCL ‘ekwb’ battery that was a little shy on its numbers. The customer logged the data and lobbed it back to GCL. They admitted it wasn’t doing what it said on the tin, and sent me out with a second battery to hang on the wall in parallel. It didn’t measure up by some hundreds of watts, so they gave him 5000 more watts to enjoy. Happy days.
So What Solar Battery Should You Buy?
- Start by examining your solar monitoring or a decent analysis of your power bill. Solar Batteries make the best sense when you have surplus solar to fill them – or access to a very cheap daytime tariff. They’re not a magic bullet, so you should understand your usage and tariffs, and how a battery will work with them before dropping a lot of money.
- I wouldn’t look at something suspiciously cheap or that only promises 50% capacity at ten years, not when you can get an exceptionally good warranty for the same expense.
- There are many other options, higher price points, or chemistries and features that may be important for your particular requirements. Check our other pages for reference:-
- Hybrid Inverter Alternatives
- Battery Installation Locations
- Tesla Powerwall Alternatives
- How to Estimate The Energy Output of a Solar System
- Solar Switchboard Upgrade Guide
- Beat Solar Panel Oversize Rule
If you want the safest and most durable thing I’ve ever seen, then Lithium Titanate batteries from Zenaji or equally Arvio are probably it, combined with the best inverter of course. Still, you’ll need a healthy budget and an appetite for Australian-made hardware.
Footnotes
- Imagine if a battery manufacturer updated their app to show you the battery degradation – now that would be the ultimate proof that they stand by their battery cells’ performance. ↩
 RSS - Posts


In Tesla API, you can find the full Wh for the Powerwall, if you monitor it over time you can get an indication of the battery health
I’m in Melbourne and with that dilemma now. Use the same method. Tesla were involved 12 month ago because our 1st PW2 started degrading rapidly. I contact them annually. I also keep my installer up to date. I kept keeping the data since August 2022 and Tesla gave me their readings then and I verified that and used that as my baseline..
Installed date ==> 25-Mar-20 6-Aug-20 3-Nov-21
Serial No last 3 Ch TBV ZDH 0XA
Tesla USA 2aug22 80.23% 100.23% 101.11%
% of 70% Nominal 2jul23 77.60% 98.06% 97.94%
Just check my latest API data and I still see above 13kWh with an April 2018 battery.
I can confirm I can pull over 12.5kWh from 100% to 0% in the app.
We have charged it with 17,544.0 kWh and discharged 15,298.9 kWh
I live in Melbourne with a Tesla 2 Powerwall and 5.8 kW solar east facing. I only charge the battery with solar and in the low-sun months the battery is only getting a small amount of charge on most days. It seems to me that until I get more solar installed, the battery will only be degrading at about half or less of the rate during the low-sun months as it would degrade during the high-sun months when it is getting fully charged and discharged each day.
I have 2 SMA Sunny Islands and although these give a State of Heath, Watts in/WattsOut, I still run a manual impedance test on each battery (12v with a string of 4 giving 48v) every 3 months. Only time will tell whether the reports from the SMA will match the quarterly impedance measurements and the bi annual electronic load test (Rigol instrument). It is certainly a hands on analysis and not inverter generated. I was hoping to be able to do analysis on VRLA and Lithium but with the recall of the LG RESU 10 I have opted for 2 VRLA banks.
Battery degradation – I have a BYD battery and a Selectronic multi-mode, bi-directional inverter. I also use the Selectronic SP Link monitoring software. This software has a “Battery Management” tab. Under this tab there is a box marked “State Of Health %”. I don’t know for sure, but that implies to me that the box contains battery degradation information. Currently my battery is 100% but it was only installed in February 2023.
I’m in Montrose Victoria.
Michelle
Hi Michelle,
That’s true and correct and now you remind me, another great reason to have a Selectronic. I’m pretty sure the figure you’re seeing is a “state of health” reported by the BYD battery management, along with temperatures and voltages.
The SpPro counts kilowatt hours, which is what a lot of it’s smarts are based on. It can produce custom data sets, saved as a .csv file, so even if the number reported seemed to be out of the ordinary, you could prove what the round trip efficiency and total capacity was with an excell chart.
I hope it proves to be good value for you. If you look under the “inverter details” tab there are even figures for key component life. They’ll let you know if the inverter is ever due for a service.
Cheers
Hi Everyone.
Tesla app reports over 4 year operation:
Total solar energy charged: 8.8 MWh.
Total discharged energy: 7.5 MWh.
This gives a relative error of -14.8 percent.
That is to say the turn around loss is 14.8 percent.
Location is Newton SA 5074.
Tesla Powerwall 2 is outside against brick wall, covered from rain and shaded.
This, I believe, is a bad result.
I am willing to discuss these results, initially by phone, but could followup with spreadsheet analysis.
There is a rather interesting third party freeware program available on the PC that does simple Tesla monitoring.
Kind Regards
Lester C. Payne
Hi Lester,
We’ve lamented that cars seem to have third party monitoring apps but house batteries don’t, so please keep us updated with what you find in terms of software, links are great. I’ll talk to the management about conversations and spreadsheets.
Cheers
TIP: When calculating State of health of a battery using kWh supplied, vs kWh charged, ideally what to be looking at the DC side figures, otherwise have to factor in the Inverter’s AC to DC and DC to AC efficiency losses.
The following info was recorded elsewhere on solarquotes, but this is the correct location for it.
The latest “Powerwall Companion” Windows app 04.10.0.0 or later now has a Battery Stats page to show current Capacity & Degradation %, BUT…
with the Powerwall2 Firmware 23.44.0 eb113390 (Dec 2023) or later (at present), it appears Tesla has removed the ability to get data like capacity etc…, this was also reported by several US users on the Tesla Motor Club WEB sites in Dec 2023.
With this latest firmware it appears the “Powerwall Companion” App can no longer report the correct current capacity, it appears to show only the original Max capacity.
Actual capacity data is still available with Powerwall2 Firmware version 23.36.3 aa269d35, but will not be for long, because the Tesla firmware update is automatic, in batches & will happen, regardless.
Is Tesla intentionally hiding information, like the current Powerwall2 capacity?
I use Home Assistant, and it has an integration for Tesla Powerwalls – https://www.home-assistant.io/integrations/powerwall . The integration creates sensors to report for each Powerwall battery the total since installed energy exported and imported in kWh.
I have two Powerwall 2 batteries that is running firmware 23.44.0 eb113390.
My Powerwall2 / Gateway just upgraded to Firmware: 24.4.0 0fe780c9
which unfortunately broke the Powerwall Companion.
Tom Hollander, the author of the Powerwall companion quickly fixed the percentage full, but the capacity i/ degradation information is no longer available via the API.
Why did Tesla remove the capacity/degradation info from the API?
The capacity/degradation information is still available within the Powerwall/gateway, but no longer via the API.
I’ve been watching my Powerwall2 for some months now, where I noticed it was degrading on a daily basis. I have not done the projected calculations as yet, but it is very obvious it will encounter the 30% degradation in the next year or so, well before the 10 year guarantee mark.
My latest Powerwall2 was only installed on 2022/06/06, as a replacement for the original Powerwall2 installed 2022/03/07, which went BANG (very loud bang) in the first months of operation (permanent DC fault).
The replacement Powerwall2 is currently (today 2024/03/22) at 17.5% degradation.
Note: I have a friend down the road who also has a Powerwall2, installed 2020/09/16 and it still shows >13kWh capacity.
BTW. (note only)
When the Powerwall2 was installed (both times) the reserve was set to default of 5%, it was left at that and was not changed, until an email from Tesla on 2023-05-26 where Tesla suggested the reserve to be set to 20%, which I did.
I was wondering about aspects that may prolong lifespan of home batteries, specifically the powerall2. Does a higher backup reserve level (ie the minimum level of charge reached during normal usage) effect the lifespan? I have read up from battery university on all their data and with other devices i stick to the 20/80% guideline where possible, but wonder if there is any data for home batteries?
I realize 70% at 10 years is the warranty, but for instance would keeping a battery reserve of 5% vs 30% potentially make a difference at year 12, 15, or optimistically 20?
I guess I’m thinking long term and trying to push the point where the available power falls of a cliff to as far back as possible. I have seen commenters mention that tesla support have said the backup battery level won’t effect the lifespan of the battery, but I suspect to tesla the lifespan is 10 years rather than the hopeful “long as possible” that I have,
And with monitoring degradation with the excel sheet – if there are months with low usage, is it a good idea to combine 2-3 days to get enough usage for decent data? I’m up north in FNQ and so winter days only use 2-3kWh from the battery overnight and with such small usage numbers the excel sheet output can vary wildly (I assume from small rounding errors). Obviously a big day of usage is better for the data (less effect of rounding errors) but in a pinch is combining a few days worthwhile?