
In May last year I investigated what the total cost of electricity was for a typical household in Australia’s states and territories. I found that rather than South Australia having the most expensive electricity, as the Coalition claimed, once the effects of fixed charges and controlled loads for hot water were taken into account, it was the second cheapest state for household electricity.
Unfortunately, South Australia has suffered a huge rise in electricity prices since then, so I decided to check what typical households are now paying for grid electricity across the country.
I’d like to keep you in suspense about who pays the highest total cost of electricity until the end of the article, but as you’ve probably read the title it’s a bit late for that. Besides, it’s possible a politician will read this and it’s a miracle if they ever read past the introduction, or executive summary as they call it.
To quickly sum up the results, as far as the average punter is concerned, Adelaide has clearly shifted to worst place while Sydney’s electricity is now the most affordable in the country, despite price rises in the middle of last year.
Benchmarks For Household Electricity Consumption
When I looked into this 10 months ago I wasn’t happy with how out of date the information I had on household electricity consumption was. Fortunately, I now have a report published in October 2017 for the Australian Electricity Regulator on household energy benchmarks. This report gives the figures put on electricity bills so people can compare their consumption to the average in their area. This made it easy for me to compare electricity consumption between states — or it would have if the report hadn’t transcended outmoded concepts such as “states” and given the information by climate region instead.
I suppose I could have gone through the report and organized the information on a state by state basis, but quite frankly I have better things to do with my time. I really do — honest! I have a library book and I’m not afraid to read it!1 Fortunately, I can extract information for state and territory capitals and I am happy with using that.
Household Electricity Consumption Is Declining
I like having more up to date information because household grid electricity consumption changes over time. For example it keeps declining, as this graph from the report shows:
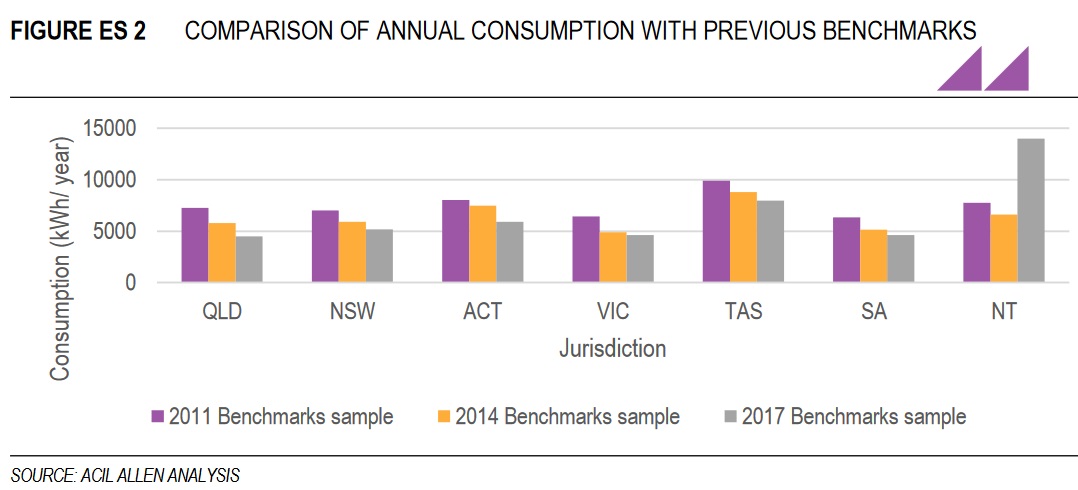
As you can see, household electricity consumption (and it is household electricity consumption despite it not being clear in the title) has fallen in every state shown. The Northern Territory is a weird outlier, but it’s not a state and should have become one if it wanted me to be concerned about its electricity consumption2. The reason why household grid electricity use is declining is due to increasing uptake of rooftop solar power systems and improved efficiency, both largely driven by increasing electricity prices.
Household Size
While the average Australian household size is 2.6, the typical household size is 2 people on account of how the police have a tendency to investigate any situation involving only 60% of a person. Here is a graph from the report showing a breakdown of household sizes in case you don’t believe me:
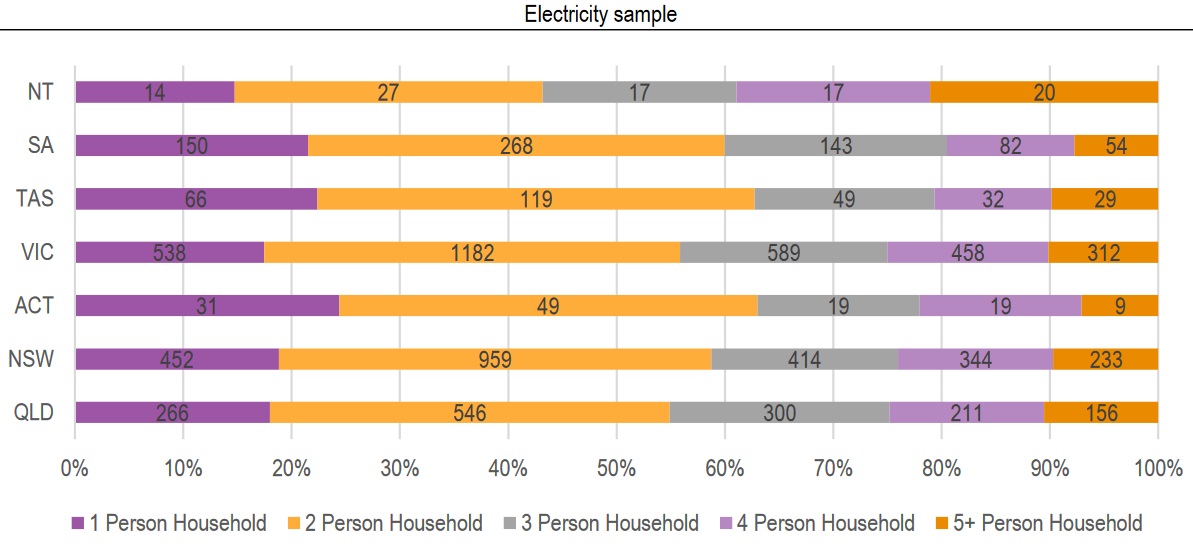
As you can see, the most common household size in every state and territory is two.
Calculating The Total Cost Of Grid Electricity
It’s possible to work out the total cost of electricity for typical 2 person households in the various capitals by looking at their:
- Benchmark grid electricity use
- Annual total of per kilowatt-hour charges
- Annual fixed costs
I can determine the total cost of grid electricity per kilowatt-hour used by adding the annual kilowatt-hour charges and annual fixed costs together and then dividing the total by benchmark electricity use. This will let us see what people actually pay for every kilowatt-hour they use.
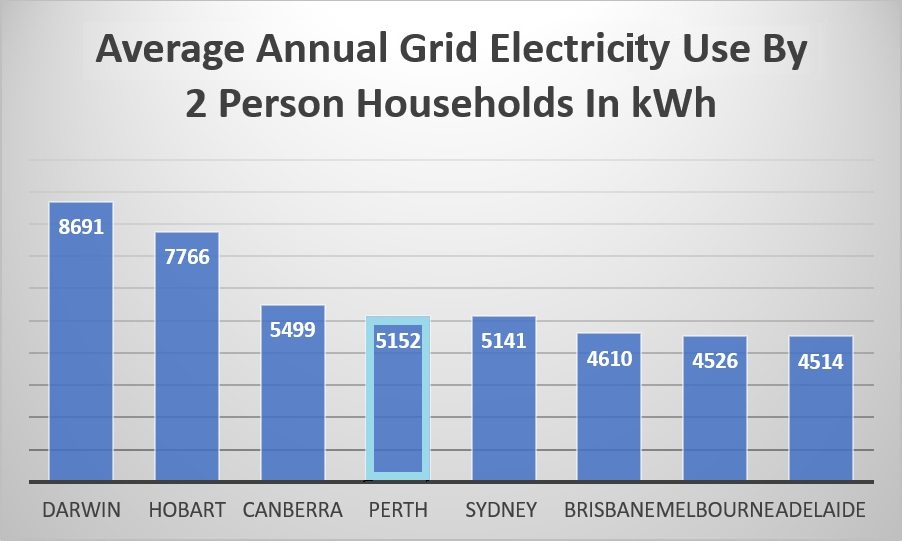
Benchmark Grid Consumption For 2 Person Households
This graph shows the benchmark grid electricity consumption by capital for 2 person households. Unfortunately, the benchmark report did not cover Western Australia, so for Perth I recycled the figure I used for WA last year. I’ve put a pretty pale blue border around it to serve as a reminder it’s not from the same data set and so comparisons will be a little iffy:
Charge Per Kilowatt-Hour
The amount households are charged for each kilowatt-hour of grid electricity they use is fixed in Darwin, Hobart, and Perth, but in other capitals amounts vary between electricity retailers. As Origin Energy is the largest electricity retailer, their prices should be the most typical. As their Maximiser plan appears to be the best value I will use that where it applies3, as they normally make the most sense for solar households, and not. In Sydney there is a minor price difference between east and west suburbs and so I simply selected a point in the middle. For Melbourne I used a figure typical for the suburbs where the bulk of people live and not the City Center:
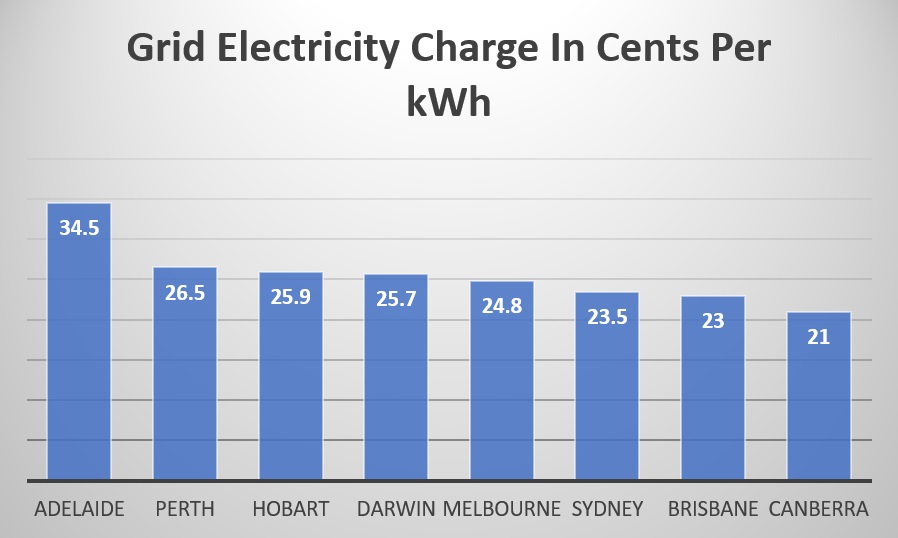
As you can see, Adelaide is way out ahead on the charge per kilowatt-hour while Canberra is the cheapest.
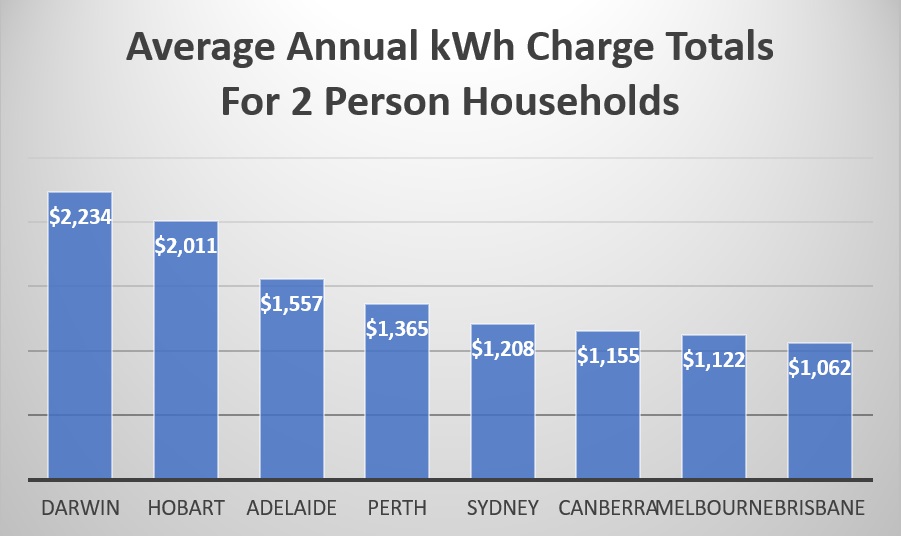
Multiplying these prices by the benchmarks for annual electricity consumption for 2 person households gives the following annual kilowatt-hour charge totals:
Annual Fixed Costs
This is a graph of annual fixed charges. Once again I used Origin Energy’s Maximiser plans along with the same method used to determine per kilowatt-hour charges:
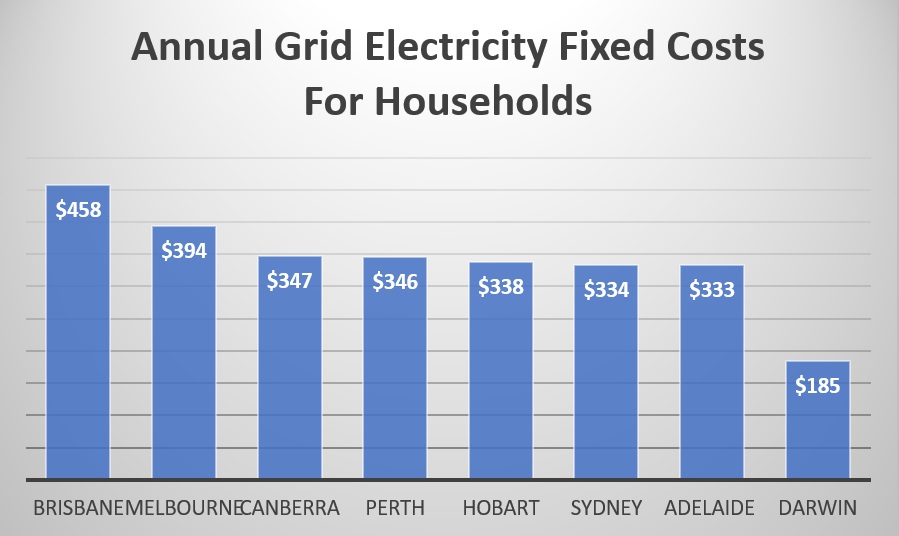
While it is beaten by the Northern Territory, South Australia is the state with the lowest fixed costs, even though it only wins by $1. This has changed from last year thanks to Western Australia doubling its daily supply charge in an apparent attempt to make poor people bear a greater burden of electricity price increases than the rich.
Total Cost Of Grid Electricity Per Kilowatt-Hour Used
Using the above figures I can now work out the total cost of grid electricity per kilowatt-hour used for typical households by taking into account the average number of kilowatt-hours used, the charge per kilowatt-hour, and fixed costs:
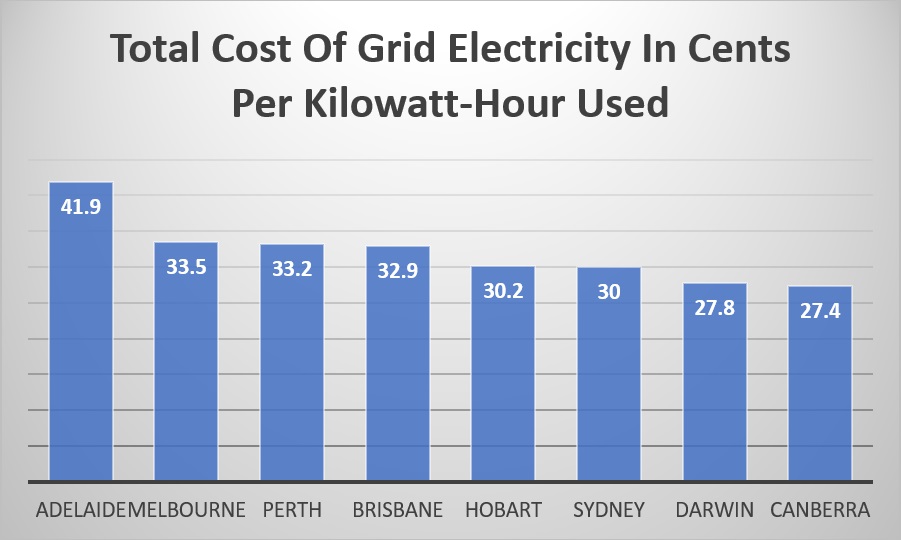
As you can see, despite South Australia having the lowest fixed costs of any state, Adelaide comes out way ahead of any other state capital on total cost of electricity per kilowatt-hour. Sydney is the lowest cost state capital and Canberra has the most affordable grid electricity overall.
However, this graph does not take into account the effects of controlled loads used for hot water systems on electricity costs. But I’m afraid it’s not going to have enough of an effect to shift Adelaide out of worst position.
Controlled Loads For Hot Water And Total Cost Per Kilowatt-Hour
In Melbourne, Perth, and Canberra the typical household uses gas for hot water and so the effect of controlled loads can be ignored there and controlled loads aren’t available in Darwin. I will assume in other locations controlled loads for hot water make up the following portions of total grid electricity use:
- 25% in Adelaide, Sydney, and Hobart
- 20% in Brisbane
Taking into account the total cost of controlled load hot water, again using Origin Maximiser retail plans and including any supply charges, discounts, and GST — the total cost of grid electricity per kilowatt-hour for typical households would be:
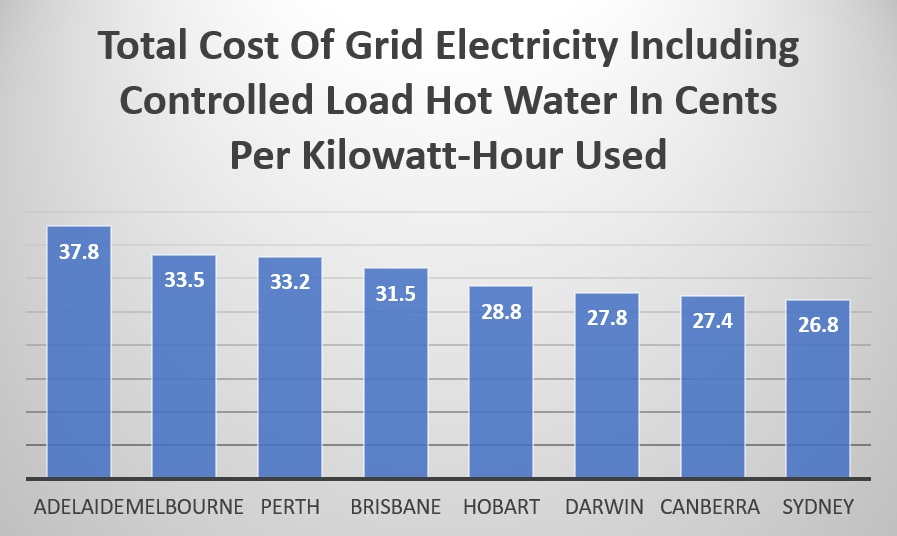
While the total cost of electricity in Adelaide has declined, it’s still well ahead of all other capitals. Thanks to its low controlled tariff rates, Sydney has the lowest total cost of electricity for typical households.
Last year I found the total cost of electricity in South Australia was the second lowest of all the states, so this is a large change. Part of it is likely to be due to using newer survey information, but the main reason why South Australia’s total cost of grid electricity is now the highest in the country is because half the electricity generated in the state comes from natural gas and its price has soared.
I will soon write an article that goes into detail on why South Australia’s electricity prices are so high. In fact, that article is already written. I just need to translate it from drunk into English.
—
UPDATE: May 21, 2020: SolarQuotes has developed a tool that enables solar owners to easily compare electricity plans and feed in tariffs.
—-
Footnotes
- The library book is by Ian M. Banks and called Consider Phlebas. So far the most interesting thing that has happened is the main character has given a fat guy the finger and killed a lot of people with his bad driving. As for the main character standing out, I think he could replace almost anyone else in the book and no one would notice. ↩
- If I am reading the report correctly, the reason why Darwin has such high household electricity consumption is because 50% of homes there now have pools, so the benchmark now assumes the typical home has one and they tend to use a lot of electricity. According to the report, a 2 person home in Brisbane with a pool will use 2,634 more kilowatt-hours of grid electricity a year than one without. ↩
- I have only looked at their standard tariffs and not time-of-use tariffs. If you have solar you are usually better off with a standard tariff, though this can change if you get a battery. ↩
 RSS - Posts


Oh no,
I’ve been sharing your previous article headline with the anti renewables muppets on the Advertiser forums constantly parroting the “most expensive in the World” line. I doubt any ever read the article though. I’ll have to stop doing that.
Really? so NSW rural, Port Macquarie is the cheapest/most expensive in the country?
Origin Maximiser ending 21 Jan 19
Issue date
26 Feb 18
Benefits available on this energy plan
Guaranteed usage discount (25%)
Peak Usage 35.08 c/kWh
Off-Peak Usage 19.40 c/kWh
Shoulder Usage 33.77 c/kWh
Supply Charge 141.01 c/Day
We all know when the peak, shoulder and off peak times are, so let’s, not kid ourselves please.
Regards
Mike Schaffer.
Looking up their standard rate rather than time-of-use so I can compare like to like, I see with discount and GST the per kilowatt-hour charge is 24.2 cents. So very jealous. Still worse than in Sydney though.
The data for the NT still seems odd. I’m struggling to believe that swimming pools are the cause. Its one place where you’d never want to heat the pool – on a hot day/evening you want a ‘refreshing dip’, not a dive into a ‘living-room sized tepid bath’.
On project’s I’ve been involved with in the NT, we always put solar hot water on the roof. But we never connect the electricity element in the heater. Never found it necessary.
Something still seems funny about the NT data.