
The 21st century has brought radical change to South Australian electricity generation. Eighteen years ago SA had the least renewable energy in the country thanks to hydroelectricity being a tough sell in a location as dry as a Sao biscuit and twice as flat.
But that didn’t stop South Australia going from a single 150 kilowatt wind turbine and a handful of solar panels to become a world leader in renewable energy, with more than 60% of its generation now coming from wind and solar power.
Last month the South Australian Electricity Report for 2020 was published by the AEMO, which are the mob in charge of keeping our electricity grids ticking over. I read through the whole thing — except for the parts I didn’t — and found it was full of interesting information on the state’s ongoing transformation to net zero-carbon generation.
I’ll summarize the most interesting points in the report in this article, but on account of my sunny disposition, I’ll particularly focus on solar power, despite the bulk of the state’s clean electricity generation currently coming from wind.
Positive Points From Report
The report states that in South Australia during the 2019-20 financial year:
- Total electricity generation increased 0.6%, but there was a pandemic related 1% drop in per capita consumption.
- The state’s generation was 59.6% renewable: 42.9% wind and 16.7% solar energy.
- For one hour on 11 October, solar energy generation was enough to meet the state’s entire consumption.
- 33% of SA homes now have rooftop solar panels.
- Rooftop solar provided 11.6% of generation.
- By June 30th 2020 rooftop solar capacity totalled 1,417 megawatts. A 27% increase from 12 months earlier.
- Approximately 6,000 home and business batteries were installed, bringing the total to around 17,000.
- Net electricity exports to Victoria were 6% of electricity generation.
- Plans for an interconnector between SA and NSW moved closer to approval.
I’ll go into more detail on these points below, but first I’m afraid I must reveal it’s not all good news.
Problematic Points From Report
Getting South Australia to a point where wind and solar are over 60% of generation has provided plenty of challenges. There are problems involved with integrating energy from large scale wind and solar farms as well as from rooftops. Rather than go into the multitudinous problems in great detail, I’ll merely mention two major ones:
- Declining grid stability.
- Limited transmission capacity.
While some people moan and groan about the grid’s growing pains as it accepts more renewable energy, the challenges of greening the grid are a lot easier to deal with than global warming causing even worse bushfires or simmering the oceans into rotting soup.
Per Capita Consumption Down 1%
Electricity production is down around the world thanks to the pandemic, but in Australia the fall has only been a couple of percent. South Australia appears to buck the trend as electricity generation in 2019-20 rose 0.6%. But because electricity exports to Victoria increased, state electricity consumption actually fell by 0.3%. Allowing for typical annual population increase, South Australia’s per capita electricity consumption fell 1%.
While this will mostly have been due to the pandemic related economic slowdown, some will be from improving energy efficiency, and weather will also have had an effect.
Wind & Solar Now Over 60% Of Generation
In 2019-20 renewables supplied 59.6% of all electricity generation. As net electricity exports were equal to 2.8% of generation it means the state generated renewable energy equal to 61.3% of its total consumption.
The renewable generation was almost entirely wind and solar power. While there is an itty bitty baby hydroelectric generator attached to the grid, its output is basically a rounding error as it produces as much energy as half a 3 megawatt wind turbine. The percentage of electricity generation supplied by the two serious sources were:
- Wind: 42.9%
- Solar: 16.7%
Because the figure of 59.6% renewable generation was the total for the 2019-20 financial year that ended 5 months ago and solar capacity has continued to expand since then, I now officially announce1 that South Australia’s electricity generation is over 60% renewable.
Solar Energy Generation Up 35%
Solar is by far South Australia’s fastest-growing source of electricity supply. Its output in 2019-20 increased 35% from the year before.
The AEMO now divides solar generation into 3 categories. Most people know the first two:
- Rooftop PV: These are solar panels on the roofs of homes and businesses. Despite the name, a small portion is mounted on the ground.
- Solar: While the name may make you think this category refers to all solar, it’s actually only large solar farms with hundreds of thousands of panels.
The AEMO also has a third category that’s between these two:
- PVNSG: This stands for PV Non-Scheduled Generation2 and covers smaller solar farms that are above 100 kilowatts but not large enough to fit into their solar category. These modest solar farms can be several megawatts in capacity and are usually installed by large companies to directly offset their grid electricity consumption. This is the fastest-growing category.
The percentage of electricity generation supplied by each in 2019-20 and how much their capacity grew over that year was:
- Rooftop PV: Supplied 11.6% of generation and grew 20.9%.
- PVNSG: Supplied 1.8% of generation and grew a whopping 138.9%.
- Solar: Large scale solar farms supplied 3.3% of generation and grew 60.1%
Fossil Fuel Generation Down 8.8%
Fossil fuel based electricity generation, which is over 99% natural gas in South Australia, fell 8.8% from the previous year and provided 43.3% of generation in 2019-20. The now low cost of solar power means this is going to occur around the world, so the idea of a natural gas led economic recovery is as nutty as a Nutella sandwich that uses peanut butter brittle for bread.
Battery Capacity Expanding
In the report, battery storage is classified as a supply source. If this seems odd to you — good! Because there are unavoidable losses when charging and discharging, batteries will always provide less energy than what is put into them. But because they can act like a dispatchable power station and supply power on demand, I can see why they’re on the table.
While they suck up more energy than they spit out, because they suck when it’s convenient for the grid and spit energy when it’s most needed, they’re beneficial things to have around. While in 2019-20 battery storage only supplied stored energy equal to 0.32% of total generation, the AEMO expects battery capacity to rapidly increase.
Over 2019-20 roughly 6,000 home and business batteries were installed in South Australia, bringing the total to around 17,000. That was a 35% increase. The AEMO estimates the amount will triple to about 50,000 by 2025. If 90% of the batteries are residential, that’s 1 in every 15 homes.
Greenhouse Gas Emissions Down
In just 7 years South Australia halved greenhouse gas emissions from electricity generation. This graph shows them falling from 600 grams of CO23 per kilowatt-hour to 290 grams:
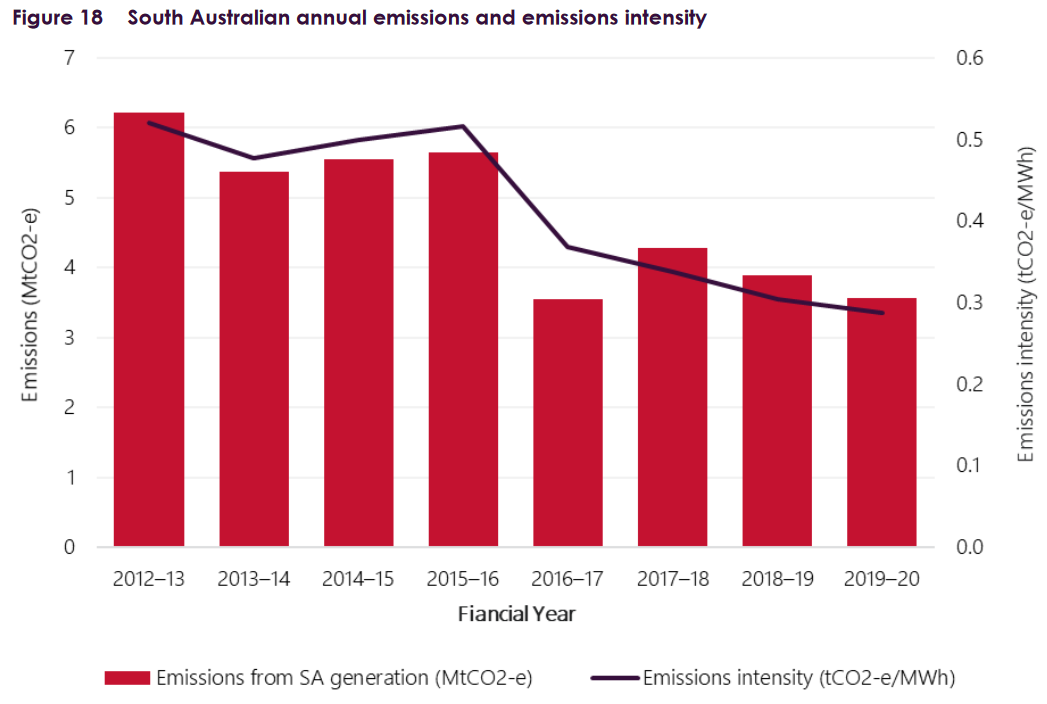
This shows greenhouse emissions dropping by more than half per kilowatt-hour over 7 years. The word “Fiancial” at the bottom is a sophisticated way of saying “Financial”. I would explain how cool the AEMO is for using it but — let’s face it — unless you’re super cool like me and the AEMO you probably just wouldn’t get it.
Committed New Supply is 100% Renewable
Committed new supply refers to grid generation projects almost certain to go ahead. At the moment they’re all renewable. New capacity that will be completed by March 2022 in South Australia consists of:
- 296 megawatts of new wind power.
- 87 megawatts of new solar farms.
Note these figures don’t include rooftop solar power and smaller-scale solar farms (PVNSG in AEMO speak.)
Prospective New Supply Is 87% Renewable
Proposed projects that are iffy on whether or not they’ll actually go ahead are called prospective new supply, and these projects are 87% renewable by capacity. While this percentage may seem impressive, it was 91% before the pandemic caused some projects to be cancelled and lowered the cost of gas and diesel. Despite this temporary reverse, the trend is clear. Thanks to the falling cost of renewables and energy storage soon no one will want to build new fossil fuel capacity.
The total prospective new supply as of November 2020 in South Australia is…
- Gas: 803.2 megawatts
- Diesel: 154 megawatts
- Solar: 2,783 megawatts
- Wind: 3,623.4 megawatts
Note this doesn’t include rooftop and small scale solar farms (PVNSG).
Big Batteries May Be Built
In addition to the large number of home and business batteries expected to be installed, larger-scale projects are likely to go ahead in South Australia.
Committed battery projects are relatively small and consist of two Virtual Power Plants (VPPs) making use of home batteries:
- SA Government VPP with 5 megawatts of power and 13.5 megawatt-hours energy storage.
- The Simply Energy VPP with 6 megawatts of power and 16 megawatt-hours energy storage.
But if an interconnector to NSW is built then the massive Goyder South Hub battery is also likely to go ahead. This will have 900 megawatts of power and 1,800 megawatt-hours of energy storage. This is enough to supply more than one-quarter of South Australia’s maximum grid demand for up to two hours.
When all the prospective new supply for larger-scale battery projects are added together it comes to 1,567.6 megawatts of proposed battery capacity. While a figure for energy storage capacity wasn’t given, it would be well over 2,500 megawatt-hours.
SA To NSW Interconnector Likely
Project EnergyConnect is a plan to build an 875 km transmission line between South Australia and New South Wales. It’s estimated to lower electricity bills per household in South Australia by around $100 and $61 in NSW. Because there are four and a half times as many people in NSW that state actually gets the most benefit.
Despite recently bumping up the estimated cost from $2 billion to $2.5 billion, it’s very likely the interconnector will go ahead because interest rates are extremely low and are turning negative for the federal government. This means the interconnector only has to earn back around as much money as it costs to build to be a worthwhile investment. Because it will allow increasing renewable capacity to be more easily integrated into the grid and reduce fossil fuel use, it will have benefits beyond lower electricity bills.
Renewable Expansion Faces Challenges
The expansion of renewable generation in South Australia is wonderful because it means we’re less likely to be killed by our own pig-headed stupidity. If South Australia can rapidly reduce greenhouse gas emissions then other locations can also do it, which will allow humanity to limit the damage it’s causing through global warming.
But it hasn’t been all beer and skittles. South Australia has faced numerous challenges in exceeding 60% renewable generation. Fortunately — despite a large number of idiots intentionally getting in the way — the state has handled them admirably and I expect the state to continue to do so even while concurrently exceeding its idiot quota.
The reason why I expect renewable generation to continue to expand is because big companies like making money more than they like losing it. Using solar, wind, and energy storage is now generally cheaper than fossil fuel alternatives even when fossil fuel generation doesn’t have to pay for the health and environmental costs of its emissions. But just because renewables will expand doesn’t mean it won’t create problems that have to be dealt with.
Two major problems that being handled in a variety of ways are:
- Reduced Grid Stability, and…
- Lack of transmission capacity.
Grid Stability: To maintain grid stability the state is building large spinning devices called synchronous condensers that stabilize the grid in the same way as fossil fuel generation without the need to burn natural gas or coal. Increasing battery storage is also expected to play a major role in providing stability as it can provide power — or use it — almost instantly.
Stricter inverter standards for new South Australian rooftop solar power systems rushed in earlier this were also designed to increase grid stability. These included the capacity for remote disconnection for new solar systems. Despite some panicked people’s pessimistic and improbable prognostications, the amount of time systems are likely to spend disconnected should be almost insignificant. I expect it to average around one hour or less per year. While the way the new standards were introduced caused plenty of headaches, they will help increase the amount of power distributed solar systems can provide the grid.
Transmission Capacity: More high capacity transmission lines are likely to be built within and between states, but local transmission in towns and suburbs is also an issue. Many locations are having difficulty accepting more power from rooftop solar panels.
To allow new distributed solar to continue to be supply power to the grid a flexible export requirement is likely to be introduced for new solar inverters. This involves allowing them to export as much power as they can provide when the grid can accept it, while throttling back when it becomes a problem. This is being trialed in South Australia and will improve grid stability as well as help maintain solar energy exports from new installations.
Islanded SA Handles ~60% Renewables
South Australia’s electricity generation is now over 60% renewable. Because the state’s hydroelectricity is piddly, that’s basically all wind and solar power. This is three times the amount many insisted — without real justification — was an absolute limit just a few years ago.
In case there is any doubt a grid can handle having around 60% of its electricity generation coming from wind and solar, early this year storm damage to the Heywood interconnector caused South Australia to be islanded from the rest of the National Electricity Market from the 31st of January to the 17th of February4. It occurred in summer, which is the worst time possible as high air conditioner use strains the grid. Also, due to where the damaged occurred, South Australia had to supply power to Victorian freeloaders such as the Alcoa Portland aluminium smelter. While the AEMO doesn’t recommend repeating the experience without strengthening the grid, South Australia managed the situation without major problems.
100% Clean Electricity Not Far Off
To prevent that big reef in the ocean off Queensland becoming known as the Great Barrier Skeleton, the world needs to cut carbon dioxide emissions by a minimum of 80% over the next decade or so. Thanks to a lot of hard work by unseen armies of dedicated people who have tirelessly toiled to bring down the cost of renewable energy and storage, this has become a lot easier and South Australia is helping show the world it’s possible.
While 100% renewable generation may still be many years off, there is no reason why South Australian electricity generation can’t rapidly shift to zero net emissions over the next few years. While a considerable amount of existing gas generation may be needed for an extended time to firm the grid and meet demand when renewables and energy storage aren’t sufficient, it won’t be particularly difficult or expensive to offset South Australia’s remaining generation emissions. While estimates will vary, if we’re lucky, in a few years it may cost as little as one tenth of a cent per kilowatt-hour generated in the state. So I’m calling for zero net emission electricity generation for South Australia by the end of 2023. Wouldn’t that be great?
Footnotes
- Using the power vested in me by my mum. ↩
- The non-scheduled part mostly means they aren’t large enough to be required to send fiddly details of their operation to the AEMO. ↩
- Technically this is CO2 equivalent, which includes all greenhouse gases released and not just the main one which is CO2. (While water vapour is a greenhouse gas it is not included in CO2 equivalent because adding more water to the sky just tends to make more water fall out.) ↩
- The much lower capacity, 220 megawatt, Murraylink interconnector was still operating, but because it’s a High Voltage DC line rather than AC, it can’t directly contribute to grid stability. So the state was still islanded by AEMO definitions and no longer synchronized with National Electricity Market. ↩
 RSS - Posts


Ron:
You used to be regarded as a man who would and could quite appropriately and unashamedly present both ‘pros and cons’ for any argument; on any topic; and more particularly technology development trends that applied to the imperatives for the new age GLOBAL power generation technology sector moving forward.
In this SA focused presentation though you have chosen to discount the cons?
Have you lost your passion for in depth objective critical analysis of the broader technology subject Ron?
If so – we are all now as followers and interested readers, less the wiser for your shift.
Lawrence Coomber
There are no show stoppers. If there were I would have said so. As mentioned, there are a lot of challenges to overcome, but I get tired after 3,000 words so I didn’t go into detail.
Thanks Ron. I accept that. It’s a complicated subject to connect all the dots, particularly from a global perspective.
Lawrence Coomber
re footnote 4)
“it can only transmit energy”
or should this read
it can only transmit power
?
Well, if you just wait a little while, it will transmit energy. But that is a good point and I’ll reword the footnote to make it clearer. Thank you for pointing it out.
Why does electricity cost so much in South Australia. Is it because of the return on investment by wind and solar farms and grid scale batteries. It will be interesting to see how the uptake of electric cars using fast chargers (350kw) affects grid stability and end user costs.
A lot of people put the cart before the horse on this. The reason South Australia has a lot of renewable generation is because electricity is expensive there.
Also, as of yesterday, SA had the lowest Average Wholesale Spot Price in the NEM for this financial year so far
https://www.aemo.com.au/energy-systems/electricity/national-electricity-market-nem/data-nem/data-dashboard-nem
That link probably isn’t going to the page you wanted, but I can confirm the average wholesale electricity price so far this financial year has been lower in South Australia than any other NEM state. And I’m very confident WA isn’t beating SA either.
Yes that is the AEMO landing page. Average price is the 3rd tab
REGIONID AVGRRP
NSW1 51.46
QLD1 36.31
SA1 35.88
TAS1 48.18
VIC1 46.13
If that is the case, why is the retail price to domestic users so high ?
Hi Richard
First off, lower wholesale prices won’t be passed on to customers until next financial year and, unfortunately, SA has the highest transmission and distribution costs in the National Electricity Market. This article goes into some of the details:
https://www.solarquotes.com.au/blog/solar-electricity-bill-breakdown/
And if you scroll down to “Electricity Bill Components By State & Territory” it will give an approximate breakdown of the different parts of a residential electricity bill.
This report gives some detail around the costs of the various components for a representative customer
Given SA has a very peaky grid and January is usually a struggle I don’t expect SA to retain the crown
https://www.aemc.gov.au/sites/default/files/2019-12/2019%20Residential%20Electricity%20Price%20Trends%20final%20report%20FINAL.pdf
A comparison between the states and territories, for the figures above, would be good, and, because the different states and territories have different populations, where absolute values are given above, values per unit of population (eg, per person or per 100 people or per 100 people), as much as practicable, would be good.
Of course, because WA is not part of the “national” grid (and, some regard WA as not being part of Australia), the references to the interconnector (which sounds a bit like the intergalactic laxative, for anyone else old enough to remember the usage of the term, as it would probably be useful for the people behind the spacex thing that recently blew up when trying to launch it), also do not apply to WA.
yes, of course – how fortunate one is to be in WA!
Seems to me, a third issue that hasn’t been taken into account (after grid stability, and transmission capacity), is large grid-scale energy storage.
From my regular review of the Supply & Demand Widget, it appears that SA is achieving its 60%, by using Victoria as a “battery” – when intermittent energy exceeds demand during the day, it is exported to Vic to reduce their Brown Coal consumption (saving a lot of pollution), but then at night SA usually import their “renewable credits” back from Vic to make up any energy shortfall – but to do this Vic then has to burn more brown coal largely negating the daytime pollution benefit. Doesn’t this make SA’s claim a little “fake”? Good for SA, not good for the World?
So what happens once other States reach a similar level or renewables generation to that of SA – and THEY would rather be exporting energy for renewables credit during time of excess generation, rather than importing (or being able to import) SA’s excess?
Of course large-scale storage is the answer – but as far as I can see, this is not a very economic solution at the present time. Perhaps this is what has been holding (isolated) WA back – Synergy claim they were amongst the first to have significant renewables, yet SA have seriously out-paced us.
Perhaps Brett is referring to the Infinite Improbability Drive?
Terrific article summarising the SA story. We could learn a lot here in Victoria from the progress made over the border.
Thanks
Things may change yet again from next yr onwards. With both way energy transfer for electric vehicles becoming a realty and on the market from players like Hyundai who also manufacture the KIA brand, so in the price range that will be within the average household if the advantages or 2 way energy transfer are factored in, real time storage and load shifting will reduce the excess problem and sort some of the deficit problem after the sun goes down. A household that can store 40kWh of solar and use/resell it at night during the peak power period, forget the govt back household battery, better to get a free fuel car for mum’s taxi service that can store your own generated solar for when you need it ……. A decent 6.6kW solar array could generate 27kWh for storage with 5 peak sun hrs per day, double the array and only connect the second system to the electric vehicle battery and things really change for the better as far as being self sufficient electricity wise ….. Then you have to ask yourself, do you still need to be paying those excessive grid connection fees?
T1 Terry
You seem to forget that each turbine is subsidised by your taxes at $700,000.00. plus land owners are getting paid annually for having them on their land. Household solar and battery back ups are subsidised 50 percent by the tax payer. The life span in Turbines is only 20 years they only run at around 40 percent capacity Solar has a life span of 25 years The batteries around 10 years the inverters about 10 years . You still need reliable despatch able power. Europe England the USA have nuclear power as their reliable despatch able power
You make us sound like angels spending large amounts to keep the earth safe.
Or Ostriches…???
Wayne,
You state: “You seem to forget that each turbine is subsidised by your taxes at $700,000.00.”
Credible reference please, Wayne?
Then you state: “plus land owners are getting paid annually for having them on their land.”
Are you suggesting land owners hosting wind turbines on their land get nothing (or perhaps pay for the privilege), Wayne?
Then you state: “Household solar and battery back ups are subsidised 50 percent by the tax payer.”
Where does this happen, Wayne? Again, credible references please.
Then you state: “The life span in Turbines is only 20 years they only run at around 40 percent capacity”.
Like anything mechanical, good maintenance and favourable conditions can enable good quality turbines to last 25 years or longer.
See: https://www.bbc.com/news/business-51325101
Fossil fuel generators have similar or lower capacity factors.
Per US Energy Information Administration data, annual average US capacity factors in 2019 for utility scale generators:
* Coal: _ _ _ _ _ _ _ _ _ _ _ _ _ _ 47.5%
* NG Combined cycle: _ _ _ _ _ _57.3%
* NG Gas turbine: _ _ _ _ _ _ _ _ 11.3%
* NG steam turbine: _ _ _ _ _ _ _ 14.1%
* NG Internal Combustion: _ _ _ _15.3%
* Petroleum Steam Turbine: _ _ _ 12.8%
* Petroleum Gas Turbine: _ _ _ _ _ 1.0%
* Petroleum Internal Combustion: _ 2.0%
See: https://www.eia.gov/electricity/monthly/epm_table_grapher.php?t=epmt_6_07_a
You finish with: “Europe England the USA have nuclear power as their reliable despatch able power”
Nuclear fission generation is not able to ramp up and down quickly – it’s ‘baseload’, NOT ‘dispatchable’.
Nuclear is much more expensive – see: https://www.lazard.com/perspective/levelized-cost-of-energy-and-levelized-cost-of-storage-2020/
Nuclear fission technologies are too slow to deploy – for an inexperienced nuclear country like Australia it would take 15 to 20 years. Meanwhile most of NSW coal-fired power would be retired.
Humanity needs to stop emitting GHGs into the atmosphere as soon as possible (greater than 50% reduction by 2030, and net-zero before 2040) or human civilisation will collapse later this century.
See “Climate Reality Check 2020”: https://www.climaterealitycheck.net/
See also: https://www.nature.com/news/three-years-to-safeguard-our-climate-1.22201
Wayne,
Further to your statement: “Turbines … only run at around 40 percent capacity”
The RenewEconomy article by Giles Parkinson headlined “Why W.A. is emerging as the new hot spot for wind energy in Australia”, dated Jun 11, includes at figure showing 2019 wind asset performances for selected wind assets, with capacity factors ranging between about 38 to 50%:
https://reneweconomy.com.au/wp-content/uploads/2020/06/2019windPerformanceNEMWEM.jpg
Meanwhile capacity factors for the global fleet of coal-fired generators continues to decline. Think tank Ember tweeted late yesterday:
“This year, for the first time, the world’s #coal plants ran at less than half their capacity.”
https://twitter.com/EmberClimate/status/1341351544822886400
Your capacity factor justifications are a bit “fake” Geoffrey…
You should know – there is a huge difference between a technology not being ABLE to achieve high capacity factors (e.g. due to a lack of wind or sun), and a technology that has it’s output deferred in favour of renewable generation when it is available – as is reasonable and common. Misusing this data discredits your integrity.
E.g. Using Diesel Generators only on standby, for when things go pear-shaped on grid renewable supply and a short-term “boost” is needed – not at all surprising to see only a 2% capacity factor. I have seen this “Liquid Fuel” use show up on the Supply & Demand widget on occasions.
I have seen reports of USA nuclear, where a station achieved 101% capacity factor, over a 1 month duration, then dropped to about 98%. Commonly plant averages exceed 90% – see https://www.statista.com/statistics/191201/capacity-factor-of-nuclear-power-plants-in-the-us-since-1975/
SA often ramps up it’s NG generation often at night, and on overcast days, when solar is non-existent, and wind is low – but then throttles NG-use back when the sun rises – this is a very commonly observed characteristic on the Supply & Demand widget.
I agree that Legacy Nuclear is slow-reacting and therefore better for base-load – but some new reactors designs do have load-following capabilities that you appear to neglect.
Ian Thompson,
You state: “Your capacity factor justifications are a bit “fake” Geoffrey…”
Fake? Are you disputing the EIA data, Ian? Where’s your evidence/data, Ian?
Fossil fuelled generators (both new additions and now longer-term legacy units) are simply being economically outcompeted by cheaper unsubsidised renewables (including storage). When significantly cheaper wind and/or solar (and increasing installed capacities) are available they displace the more expensive legacy fossil fuel generators. Would you prefer to pay much more for your electricity for the sake of your “ideological integrity”, Ian? Still disputing the Lazard and CSIRO/AEMO GenCost LCOE data, Ian? It seems to me your ideology is still blinding you to the overwhelming data.
You state: “I have seen reports of USA nuclear, where a station achieved 101% capacity factor, over a 1 month duration, then dropped to about 98%. Commonly plant averages exceed 90%…”
…and none of this would have happened without substantial and ongoing taxpayer-funded subsidies to prop-up nuclear technologies ever since inception. Ian, it seems to me that fact is apparently inconvenient for your pro-nuclear narrative.
The Union of Concerned Scientists in their 2011 report titled “NUCLEAR POWER: Still Not Viable without Subsidies” included:
“Conspicuously absent from industry press releases and briefing memos touting nuclear power’s potential as a solution to global warming is any mention of the industry’s long and expensive history of taxpayer subsidies and excessive charges to utility ratepayers. These subsidies not only enabled the nation’s existing reactors to be built in the first place, but have also supported their operation for decades.
The industry and its allies are now pressuring all levels of government for large new subsidies to support the construction and operation of a new generation of reactors and fuel-cycle facilities. The substantial political support the industry has attracted thus far rests largely on an uncritical acceptance of the industry’s economic claims and an incomplete understanding of the subsidies that made—and continue to make—the existing nuclear fleet possible.
Such blind acceptance is an unwarranted, expensive leap of faith that could set back more cost-effective efforts to combat climate change. A fair comparison of the available options for reducing heat-trapping carbon emissions while generating electricity requires consideration not only of the private costs of building plants and their associated infrastructure but also of the public subsidies given to the industry. Moreover, nuclear power brings with it important economic, waste disposal, safety, and security risks unique among low-carbon energy sources. Shifting these risks and their associated costs onto the public is the major goal of the new subsidies sought by the industry (just as it was in the past), and by not incorporating these costs into its estimates, the industry presents a skewed economic picture of nuclear power’s value compared with other low-carbon power sources.”
See: https://www.ucsusa.org/sites/default/files/2019-09/nuclear_subsidies_summary.pdf
You finish with: “I agree that Legacy Nuclear is slow-reacting and therefore better for base-load – but some new reactors designs do have load-following capabilities that you appear to neglect.”
Where are the physical manifestations of these so-called “new reactor designs” that undeniably demonstrate all the wishful claims being made, Ian? They simply don’t exist. Ian, it seems to me you are a die-hard nuclear fantasist.
The apparently nearest new design ‘want-to-be’: NuScale’s first project, the 12-reactor Carbon Free Power Project (CFPP) in Idaho Falls, Idaho, has had its completion date pushed back from 2026 to 2030, and expected costs to double from $3 billion to $6.1 billion.
See: https://www.greentechmedia.com/articles/read/nuscale-faces-questions-over-nuclear-reactor-safety-path-to-financing-first-project
Nuclear fission is commercially uninsurable, reliant on depleting finite fuels, too costly, too slow to deploy, and TOO BLOODY LATE for mitigating catastrophic climate change. When are you going to wake-up to the undeniable reality and stop flogging the proverbial dead horse, Ian?
See: https://johnquiggin.com/2015/05/05/flogging-the-dead-horse-of-nuclear-power/
To back up what I posted on the 15th, the SA Premier has added his weight behind the idea https://thedriven.io/2020/12/20/biggest-change-in-model-t-south-australia-wants-all-new-car-sales-to-be-electric-by-2035/
From the article
“The ministers say that EVs, and the emergence of EV-based “virtual power plants” – using the car batteries as a key grid resource – will be an important part of grid management, and help deliver big cost savings into the future.”
So they are already looking at integrating the two way ability of modern EV’s into the grid storage ….. sounds like the death knoll for “baseline power plants”‘ because the need will no longer exist.
Knocks the whole gas lead energy transition in the head as well, if we can store all the renewables we can generate in the near future, I guess solar and wind will ramp up even further squeezing out fossil fuels and eliminating even the thought of nuclear power for the foreseeable future
T1 Terry
Geoff you still havent hooked onto what Ian Thompson along with many other scientists and commentators globally are expressing: that being; Power Generation Science and Technology is an emerging science at a relatively early to mid phase of its development globally.
There is a long way to go before maturity can be accorded to this area of science.
You seem totally transfixed and bogged down in the technological here and now as if the end game has been reached.
Of course this is not the case, and it follows therefore that It must be you rather than Ian Thompson, that will be proven to be the one on the wrong side of the scientific power technologies argument ‘looking forward’.
And I should emphasise the term ‘looking forward’ here Geoff rather than your train of thought that is consistently ‘backwards’ or at best ‘stationary’ about this important topic.
This does not indicate that I support Ian Thompsons veiws. I dont: but at least he brings a measure of objectivity and rigour to his thinking which you lack.
Lawrence Coomber
Lawrence Coomber,
You state: “Geoff you still havent hooked onto what Ian Thompson along with many other scientists and commentators globally are expressing: that being; Power Generation Science and Technology is an emerging science at a relatively early to mid phase of its development globally.”
Who are these “many other scientists and commentators”, Lawrence? Perhaps you could name some of them, so we can all know who they are.
Lawrence, please stop trying to hide what I think you really mean: “Power Generation Science and Technology” is just your euphemism for nuclear fission technologies. Here’s an example of what you stated earlier this year in another thread:
“The world’s best and brightest physicists, scientist’s, researchers and engineers are well aware of the numbers and the inexorable scientific pathway forward. NANS technology (new age nuclear solutions) being at the apex of power generation science, is the only practical form of power generation technology that has the exploitable attributes that can satisfy the global energy imperative going forward in perpetuity.”
See: https://www.solarquotes.com.au/blog/planet-of-humans-review/#comment-691207
You also state in your latest comment: “There is a long way to go before maturity can be accorded to this area of science.”
…and yet the GHG emissions reduction timeline indicates rapid reductions must begin NOW, not from 2025, or later, or on the never-never! See the Carbon Crunch graph: https://www.nature.com/news/three-years-to-safeguard-our-climate-1.22201
You then state: “You seem totally transfixed and bogged down in the technological here and now as if the end game has been reached.”
The “endgame” pathway could soon be set if humanity cannot begin to drastically reduce GHG emissions within the next FIVE years. Your earlier (May 1) referred comment suggests a “new frontier age of power generation science this next 50 years”. Low/zero GHG emissions generator technologies need to be available and deployed at large-scale RIGHT NOW and operational within years – NOT decades away or ‘promises’ of new designs “just around the corner” that cannot deliver within this decade.
Earth System scientist Professor Will Steffen concludes in his Submission (#455) to the Australian Parliament House of Reps Standing Committee on Environment and Energy inquiry into the Climate Change Bill 2020:
“I could go on with many more points and arguments, but I’ll conclude by emphasising the importance of this bill. We are entering the ‘climate endgame’, with potential disastrous consequences if greenhouse gas emissions continue on their present trajectory for just one more decade. Australia, with our domestic emissions and fossil fuel exports, is a major player globally. Now is the time to step up and start taking responsible action on climate change.”
https://www.aph.gov.au/Parliamentary_Business/Committees/House/Environment_and_Energy/ClimateBills2020/Submissions
You state: “And I should emphasise the term ‘looking forward’ here Geoff rather than your train of thought that is consistently ‘backwards’ or at best ‘stationary’ about this important topic.”
Lawrence, please present credible evidence/data – not tiresome waffle and yearning fantasy.
Geoffrey
You continue to misrepresent.
Clearly, you do not undetstand that there is a difference between Capacity Factor, and Utilisation.
Obviously – in the interest of reducing pollution, renewables are being favoured over coal – as should be the case. So, coal’s “utilisation” is being curtailed when renewables are available, and grid capability is adequate to allow them to be utilised, and enough alternate dispatchable power is available to deal with unexpected variability. This is a good thing.
C.f. SA, where I have NEVER seen NG generation anything less than 250 MW – even when there appears to be plenty of wind and solar capacity available. Energy is actually often being exported. In this case, I’d guess renewables are being curtailed, in favour of preventing another “State Black”. The capacity factor is unchanged, but utilisation is reduced.
These things are done in the interests of system security, sometimes largely irrespective of cost and emissions factors.
You have misused a graph titled “Utilisation”, and tried to make a fallacious argument about capacity from this.
Ian Thompson,
You state: “You continue to misrepresent.
Clearly, you do not undetstand that there is a difference between Capacity Factor, and Utilisation.”
It seems to me you haven’t looked at the primary source of information I referenced. The table I referenced from the EIA is titled “Table 6.07.A. Capacity Factors for Utility Scale Generators Primarily Using Fossil Fuels”.
https://www.eia.gov/electricity/monthly/epm_table_grapher.php?t=epmt_6_07_a
The definition for “capacity factor” (per Wikipedia):
“The net capacity factor is the unitless ratio of an actual electrical energy output over a given period of time to the maximum possible electrical energy output over that period.”
I interpret that to mean capacity factor is related to utilisation.
It seems to me you have a different idea of the definition of “capacity factor”, inconsistent with EIA and Wikipedia terminology, and it seems you are equating it to “availability factor”.
Details and evidence/data isn’t your forte, eh Ian?
IMO, you are the one attempting to distract by making a fallacious and spurious argument.
Well, yes Geoffrey – I admit I was using the term “Capacity Factor” in the sense of a given techology’s utilisation CAPABILITY, measured compared to a continuous 100% nameplate rating output.
Perhaps incorrectly… But most certainly with no intention to deceive.
Geoffrey, trivial semantics aside, I was responding to your most obvious intention to mislead when you responded to Wayne – he was definitely making statements about wind and solar’s capacity (utilisation) limitations – unrelated to coal’s delberate curtailment (a good thing), which is an entirely different issue.
If I referred to Utilisation, you would likely say solar is 100% ultilised (because ALL of the output it is capable of generating, is often utilised (e.g. by curtailing NG, and exporting excess in SA)! Whereas it seems to me rooftop PV output ENERGY over each year is more typically around 20% (if you are lucky), and NEM wind is close to 25%, possibly less, of nameplate rating.