
On Christmas Eve, on Twitter, DaveMySpace asked this question:
Finn promised DaveMySpace an answer. After two weeks of research, this post is my best answer.
As DaveMySpace has realised, solar panels require resources. Silicon and metals need to be mined and refined. Energy must be expended. Some people get very worked up over these facts. They invariably express horror, shock, and disbelief at how many resources and how much mining is required to make renewables, but they never seem to say anything along the lines of…
“It would be wonderful to further reduce the resources required to manufacture renewables, but thank god it’s only a small fraction of what’s required for coal and natural gas.”
I can understand people getting upset about solar panels, batteries and wind turbines consuming resources. I’m personally furious we haven’t yet mastered the magic spells to pull solar cells from a hat. But if the whingers truly care about the amount of mining and resources required to generate energy, they should be jumping for joy wind and solar power require far less per kilowatt-hour generated than fossil fuels.
I see two reasons people worry about how many resources renewables consume instead of celebrating how much they save compared to coal and gas:
- Ignorance: They simply don’t know solar and wind energy generation uses far fewer resources than fossil fuel generation.
- Human Nature: Some people just want to whinge. Whether or not there’s a real reason rarely matters.
I’m writing this article to help solve the first problem, but it’s not going to do much about human nature. Hopefully, it will encourage whingers to whine about something unimportant, such as their favourite Pokemon not getting enough respect or how people laugh at them when they insist yellow is a flavour1.
The Main Reason For Confusion
Building a solar or wind farm or installing solar panels on roofs requires a lot of material resources invested upfront. More than for a coal or natural gas power station per kilowatt-hour it will generate over it’s lifetime.
For solar and wind, that’s about it2.
But for fossil fuel generation, getting the power station built is only the beginning.
For coal power, less than 1% of emissions come from initial construction, with over 99% resulting from its operation. The situation for tonnes of materials mined is roughly similar. Gas generation isn’t as bad as coal but is still awful.
A common whinger mistake/tactic is to compare resources required to build a solar farm with fossil fuel generation and then act as though that’s some disaster, while ignoring that 99% of emissions and mining for coal come after the power station is complete.
This isn’t the kind of mistake anyone who knows how combustion works makes. While anyone can make a stupid error, the slap of their palm against their forehead should ring out like a gunshot once they realize what they’ve done.

“KA-POW!” Don’t die of embarrassment like Jean-Luc Picard. Include resources consumed by fossil fuel power stations when they’re in operation.
This kind of “error” can really only be made by people trying to mislead or deceive people or who are — regrettably — nuttier than a squirrel’s lunch.
This type of nonsense can then be spread by people who don’t bother to think it through or who don’t care if it’s true. So always be sure to practice proper truth hygiene on the internet3.
Emissions, Material, Mining, & Recycling
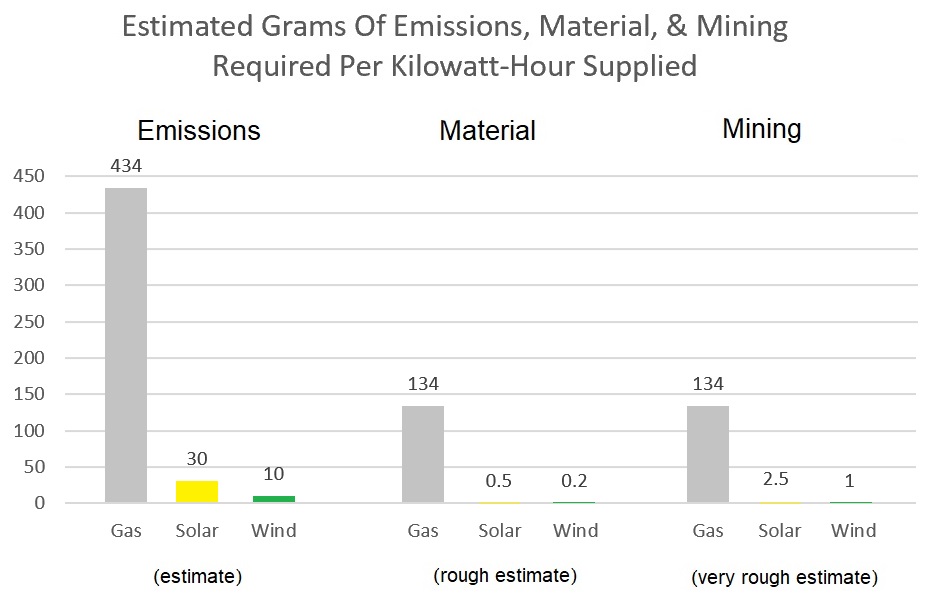
I’ll give figures for emissions per kilowatt-hour generated for coal, gas, solar, and wind. Then I’ll give a rough estimate of the amount of materials they need and then an even rougher estimate of the amount of mining required.
After I’ve done that, I’ll point out how we can recycle far more of the material use by wind and solar power generation than fossil fuels. I’ll also consider how emissions, material, and mining apply to battery storage and show it’s far superior to gas generation.
Coal Power Emissions
Australian coal power stations emit around 1 kilogram of CO2 per kilowatt-hour generated. Total emissions are higher than this because diesel is burned mining coal and after it’s dug up coal releases methane into the atmosphere, which is a powerful greenhouse gas. One figure I have from Europe, where coal mining is heavily electrified, says extraction results in the equivalent of 120 grams of CO2 emissions. While I suspect it’s higher in Australia, I’m going to be kind to coal — despite the fact it’s not always kind to us — and use a nice round figure of 1.1 kg of CO2 per kilowatt-hour.
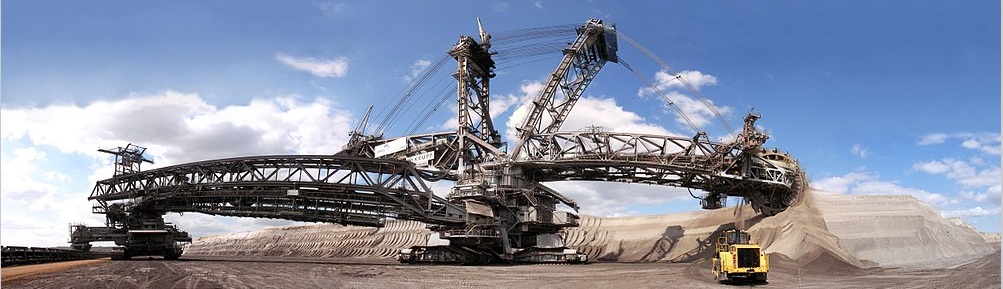
The Bagger 288 is used for coal excavation in Germany and is the world’s 2nd largest electric vehicle. It has a slightly larger brother, the Bagger 293. My sincerest wish is for all coal mining to end soon, so we can make them fight. (Image: Wikipedia.)
Natural Gas Emissions
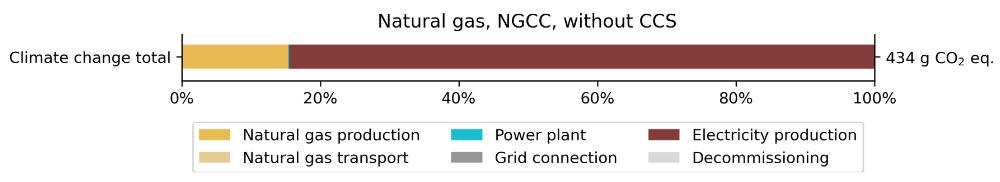
It’s straightforward to determine direct emissions from a natural gas power station. If it’s 50% efficient, it will release 356 grams of CO2 per kilowatt-hour. But the lifecycle emissions are higher due to emissions and leakage from extracting, refining, and transporting natural gas. There are also emissions from building the power station and gas infrastructure. According to this European report titled Life Cycle Assessment Of Electricity Generation Options the lifecycle emissions are:
- 50% efficient natural gas generation: 434 grams of CO2 lifecycle emissions per kilowatt-hour
They estimate around 16% of emissions occur from natural gas production with a 50% efficient gas power station. Usually, only Natural Gas Combined Cycle power stations — or NGCC for short — are this efficient:
Australian lifecycle emissions for a 50% efficient gas power station should be very similar, but the large majority of our gas generators have lower efficiency. Lifecycle emissions from an open cycle gas turbine with 30% efficiency would be around 720 grams per kilowatt-hour.
Solar Power Emissions
When I looked online for the lifecycle emissions for solar power, I saw plenty of outdated material that misses considerable improvements in solar efficiency and reliability over the past few years. But I did find this report — Life Cycle Assessment Of Electricity Generation Options — with information from 2020. Unfortunately, it’s focused on Europe and, as almost anyone could tell you, Europeans are far less well endowed than Australians… when it comes to wind and solar energy resources.
The report gives the following lifecycle CO2 emissions in grams per kilowatt-hour generated for Europe:
- Ground-mounted polysilicon solar: 36.7 grams per kilowatt-hour
- Rooftop polysilicon solar: 37.2 grams per kilowatt-hour
These figures are for polysilicon, which requires less energy to produce than the monosilicon panels that mostly go on Australian roofs. While monosilicon requires more energy to make, its is more efficient and this reduces the amount of other materials required. For this reason, the figure for both types of solar panels should be similar.
The report gives emissions for rooftop solar power that are slightly worse than for solar farms. While rooftop solar doesn’t require ground mounts, foundations or ballast, its efficiency in Europe is considerably less. In Australia, thanks to higher rooftop efficiencies and larger systems, I’d expect rooftop solar to produce less emissions per kilowatt-hour than solar farms. But this may be countered by Australian homes not lasting as long as they do in Europe, which may shorten the average system lifespan here.
I’ve copied their graphics showing the sources of emissions for both types of solar:
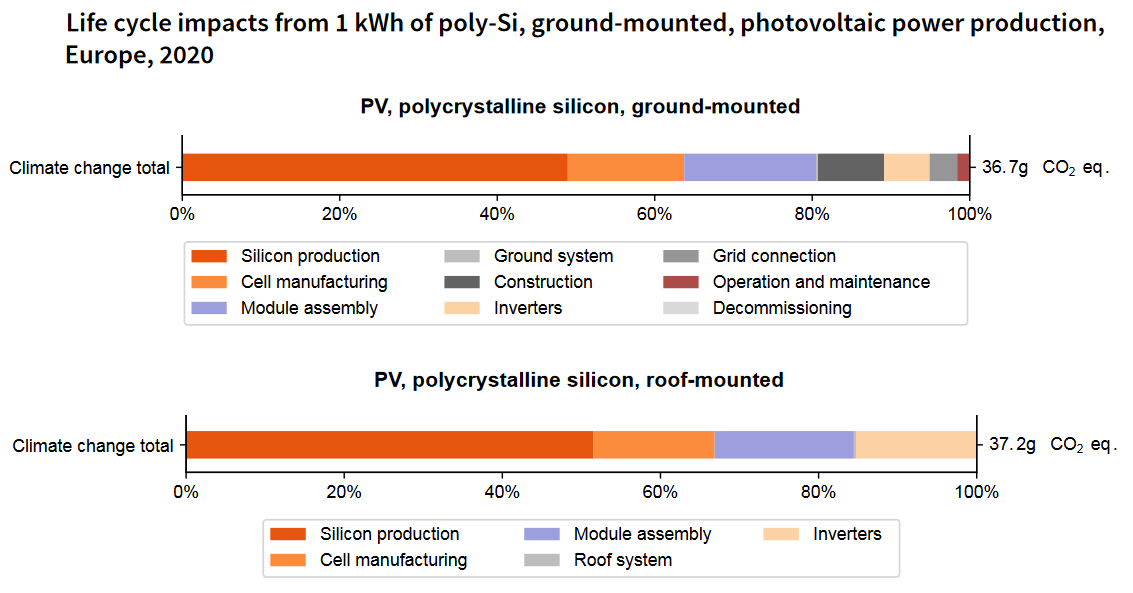
To see the information presented by the full graphics, check out figures 22 and 23 on page 36 of Life Cycle Assessment Of Electricity Generation Options by the United Nations Economic Commission for Europe.
Australia’s solar output is a lot better than Europe’s. This is true for solar farms and especially for rooftop solar power systems. This is likely to result in lifecycle emissions here being around one-third less per kilowatt-hour. This would make emissions around 25 grams but, to be on the safe side, I’ll assume Australian lifecycle emissions from rooftop and utility-scale solar are around 30 grams of CO2 per kilowatt-hour generated.
Wind Energy Emissions
Like solar, wind generation has very low lifecycle emissions per kilowatt-hour. For Europe, the report pegs them at only 12.4 grams per kilowatt-hour:
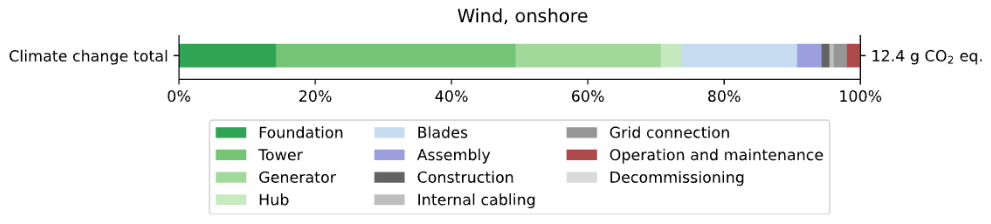
Australia’s wind resources are far superior to Europe’s, so lifecycle emissions here are likely to be at least one-third less, making them around 8 grams per kilowatt-hour. But again, to be on the safe side, I’ll use a round figure of 10 grams per kilowatt-hour.
Emissions Comparison
If we put the estimates of lifecycle emissions into a graph, it looks like this:
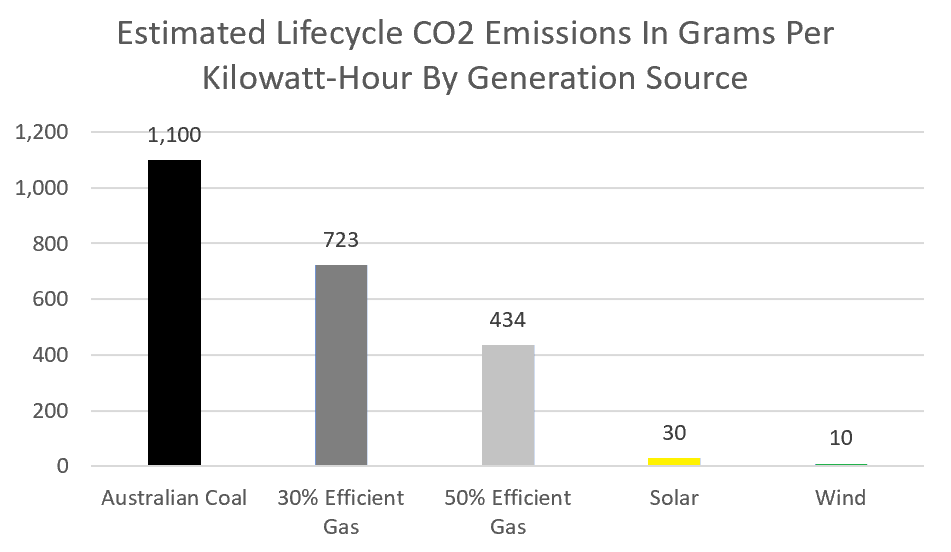
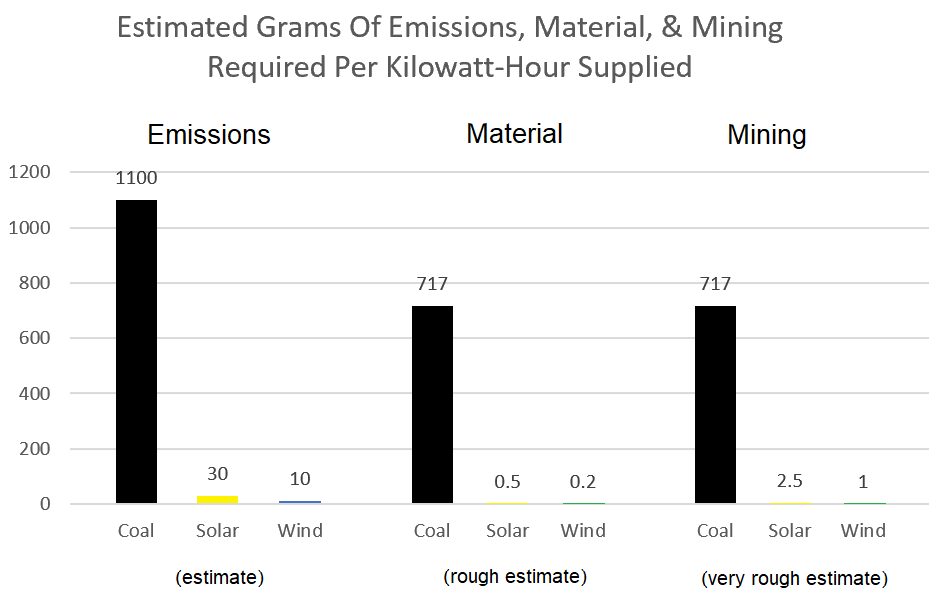
This makes the lifecycle emissions from coal generation 37 times higher than solar energy and 110 times higher than wind generation.
While not as bad as coal, even high-efficiency gas generation has lifecycle emissions over 14 times solar and 43 times wind.
Obviously, to cut greenhouse gas emissions, we should build solar and wind capacity in favour of coal and gas. Because wind’s lifecycle emissions are lower than solar’s, it may appear much better for cutting emissions. But compared to using fossil fuels, the total benefit of solar power and wind is around the same. In practice, building both solar and wind capacity is best, as their periods of high output often differ. In Australia, we’ll end up with a lot more solar than wind because we have a lot of sunshine and its cost is falling faster than for wind generation.
Material Required
Working out how much material is required to generate one kilowatt-hour of electricity from different sources is difficult. But it is easy to show fossil fuel generation requires far more material than solar or wind power.
Material Required For Solar & Wind
The weight of a 10 kilowatt solar system — including solar panels, inverter, racking, conduits, and cabling — comes to around 65 kg per kilowatt. Assuming, like most solar systems, the panels aren’t optimally positioned and they suffer the minor amount of deterioration in output expected from good quality panels, it will produce around 320,000 kilowatt-hours over 25 years on a typical Australian roof. That comes to 0.2 grams of material per kilowatt-hour. Assuming it needs an inverter replacement in that time, that only adds around an extra 0.01 grams.
This ignores the material in the equipment required to extract raw materials, manufacture solar hardware, ship it to Australia and install it on roofs. This isn’t insignificant, in industry the amount of material in capital goods is generally low compared to the material output produced. But I’ll be cautious and assume with the equipment used to manufacture it, solar — whether rooftop or ground-mounted — requires around 0.5 grams of material per kilowatt-hour generated.
Wind power should come in well under this, and I’ll assume 0.2 grams per kilowatt-hour. For Australia this is probably much too high.
Materials Required For Coal
It takes a lot of materials to build a coal power station. Concrete has to be poured for foundations, massive amounts of steel are required, chromium must be mined to produce high-temperature stainless steel, and so on. Building and operating coal mines require even more resources.
But I’m going to ignore all that.
Because emissions from building coal power stations are such a small part of the total for coal generation, I will only consider materials required after it’s complete.
The average efficiency of Australian coal power stations is roughly 33%. This means they convert around one-third of the 23.8 megajoules of thermal energy per kilogram in the black coal Australia exports into electrical energy. As there are 3.6 megajoules in one kilowatt-hour, this means 450 grams of black coal need to be burned to generate 1 kilowatt-hour.
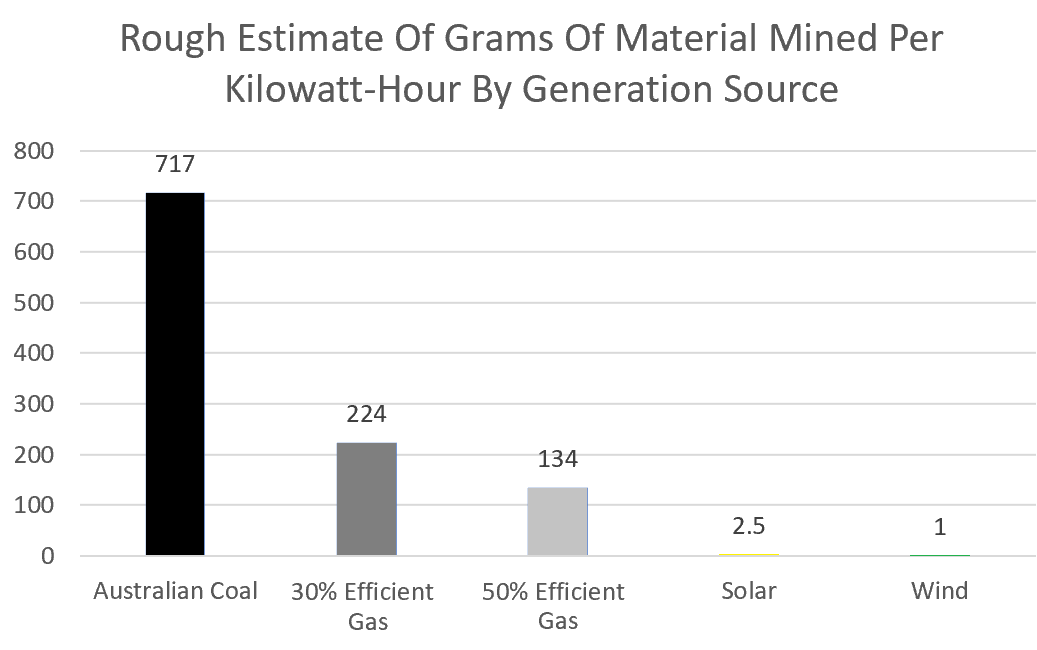
But it’s worse than this. Not all the black coal Australia burns has that high an energy content, while 35% of Australia’s coal generation is from Victorian brown coal and this only provides about 8.9 megajoules of thermal energy per kilogram. This means, on average, around 717 grams of coal need to be burned to generate one kilowatt-hour of electricity in Australia.
This is over 1,400 times the material required per kilowatt-hour by solar power and over 3,500 times what’s required by wind.
The actual amount will be greater than this due to diesel and other materials consumed by coal mining, but the figure for coal alone is more than large enough to make my point.
Materials Required For Gas
I’m going to do gas generation the same favour I did coal and ignore emissions resulting from the construction of infrastructure for gas extraction, refining, transportation, and generation. I’ll only consider fuel used to generate electricity.
When one kilogram of natural gas is burned, it releases 53.6 megajoules of thermal energy. In a 50% efficient gas power station, each kilowatt-hour of electricity generated will require 134 grams of natural gas. With a 30% efficient gas generator, it would require 224 grams.
While better than coal, even a 50% efficient gas power station requires over 160 times as much material as solar and 670 times as much as wind.
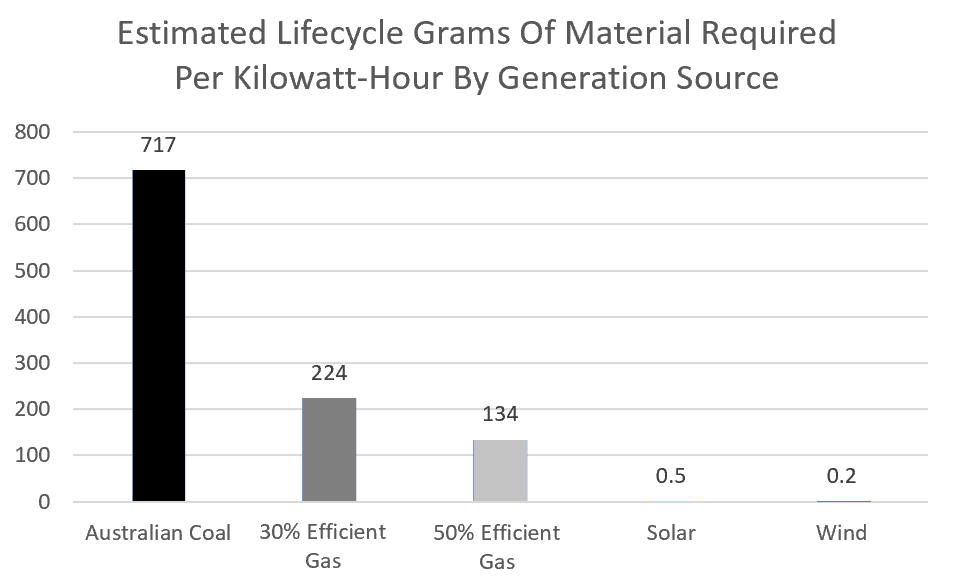
Material Comparison
When the material requirements per kilowatt-hour generated from the different sources are put into a graph, it makes it clear how far wind and solar power are ahead of fossil fuels:
Mining Requirements
It’s not possible to accurately measure the amount of mining different types of generation require — or if it is possible, it’s beyond me. But rough estimates can be made.
Part of the problem is what to count as “mining”. In Australia, every kg of coal mined requires the removal of around 15 kg of spoil. This is dirt or rock that must be moved to get to the coal. If it’s included, it results in a huge increase in mining required. Then there are mines and power stations, such as Kogan Creek, that use bore water. Some people will want to include it in the mining total since it comes from the ground. But rather than make things complex, I’ll take a straightforward approach and only consider materials that are either refined after extraction or used as fuel.
When coal is burned to generate electricity in Australia, it doesn’t undergo further refining after it’s dug up. But materials used to make solar and wind generating capacity are more complex and may require considerably more mining in total per gram of finished material. If we assume it requires five times as much mining as coal then — while still ignoring materials required to construct fossil fuel power stations — coal requires over 280 times as much mining per kilowatt-hour generated as solar and over 700 times as much for wind generation.
For 50% efficient gas generation, it would come to over 50 times as much for solar and 130 times as much for wind. For 30% efficient gas generation, it would be over 80 and over 210 times respectively.
So even in a situation where I’ve ignored mining required to build fossil fuel extraction and generation infrastructure, gas will require at least 50 times as much mining as solar electricity per kilowatt-hour generated and Australian coal generation requires over 280 times as much.
Recycling
None of the figures I’ve given above considers how recycling can reduce emissions, mining, and processing of resources. Solar and wind are both way ahead of fossil fuels regarding the amount of material that can be recycled.
Most of a wind turbine can currently be profitably recycled, apart from its blades, which are fibreglass or carbon fibre, and its concrete foundations. By profitably recycled, I mean people would currently recycle it because it pays for itself.
Much of a solar system can also be profitably recycled. This includes racking, wiring, steel ground mounts, and solar panel’s aluminium frames. At the moment, solar panels themselves, after they’ve been stripped of their frames aren’t profitable to recycle. Hopefully, this will soon change as processes improve.
But even if only one-quarter of the material in a solar power system can be profitably recycled, this still puts it well ahead of fossil fuels, where under 1% of the material they require can be recycled. While metals in a scrapped fossil fuel power station can be recycled and a tiny portion of coal ash is used by the cement industry, almost all the material used to generate fossil fuel electricity goes up in smoke. To be more precise, it goes up as CO2. It is not currently profitable to remove CO2 from the atmosphere and turn it back into coal or natural gas. If it was profitable we wouldn’t have coal or natural gas extraction industries.
Toxicity
Generating one kilowatt-hour from coal in Australia requires burning over 700 grams of fossil fuel and this releases a range of toxins, including heavy metals, into the atmosphere. This is far more damaging to health than solar and wind power, which require under half a gram of material per kilowatt-hour generated. The suggestion renewables could result in the release of toxins on scale anywhere approaching fossil fuels is — quite frankly — nuts.
While it’s not as up-to-date as I’d like, this graph from Our World In Data makes my point by showing deaths per terawatt-hour from different sources of generation:
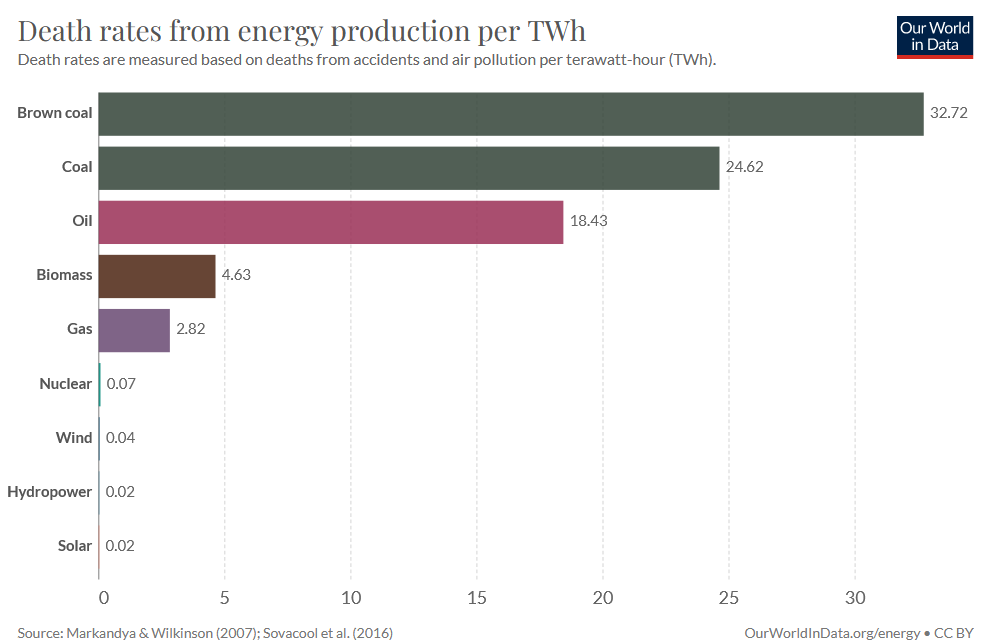
A terawatt-hour is one billion kilowatt-hours. The death rate for Australia’s mix of coal comes to over 1,000 times that of solar. The graph includes death from accidents as well as pollution, so for solar power it will mostly be stuff like falling off roofs rather than toxins. The result for coal is almost completely toxic, but some of it will be mining accidents and people dying in fires, so there is that.
Emissions & Materials For Batteries
Some insist solar and wind power require battery storage, and so emissions from it, as well as material it requires, should be added to their totals. While it’s not technically necessary to use battery storage with solar and wind generation, we will end up using a lot of it because it’s so damn useful.
I’ve already shown the drawbacks of fossil fuels compared to solar power:
- Lifecycle greenhouse gas emissions per kilowatt-hour for fossil fuels are 14 to 36 times greater than solar.
- Materials required per kilowatt-hour are 160 to 1400 times greater than solar.
- Mining required per kilowatt-hour is 80 to 280 times greater than solar.
So all I need to do to show the combination of solar + wind + batteries is clearly superior to fossil fuels is show batteries result in less emissions and consume less resources than gas generation.
Battery Emissions
One estimate puts lifecycle emissions from manufacturing an electric vehicle battery pack at 75 kg of CO2 per kilowatt-hour. While I suspect this figure is already outdated, I’ll use it anyway. When part of utility-scale energy storage, a battery is likely to be used for the equivalent of over 3,000 full cycles. If one kilowatt-hour of battery capacity supplies a total of 3,000 kilowatt-hours of stored energy in its lifetime, that comes to 25 grams of CO2 per kilowatt-hour supplied. A 50% efficient natural gas generator produces 17 times more emissions just from burning the gas.
Battery Materials
A Tesla battery pack weighs 6.25 kilograms per kilowatt-hour. I’ll assume stationary battery storage is over three times that at 20 kg per kilowatt-hour. When fully cycled 3,000 times, that comes to 6.7 grams of material per kilowatt-hour supplied. Natural gas generation at 50% efficiency requires at least 20 times as much material.
Battery Mining
I’m not sure how much material must be mined to create one kilowatt-hour of battery storage, but I’ll lean on the safe side and say it’s ten times as much as my material estimate and use 200 kg per kilowatt-hour. This comes to 67 grams per kilowatt-hour of stored energy supplied. Natural gas at 50% efficiency comes in at over twice as much.
Battery Recycling
By weight, most of what’s in a lithium battery can be profitably recycled right now. There’s a reason why manufacturers are so dedicated to recycling and getting battery packs back at the end of their lives. They’re worth money.
Batteries Better Than Gas
if I take the estimates for batteries above and compare them to gas in a graph, I get this:
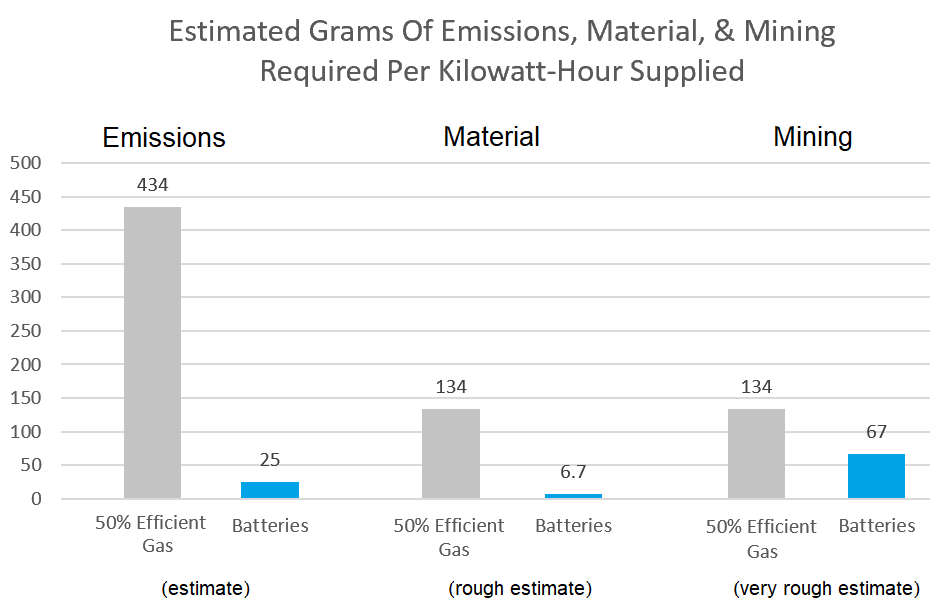
While these are only estimates, I think it’s clear using batteries to store renewable energy will result in far fewer emissions, less material use, and mining than even efficient natural gas generation.
Solar & Wind Use Far Less Resources Than Coal & Gas
While some of my estimates are rough, it’s still obvious when it comes to emissions, materials and mining, wind and solar power are far superior to Australian coal generation:
While gas burned at 50% efficiency isn’t as bad as coal, it’s still horrible compared to solar and wind:
The results are so extreme I hope that even DaveMySpace can see it makes no sense to complain about the materials or mining required for solar and wind energy generation. Fossil fuels are far, far worse.
Post-publication update from DaveMySpace:
Thanks fort that article.
A bit of abuse in there but all forgiven!
I wonder if you could look at some real figures released by the International Energy Agency?
You may want to revise your calculations!https://t.co/rdRdtVPkGX
And another itemhttps://t.co/zhp4AEUmjl— DaveMySpace (@DaveMySpace1) January 10, 2022
Footnotes
- If orange can be a flavour, why not yellow? ↩
- Additional emissions from repairs and replacements should be minimal, provided good quality components were used and properly installed. Any future work done on the system for repairs and replacements will result in fewer emissions than now as the world cuts emissions. ↩
- Always wear common sense and never go near a factoid with a tattoo of a dagger on any part of its body. ↩
 RSS - Posts


I think DaveMySpace is a regular reader of Jo Nova and logic and facts will be anathema to him
Keeping this for later reference
One aspect of coal mining that you don’t mention is overburden and waste.
Underground coal mines typically produce waste weighing about 50% of the coal produced, open-cut mines often 2x.
Both release methane only some of which is measured or captured.
Open cut spoil dumps often spontaneously ignite, producing all sorts of nasties, which are not measured.
And then there is damage to the local environment and farmland, only some of which is repaired by rehabilitation.
And damage to water tables and water resources
And lung damage due to coal dust.
And
And
Renewables fit nicely into any energy mix, but base load power cannot easily ramped up or down based on input from renewables unless it is hydro.
Problem is aluminium is “frozen electricity” and cannot be driven from batteries and we are a major producer of aluminium, probably because we also subsidize the energy costs for Alcoa.
China produces most of the CO2 and if we mention that, the Chinese are very quick to point out that their per capita output of CO2 is less than ours; guess why? They have nuclear in their mix!
Now I have said it.
P.S.: Does the follow-up work?
China generated under 5% of its electricity from nuclear in 2020 while Australia’s emissions per capita were 240% higher. So, while their nuclear generation does help, it’s clearly not the reason why their per capita emissions are lower than ours.
I think it might be the Billion ‘capitas’ they have
Picked that information about China claiming their CO2 output/capita is lower than ours from a paper.
With coal shutting down and more and more EVs requiring juice after work when the sun goes down, I pray the base load capacity will be there. Parking lots must have PV on sun roofs and become charging stations as seen in the film “Who killed the electric car?”.
One chap with a fast charger was fined by his supplier as his charger was consuming as much as two houses and that was beyond what the contract allowed!
Also they have a ridiculously high “per capita”
It’s funny that people that have never had any issues with landfills for their entire life suddenly become anti landfill crusaders just because its solar panels.
Happy to put their red bin out each week with no tantrum.
Wait until they hear about the 12 million tons of coal ash dumped every year
https://www.abc.net.au/news/2019-03-10/coal-ash-has-become-one-of-australias-biggest-waste-problems/10886866
I believe coal ash in Germany gets recycled, but have forgotten what for, it might be a substitution for the sand in concrete.
A tiny portion of coal ash is used in cement to make it cure faster. In construction the more rapidly concrete strengthens the better, but this is not a good thing environmentally because it reduces the amount of CO2 the cement draws from the air as it cures.
I always enjoy the posts from Solar Quotes for their informative and humorous content, but on behalf of DaveMySpace – who doubtless can stand up for himself – I do object to the gratuitous and repeated insults levelled at him for being a “whinger”. This is unbecoming of you.
They are entirely unjustified in response to a sensible question, and I can only assume that it was done out of resentment that you had to put in 2 weeks’ work to answer it.
Far be it from me to level any insults of my own, despite the number of “heroic assumptions” included in your answer and your apparent inability to proofread, which casts serious doubt on your calculations and statements. Note that the “4 rules” for posting are actually FIVE, but who’s counting?
I am happy to go through any figures in the article with you so you can be certain they are at least reasonably correct. As for my own disagreeable nature, I freely admit to being a horrible old grump. The only excuse I have for my abhorrent behaviour is I did mean whingers in general and not DaveMySpace in particular.
No, Dave is a nutter who has probably asked this idiotic question hundreds of times and had it answered
Just one Tweet
“What?
Plant Based Food?
Plants are food and they’re called fruit, veggies, herbs etc.
Go back to Play School
Better still
Defund the ABC!”
This post was for the benefit of others with the ability for rational thought
I read it as whiners in general. Your common garden variety general all- purpose uninformed whingers. Not addressed to anyone specific.
Energy cannot be generated. It can only be converted from one form to another. Be professional. Stop mixing concepts up when you are trying to explain or persuade.
Doug,
You are misquoting the law of conservation of energy and seem to misunderstand the definition of the word “generate”.
Conservation of Energy:
“energy can neither be created nor destroyed; rather, it can only be transformed or transferred from one form to another.”
Definition of “generate” (Cambridge English Dictionary)”
“to produce energy in a particular form”.
You appear to be the one mixing up your concepts.
Here in Queensland we are having long periods of overcast weather which requires me switching from solar to grid power from time to time. How does this translate to solar farms and big batteries for baseboard?
That would be why Ronald also talks about wind energy.
Hi Richard.
At the moment baseload demand in Queensland usually occurs at around 3:30 am, but sometimes occurs during the day. As rooftop solar expands it will regularly occur during the day thanks to it reducing demand for grid electricity. As coal power station close, the generation profile for Queensland will change to look more like it currently does in WA, but with battery storage playing the role of gas because it now beats it on price. Eventually there will be no coal generation, as in South Australia and Tasmania. At the moment large utility scale batteries are being built, but in the future I expect we’ll see a lot of storage on wheels in EVs as well as distributed battery storage in homes and businesses.
Use of car (EV) batteries for the home at night is certainly a good idea and old batteries from cars are already being used for that purpose as they are good enough for the house, but not for the car any more. I suspect the eight year/160,000km warranty for the battery will then no longer apply as such a battery will be cycled too much.
Such a scheme will need an expensive bi-directional charger/inverter and connection to the switchboard.
Why do you need to switch from solar to grid? Isn’t any solar shortfall automatically covered by the grid and you pay the difference? Am old and confused!
I think you missed a third reason why people ask these kind of questions. They have an agenda. That agenda could be “climate change is a hoax” or “renewables are a con and I have to pay for subsidies through my taxes” or “it’s my God given right to burn fossil fuels and nobody’s going to tell me what to do.” or “I own lots of shares in traditional energy companies and this is hurting my portfolio”.
However misguided these thoughts might be, these tropes turn up on the internet all the time – like it takes more energy to make a wind turbine and install it than it generates over a lifetime (which is a popular FB one taken from a scientific study of wind turbines.) This get’s shared millions of times on social media and suddenly its a “fact”. What they left out was that was a case study for a theoretical poorly positioned wind turbine in a low wind location. In reality, companies don’t spend millions of dollars on wind turbines and put them in the wrong place.
I’m not convinced that comparisons of emissions solely on a per capita basis is the most realistic approach.
Perhaps some other factors should be in the mix like land area.
Doug S, it is peoples activities that is generating the emissions responsible for the climate change problem – not any emissions from untouched land.
In the case of Australia, a large percentage of the land area is effectively untouched & unoccupied, so if it produces any net emissions at all, the amount is no different than it has been for eons.
Per capita, however, Australia has one of the highest emissions in the world. Starting from such a high level, that should mean it is one of the easiest places in the world to reduce emissions.
Every country knows that lowering the cost of energy as a major input cost becomes the driving force of any economy and countries will keep on using coal and gas because of that reason, especially China and India and they are driving the coal price higher at the moment.
Warren Buffet is investing in wind and solar and makes his profit via the subsidies and the role of subsidies has to be explained here to justify the claim that solar and wind have become cheaper than coal and gas.
The subsidies will be justified to ensure the droughts and floods will be less severe in a cost/benefit analysis.
Hi Dominic
No, the role of subsidies doesn’t have to be explained here. The article isn’t about cost or subsidy, it’s about how fossil fuel generation requires far greater quantities of materials and a far greater amount of mining than solar and wind generation.
It would make more sense to put a price on carbon equal to the price of remove CO2 from the atmosphere and sequestering it long term and on the cost of toxic emissions and then make fossil fuel generation pay that rather than subsidize renewable energy, but that’s not the topic of this article.
“The Weekend Australian” – “Coal power surged to record in 2021: IEA” Coal generated more power in 2021 than at any time in history..
.An extra 800 million tonnes of CO2…
Colder than average winters in the northern hemi. and a warmer summer made the demand for electricity rise by 6% in 2021-the biggest jump since 2010…
Australia bucked that trend, with a 1% growth in electricity use largely supplied by additional renewable…
Australia added 1.3 GW of new wind and 4.7GW of solar in 2021…
Record gas prices in Europe drove a switch to coal…
High natural gas prices led to gas-to-coal switching…
Gas-fired generation grew by 2%, while nuclear increased by 3.5%…
Australian gas generation down 16%…
Coal made up 53% of electricity generation in 2021…
Renewable generation grew by about 18% in 2021…
Spikes in energy prices in Europe, Cjhina and India were contributing to social and political tensions..
Is there a reference for the 15:1 spoil to coal ratio? It’s hard to imagine it could be economical to mine with such a low yield. I would have thought tops 2:1 by volume for open pit (perhaps 6 to 1 by weight) and much less for underground where a single drift gets to the seam layer.
I couldn’t find the document I used with a quick search. But the Leigh Creek coal mine, the only coal mine South Australia has ever had, had something like 22 meters of overburden over a 15m metre seam of coal. By the time the mine had closed, they had dug down 200m to get to deeper coal seams. Leigh Creek was a pretty lousy coal mine by Australian standards, but does show there can be a lot of overburden. Overburden tends to be at least twice as heavy as coal, so one cubic meter of overburden may weigh 2-3 times as much as one cubic meter of coal.
Also, to get access to open cut coal, involves removing surrounding overburden, pits don’t have vertical sides. Under ground mines have much lower overburden ratios.
Peter Bawden
Yes, that’s a good point. If the slope is much more than 30 degrees it tends to it tends to fill itself in.
i used this for school