
The cost of rooftop solar continues to fall despite the fact that the Australian dollar has been falling too. It has been a while since I’ve harped on about how cost effective rooftop solar is, so I stayed up all night to make beautiful graphs of the simple solar payback time in every capital city. In other words I will show you how many years it will take the savings on your electricity bills to cover the cost of your solar power system.
You’ll have to wait until towards the end of the article to see just how beautiful my graph turned out1, but using what I consider reasonable assumptions I got some interesting results. One of them is that in Adelaide a 5 kilowatt solar system has a simple payback period of only 4 years.
Why Simple Payback?
I decided to calculate simple payback periods rather than other methods of examining cost, mainly because it’s simple. The basic idea is very easy to grasp — after X amount of time the money saved on electricity bills will equal the cost of your solar power system. This leaves some things out such as the cost of capital, so the real payback time will actually be slightly longer, but including that complicates things as the cost of capital varies between people. The cost of having systems inspected or maintained is also ignored, but the simple payback time can be so short this won’t be an issue.
What’s Needed To Determine Solar Payback Time
To calculate the simple payback period I need to:
- Decide on the size of the solar power system.
- Decide its cost.
- Determine a reasonable price for grid electricity in every capital.
- Decide on an appropriate solar feed-in tariff for every capital.
- Decide how much solar electricity a household will self consume.
- Work out how many kilowatt-hours of electricity the system will generate in each capital.
System Size Is 5 Kilowatts
I will use a system size of 5 kilowatts of solar panel capacity for my graph. Usually I recommend installing more than 5 kilowatts of panels if there’s room on your roof. With a 5 kilowatt solar inverter you can install up to 6.66 kilowatts of panels so I consider it a good idea to get around 6.5 kilowatts of panels if you can. But 5 kilowatts is a nice round figure, it’s not too far off the average size of solar systems, and it has been used for these sort of estimates in the past, so I’ll stick with it.
5 Kilowatts For $6,500
I have decided the the 5 kilowatt system will cost $6,500. This is not an unusual price for a 5 kilowatt system these days. You can pay more for higher quality, but I’ll assume this is for someone who is budget conscious. I would be wary of paying too much below this price unless you know the installer is reliable and does good work because of the potentially high cost of cheap solar.
This is a one price fits all capitals deal. This assumption is a little unrealistic as households in Melbourne and Hobart receive fewer STCs that lower the cost of rooftop solar than in other capitals, but I am keeping the price the same everywhere to allow easy comparisons.
Homes in Darwin get more STCs than in other capitals, but solar tends to be expensive there. There are a couple of reasons why and one of them is it costs more to make systems cyclone resistant.
Cost Of Grid Electricity
Perth, Hobart, and Darwin all have fixed electricity prices and solar feed-in tariffs, which makes things simple for those capitals. For Adelaide, Brisbane, Canberra, Sydney and Melbourne I simply used Origin Energy’s Solar Boost retail electricity plan. I did this because Origin is Australia’s largest electricity retailer and so a lot of people will already be on this plan. I also chose it because it has high solar feed-in tariffs. But there are a couple of warnings about it I feel I need to give:
- It is the Solar Boost plan and not Solar Boost Plus which gives higher feed-in tariffs, but only for 12 months and only for people who have bought a solar power system from Origin.
- After 12 months on Solar Boost they will dump you to a lower feed-in tariff. At the moment it appears you can just call them up and get them to put you back on Solar Boost, but it is annoying and I almost used a competitor of theirs instead because of this. But then I realized they may not be any better as this sort of behavior is very common among electricity retailers.
I used a standard tariff which means a flat-rate is paid rate per kilowatt-hour of electricity used. This makes sense because households with solar are usually better off on a standard tariff than a time-of-use one. This can change if a household gets batteries, but they don’t pay for themselves yet, so I won’t worry about that.
The prices of electricity in cents per kilowatt-hour after any discounts are applied are:
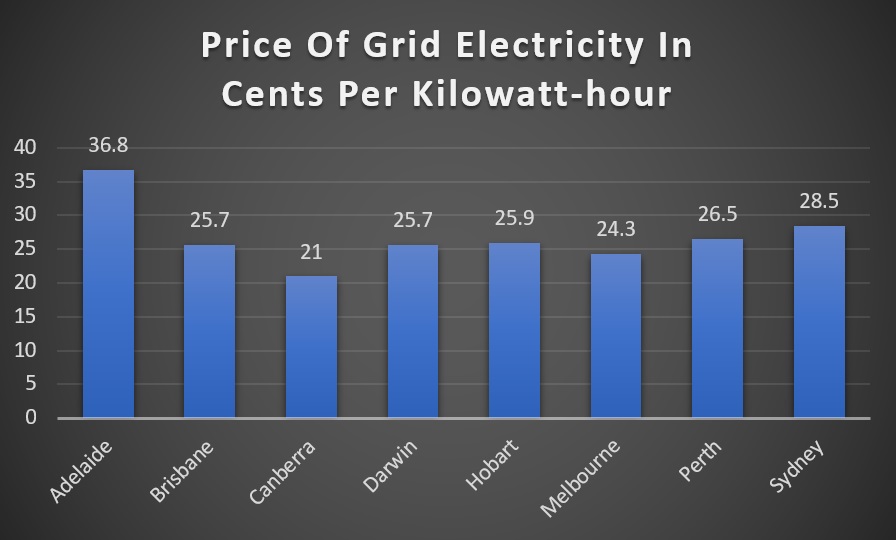
Adelaide is clearly the champion of high prices here while Canberra has the cheapest grid electricity of all.
Solar Feed-In Tariffs
Solar feed-in tariffs, either fixed or from Origin’s Solar Boost plans are:
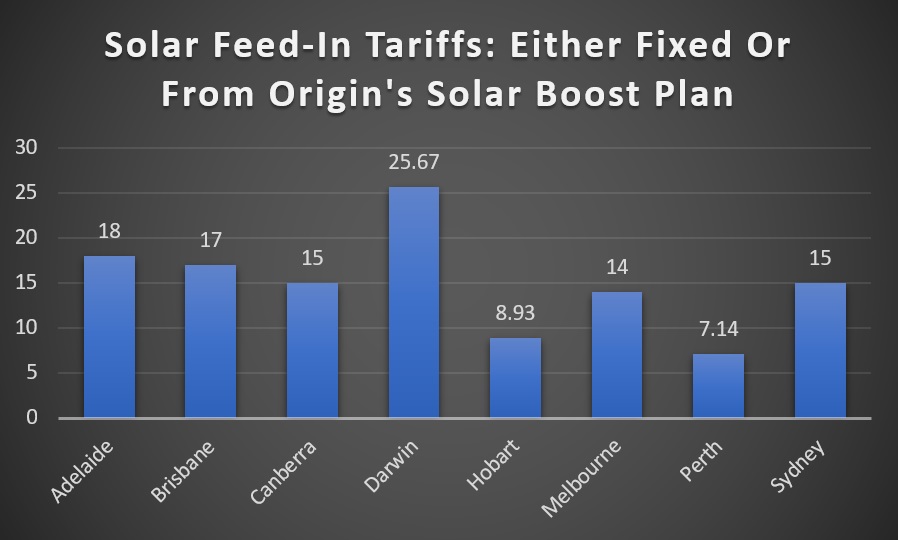
As you can see, Darwin really stands out as their feed-in tariff is equal to the cost of their grid electricity. It’s the only high feed-in tariff still available in the country – with the potential2 exception of rural and remote areas in Western Australia.
Solar Self Consumption
I have decided households will self consume 25% of the solar electricity they generate. This is around the average for a home with a 5 kilowatt system. The higher the rate of self consumption, the faster a solar panel system will pay for itself because not using one kilowatt-hour of grid electricity lowers electricity bills by more than sending one kilowatt-hour of electricity into the grid. Except in Darwin. There the rate of self consumption doesn’t matter as the feed-in tariff and the price of grid electricity are the same.
Solar Energy Generation
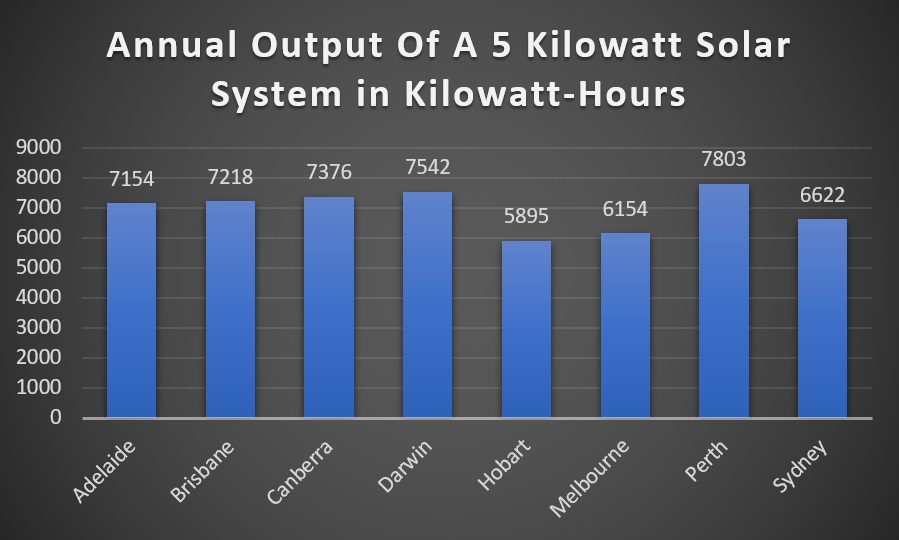
For the amount of solar electricity generated in each capital I have used 95% of the figure given by the PVWatts site for north facing solar. I have used 95% rather than 100% because not every system may perform as well as PVWatts expects and because not every home can set all their panels facing directly north.
The figures PVWatts gives for each capital in kilowatt-hours per year, less 5%, are:
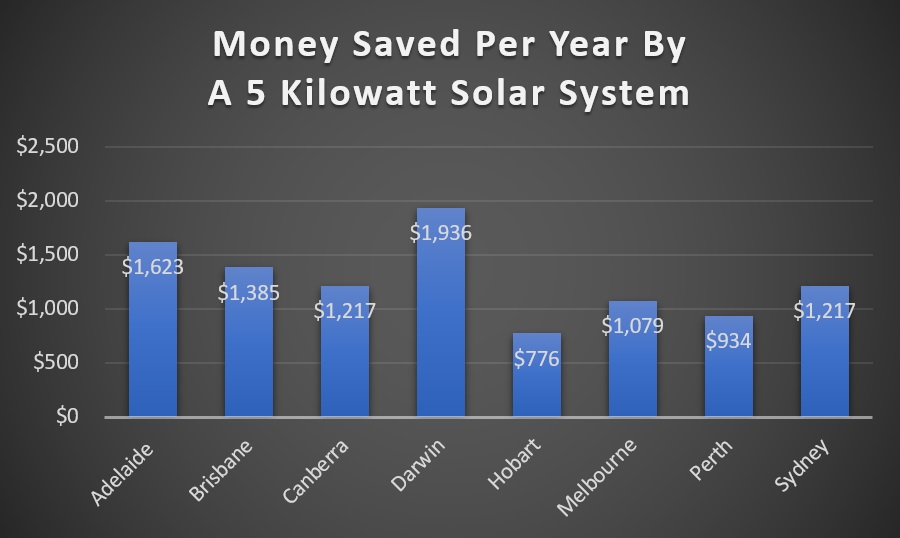
Money Saved Per Year
Using the information I’ve gathered and the assumptions I’ve settled upon, I can calculate how much money a 5 kilowatt system will save per year in each capital:
My Beautiful Graph Of Simple Solar Payback Times
Using the figures for money saved per year I’m finally I’m able to construct my beautiful graph of simple payback time calculations:
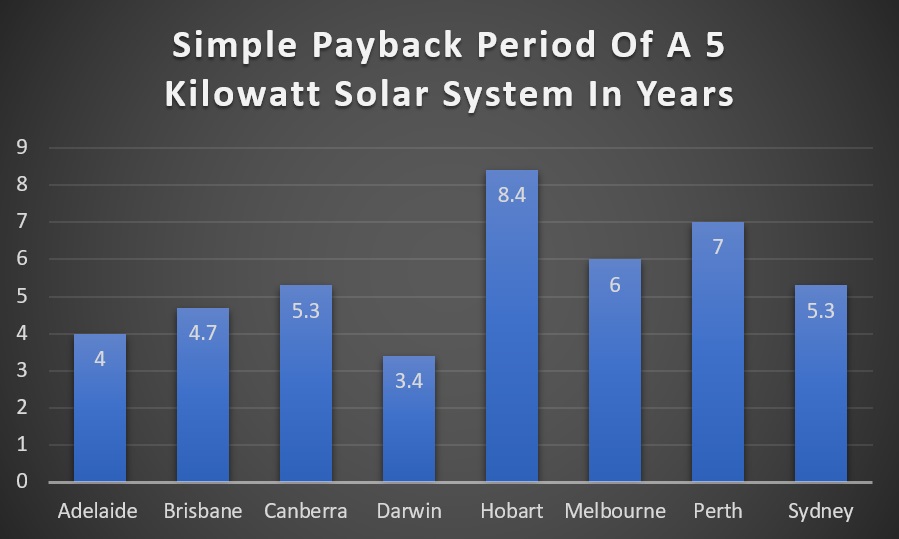
As you can see, Adelaide is the state capital with the fastest payback time thanks to the highest grid electricity prices in the country, but Darwin is the clear winner thanks to their high feed-in tariff. Hobart has the worst result, which isn’t surprising given that solar in Tasmania has the lowest output in the country and their feed-in tariff is not high. Melbourne actually does well considering it is the mainland capital with the least sunshine. Unfortunately, this is due to electricity price hikes rather than Mister Blue Sky deciding to spend more time there. Increased feed-in tariffs have also helped.
A surprising result is, despite having the highest solar output, Perth has the longest simple payback period on the mainland. This is due to their mediocre electricity price and the lowest feed-in tariff in the country.
It’s Possible To Do Better
The simplest way to improve payback times is to increase self consumption of solar electricity (except in Darwin). This is particularly effective in places like Perth where the feed-in tariff is very low. Smaller solar systems can result in a shorter payback time by increasing self consumption. But this may not be a good idea economically because even if a 5 kilowatt solar power system has a 7 year simple payback period it may still be better than any other investment the household can make.
A Moment Frozen In Time
These simple payback periods are calculated based upon conditions as they are now. As electricity prices and feed-in tariffs change so will they. Electricity prices are set to rise in Western Australia while they are expected to fall in other states along with feed-in tariffs. While they are only a snapshot and not set in stone, they can still be a useful guide and you can bump them up or down depending on how pessimistic or optimistic you are feeling.
What The Future May Bring
While the rate at which solar power hardware falls in price will eventually slow, I’m confident we’ll see at least a decade more of impressive price falls. But note the fall in solar panels from 60 cents a watt to 30 cents a watt will feel less impressive than when they fell from $6 a watt to $3. Given how cheap solar panels and inverters already are, there is no benefit in waiting for their price to fall further before getting solar installed. You will always lose more in electricity savings than you will gain by waiting for a lower price in the future.
Footnotes
- Oh go ahead and skip towards the end and have a look. If you can’t contain yourself I consider it to be flattery. ↩
- Potential because it can be very hard to get permission to install solar as the local transformers are often apparently full up and they don’t allow export limiting to get around this in WA. ↩
 RSS - Posts


We installed Solar in 2012 and have enjoyed it ever since. (Just 3.5 KW Delta Inverter and 14 Schott panels). But I am wondering how to check the performance as the system is quite complicated (not computer linked). Apart from cleaning the panels what else needs to be done re maintenance. And when should I need to replace them and how do I know that I need to replace them. We paid then $6200.
The good news is your Schott panels should be of good quality and unlikely to be having problems. While even good quality panels sometimes fail, I would expect Schott panels to last over 25 years which is the length of their performance warranty. While Schott no longer makes solar panels they are a huge company and still around and available to provide refunds or replacements if required. While their product warranty was only for 5 years and is now over, under Australian law you should still be entitled to a remedy if they fail partially or fully thanks to their performance warranty. Or at least that’s my non-professional interpretation.
It’s a good idea (and can be a requirement) have the system inspected by a solar installer every 5 years. Having panels cleaned can boost their output but most, but not all, systems are adequately cleaned by rain alone.
The simplest way to check if your solar system is functioning is to look at your electricity bills and check you are still receiving a feed-in tariff for solar electricity you send into the grid. To get a more accurate picture check if you have information on how many watts your panels are. If you have 14 panels of 220 watts each that will total 3,080 watts. Your inverter should have a display showing showing how many watts of solar electricity are being generated. (You may have to press a button to bring it up.) If the system is performing well when the sun is almost directly overhead on a clear day it should be producing about 80% of the panel capacity or about 2,400 watts. But if it’s only producing about 70% of the total panel capacity I wouldn’t worry about it. If it is performing poorly then check again on a couple of other days to make sure it’s not a once off and then decide if you want to get someone to inspect the system.
As long as they are working there is no need to ever replace panels. Some people decide they want a larger system and remove their old system, but that’s generally not a good idea if you are receiving an old high feed-in tariff as you will lose it. (But you can replace panels or other parts if they aren’t working properly.)
Thank you SO much for that info. It seems to me they are still working okay when considering the feed-in tariff I get. Stupid enough I did not sign up for the high one but am still glad to get 14c through Origin. This info is so useful to us who are not really technically inclined.
Excellent article thanks Ronald. My own experience in Melbourne has been better. In April 2014, choosing a package from three suggested by solar quotes (thanks again, guys) I paid a nett $2,995 for a 12 panel 3 KW system. The first full 3-month bill was just over $200 less than the same bill a year earlier, with no change in our pattern of use. Over the following 12 months the saving came to about $835 so I figured a payback period of just under 4 years. However I later realised that I hadn’t taken into account the rise in electricity prices over that time, and without doing the exact calculations, the payback period is probably 3 & 1/2 years or so. I’m a very happy Vegemite, at least partially, if not mainly, due to you guys for steering me in the right direction. I could rip out the system tomorrow and go back to paying full price for power, and I’d have saved money over only four years – which I won’t do, of course. I didn’t get ripped off, the system works very well, it’s paid for itself, and now it’s gravy. I am chafing at the bit for the next step.
Bring on cheaper batteries!
It is surprising that most “systems” concentrate on displaying generation statistics. Once installed, you can have little influence on this aspect, other than cleaning panels occasionally.
I would like to see more information on self use, and have built in hardware & software systems to maximise self use. Things like smart, built in control of “swing” loads such as pool pumps, hot water and battery charging would be helpful in this regard.
Perhaps there is some scope to lower pay back period using this type of control, providing you already have a pool or electric hot water.
Your right, inverters need to give you more information and be more flexible and programmable. I actually get my hot water from solar. (even though I have off peak). I’m retired so I have time to be able to do this. When my solar batteries are full (around 10.30 am, sunny day) then I switch on the hot water system which heats up from the electricity produced from the sun (self consumption). If I know that it’s going to be raining, then I will leave it on ‘off peak’ to heat up during the night. I have a switch on the hot water system. one is for solar/excess electricity and if you change the switch to the other side you use off peak power (obviously only at nights). I’d say 95% of the time my hot water will come from excess solar electricity. but it would be nice to be able to do all this via a programmable inverter.
My system is a bit complicated. ONE 5 kw solar system hooked up to a solar edge inverter and then to a 6.5 k.w. Tesla powerwall battery. and ANOTHER 5.4 k.w. solar system hooked up to two lg batteries totalling 16.5 k.w. both inverters have Wi-Fi for monitoring and the lg battery system has a force charge feature. (great for when the wet weather has set in).
Are you Off Grid Tim ?
Diverters that send surplus solar electricity to your hot water system are one way of making better use of solar electricity. I see the very cheap controlled load tariffs Victoria used to have seem to have disappeared so they are now potentially useful throughout the country:
https://www.solarquotes.com.au/blog/solar-hot-water-diverter-comparison/
Things such as the Fronius relay that only send power to an appliance when there is sufficient solar power are also an option:
https://www.solarquotes.com.au/blog/using-fronius-inverter-smart-meter-relay-make-solar-electric-hot-water/
And there are a number of home energy management systems that can help. So the pieces are coming together and falling in price, but still — especially from an environmental point of view — it still makes a lot of sense to use “brute force” and install the largest rooftop solar system that is practical.
Just letting you know Origin has just updated there FIT for the Solar Boost plan to 17cents (from 14cents) as another competitor offered 16cents( Energy Australia)
Also can you tell me why it’s not better to self consume power in Darwin? Do they have a higher FIT that’s better than what you buy power at?
In Darwin there is no economic difference for a household between using 1 kilowatt-hour or solar electricity or sending 1 kilowatt-hour of electricity into the grid. Using one kilowatt-hour reduces their electricity bill by 25.7 cents and sending it into the grid reduces their electricity bill by the same amount.
All good articles. Why are we letting the price /kilowatt hr to be dictated to us with solar if we got together to form a group we could sell our power for a rate we decide probably under the retail price directly to the public or put it up on the open market. The number of people going solar is going to be most of us so we should start now dictating our own price. Cheers
Interesting to read your post. In this morning’s “Weekend West” paper there’s an article about the WA State Treasurer (Ben Wyatt) and his latest budget, which is headlined “Consumers to pay full power cost”. It goes on to say that, “electricity tariffs are set to reach the much-touted level of cost reflectivity under plans to raise prices 5.6% in 2019-20.”
It goes on further “This would mean households paying the full price of what it costs power companies to provide electricity, eliminating a subsidy under which taxpayers have paid hundreds of millions of dollars per year to keep tariffs artificially low.”
For years I’ve been listening to the whingerati complaining about how “you solar panel owners are being subsidised and it’s costing us blah blah blah.” It will be a wonder to hear them complaining about the cost of power now that this long standing subsidy is removed. (From looking at my power bills the subsidy appears to go back to at LEAST 1988, and BOTH sides of politics are guilty of featherbedding the power consumers.)
I twigged it in about 2004 and thought that at some stage there would come the reckoning when certain people realised that this was no longer financially viable, so I began working with solar panels and despite (or because of?) past and projected increases in power prices, I’m still looking like not paying anything for electricity in the foreseeable future, and based upon that my payback time has gotten shorter, though I’ve given up trying to calculate when it will be, as there have been so many variables to contend with. Eg In WA we have two sources of income (for some people) from solar. One is called the “Feed in Tariff” (FiT), which is a government grant to generating households which initially started at 60 cents (gross) per kWh when the Barnett Govt was first elected, then it went down pretty quickly to 40 cents (net), then down to 20 cents and finally it was ceased. It only had a 10 year lifetime and most of this subsidy is gone now.
The second financial gain comes from what is called “Renewable Energy Buyback Scheme” (REBS) which is a contract between the generator and the utility for the utility to buy excess power. At present the price is about 7 cents per kWh.
But looking at my power bill for Dec 2012, I was receiving $122.80 from FiT and $25.92 from REBS (for 58 days). I now no longer receive the FiT, but still get REBS money. For my Dec 2018 bill I note that I received roughly $24 for 63 days.
So bearing in mind that your article doesn’t seem to discriminate between FiT and REBS, I would question its accuracy, as far as Western Australia is concerned.
Further, with this projected increase in power prices, it will be interesting to see how many of the “whingerati” of which I spoke will now move towards solar power, and not complain about the “subsidies” they think they’ll get. (By the time the price increase comes into force, there will be very few houses in WA receiving FiT, but will still get the REBS.)
It’s hard to believe that I am being subsidized by the grid here in Adelaide when on my last bill I was charged around 59 cents for each kilowatt-hour of grid electricity I used. I also find it hard to believe Perthians are receiving the full value of the solar electricity they supply to the grid with their low 7.135 feed-in tariff.
Im confused..re you were charged 59 cents…i live in Adelaide…and the highest i was charged was around 40.7c plus gst = say 45 cents per kw.
Thanks for a brilliant article anyway.
Cheers
Hi Rafael
That’s the total cost I paid per kilowatt-hour including the daily supply charge. I took the total amount on my bill and divided it by the number of kilowatt-hours of grid electricity I used to work it out. The amount per kilowatt-hour is high because I didn’t use much.
Do people in other states also receive REBS? Here in Qld I’ve never heard of it.
It’s just what they call their feed-in tariff. In WA it’s the same for everyone in and around Perth while in Queensland it’s only what electricity retailers offer.
This link gives a detailed breakdown of the new power prices as from 1 Jul 2018. Interesting to note that the “supply charge” (for the poles and wires etc) has also gone up, from 94.9 cents per day to 101.5 cents per day, for many users.
https://www.synergy.net.au/Global/ARP18-Price-changes
And there’s still another 5%+ kick for the following year. =80
Regarding the Synergy web page regarding the price icreases of 7%, it is interesting to note, as I believe that I have mentioned elseewhere on the web site, that no mention is made of any increase to the WA 7.1350/kWh Feed InTariff (they may name if differently, but, it is what it is).
So, it is even more money for the MP’s to pocket, in their looting.
Whilst it might only work out to about half a cent per kWh, for each kWh of electricity fed into the grid, over all of WA, it is probably enough to buy each state MP a new Bentley SUV with a maximum speed of 270km/hr, so they can escape faster, when they have filled the car with gold from the treasury.
“(they may name if differently, but, it is what it is).”
Whether we agree or not with what it’s called, it’s their money, and they can call it what they like, and if somebody contacts the utility in regard to wishing to apply for REBS and instead asks about the Feed-in Tariff, they will probably be told that the Feed-In Tariff ceased several years ago, which at the very least could cause delay and at worst failure to receive any payment for excess electricity. On my power bills (as I mentioned above) they were two entirely separate payments. In this instance it’s not a case of “a rose by any other name”.
That’s what I thought; so my question still is: do other states have REBS?
Ronald
I’m not convinced by your methodology.
You have to make some assumptions, and it’s simple and convenient to assume that everyone’s panels are basically facing north, and are basically at the same angle (twenty degrees) that PVWatts uses in its calculations. Then you knock off 5% to acknowledge that _everyone_ may not achieve this ideal configuration. Personally, I’d have knocked off 25%; have a look at a map of any suburb on whereis.com.au. The houses are at all angles ! And I bet a lot of them are partially in shadow from trees or other buildings.
Anyway, let’s assume your 5% is the correct figure, and that in Sydney a 5KWh system will generate 6622 KWh per year. (ie the 6970 KWh that PVWatts calculates, less 5%)
You’ve assumed that the customer will self-consume one quarter of this 6622KWh (that’s plausible, and you have to assume something)
Where I take issue with your methodology is in the next steps
First, you have taken a15 cents feed-in tariff and applied it to the three quarters of the 6622KWh that you are exporting, and calculated that this will return $745 FIT. (As an aside, I question why you’ve used 15 cents. It’s 17 cents in the published ORI468291MR, Origin’s Solar Boost tariff for NSW, effective 23-03-2018, but let that pass.)
Second, you apply a flat rate of 28.5 cents KWh for the usage charge and applied that to the one quarter of the 6622KWh that you are self consuming, and calculated that this will save you $472. Add that to the $745 FIT, and you’ve saved the $1217 shown on your graph.
If the system is going to cost $6,500, the savings you have calculated will pay for it in a bit over five years (And if Origin pays 17 cents not 15 cents then that payback period becomes even shorter !)
It’s superficially plausible, but it doesn’t stand up to analysis.
To get the high (17 cents) FIT you have to sign up to the Solar Boost tariff. What Origin gives with one hand they take away with the other. In this instance they charge 155.111 cents per day Supply Charge, plus 14.850 cents per day Supply Charge for the Controlled Load (ie the overnight hot water heating) ie $1.70 per day. That’s about 90-100 cents per day (ie $80 to $90 per quarter) more than many other tariffs. That extra $360 a year needs to come off the savings gained from the high FIT. If you are going to save not $1217, but only $900 or so each year, the payback period rises from five years to over seven years.
In practice, every customer will have a different payback period, because every customer’s consumption (and consumption pattern) is different. For many people a low FIT and a low Supply Charge will be more economic. And it may be unpalatable to people in your industry, but there are some users (singles and couples with low power consumption) who will NEVER recoup their outlay, at current prices.
Just as a follow-on to the above. From where did I get the 25% reduction against the PVWatts figures? (See para 1 of my comment)
Well, I have a 2KW system, on a roof with 7.5 degree tilt. (ie it’s nearly flat)
Its azimuth is about North West. (315 degrees)
Feeding those figures into PVWatts yields a prediction of 210KWh for March.
Now, I happened to be out of the country for all of March. I tuned off EVERYTHING except the fridge. So self-consumption was minimal, and – for practical purpose – what I exported equals what I generated.
According to Origin, I exported 162KWh ie about 25% less than the theoretical figure.
Just curious – were you able to match exactly (or very closely) the precise specifications of your panels with the various options allowed by PV Watts? (the devil can be in the details). I found that PV Watts tended to under-estimate my actual figures slightly.
But – even if PV Watts are out a little – its still useful because you can still explore the effects of various panel placements. Eg. you can useful answers to questions such as – whats the effect of having 9 panels facing North and 6 panels facing West, versus all 15 facing North, or 9 facing west and 6 facing North. If you express the differences as % variations ( with 15 North facing panels = 100%, you can get some useful insights.
As well, how ‘old’ are your refrigerators.? and whats the airflow like around them? How full do you keep them? are there any leaks around the door seals – attention to those things can reduce their consumption by about 50% or more)
Hi Ronald
Really enjoy your blogs.I can give you some actual figures in regard to “payback periods”.
Our solar system was sourced through your company via the 3 quotes offer. The system is made up of a 5kW Fronius inverter, Fronius Smart Meter and 6.44kW of Q Cell panels. The system recently celebrated its first birthday.
At the end of the first year it produced 10370 kW and sold back 7710 kW to the grid. Our two person Gold Coast home consumption for the year totaled 5895 kW (3235 kW from the grid and 2660 kW self consumption) Our ROI totaled $1721.00 (made up of $1050 yield and $671 in actual savings via self consumption)
Our payback period will be 4 years (or even earlier based on the recent increase of FIT to 17 cents). ($6990 system purchase price).
I’m very very happy with these figures and the performance of our system.
Glad to hear it!
I have been told to use more power at night time to get my power bill down???
Hi Debbie
That will only work if you are on a time-of-use tariff and only if you shift electricity consumption from the peak period in the afternoon and evening to the off-peak period. For example if you put your dishwasher on a timer so it will switch on when you’ll pay the off-peak rate.
But if you have solar you can be better off shifting your electricity consumption to the middle of the day. It will depend on what your feed-in tariff is and what the off peak rate is, but generally households with solar are better off with a standard tariff than a time-of-use one and, if possible, shifting electricity use to the middle of the day.