

If you’ve ever wondered what difference a home battery actually makes to the way your home interacts with the grid, the Australian Energy Market Operator (AEMO) has some new real-world data.
Buried in the latest Quarterly Energy Dynamics report is a comparison of 20,000 Australian homes that examines how households with rooftop solar and those with both solar and a battery imported and exported electricity during the second quarter of 2026.
The comparison reveals just how dramatically a battery can reduce a home’s reliance on the grid during the busy evening period, when electricity demand is typically highest.
How Did AEMO Compare Homes?
AEMO analysed two groups of 10,000 detached homes connected to the National Electricity Market.
One group had rooftop solar systems under 20 kW but no battery. The other had similar-sized solar systems paired with batteries that had been installed between July and December 2025. By comparing how the two groups imported and exported electricity over an entire quarter, AEMO could see what difference the batteries made in everyday operation.
The daily electricity profile of homes with batteries looked noticeably different.
Rather than exporting most of their excess solar around the middle of the day, battery homes held more of that energy back. As a result, they remained net exporters later into the afternoon and didn’t become significant grid importers until much later in the evening than homes with solar alone.
This shift in timing changes both when households use their own solar generation and when they rely on the grid.
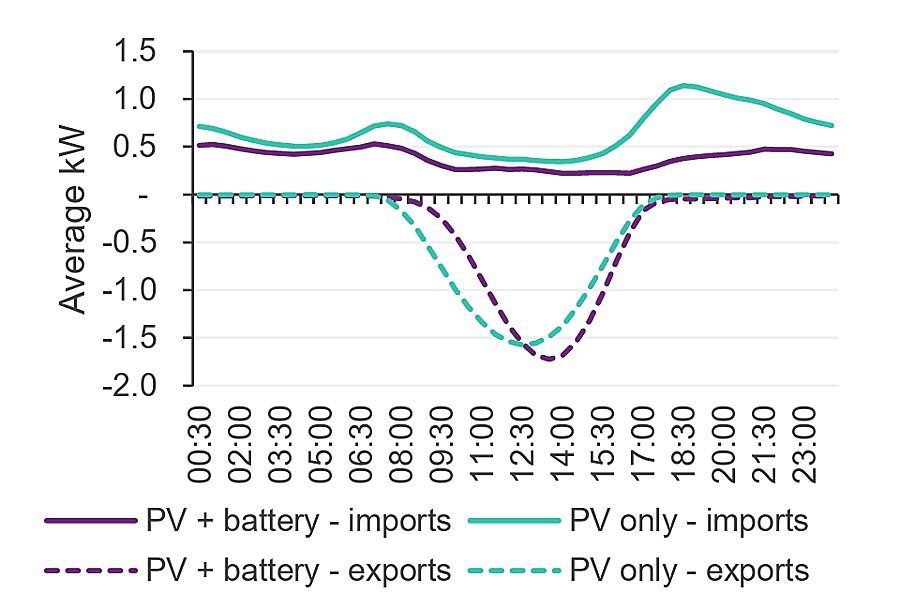
Average household electricity imports and exports for homes with rooftop solar plus a battery and homes with rooftop solar only. Source: AEMO Quarterly Energy Dynamics Q2 2026.
A 73% Reduction In Evening Grid Imports
The biggest difference came during the evening peak between 4 pm and 9 pm.
Across the sample, homes with batteries imported an average of just 0.3 kW from the grid during those hours, compared with around 1.0 kW for homes with solar alone.
Don’t confuse these average power figures (kW) with energy consumption (kWh). They’re a measure of how much grid power the average home was drawing at any given moment during the evening peak.
In other words, homes with batteries drew 73% less power from the grid during the evening peak than similar homes with solar alone.
That’s an impressive figure, but it’s worth understanding exactly what it means.
It doesn’t mean battery owners reduced their total electricity use by 73%, or cut their bills by that amount. Instead, it shows how much less electricity they needed to draw from the grid during the period when demand is usually highest.
For the electricity system, that’s significant. When more households rely less on the grid during the evening peak, it helps reduce pressure on the network when it’s needed most.
Small Changes At Home Add Up Across The Grid
The study also helps explain some of the broader trends AEMO observed across the National Electricity Market during the quarter.
Wholesale electricity prices fell sharply, gas generation reached its lowest Q2 level in more than two decades, and grid-scale batteries increasingly set market prices during the evening.
While many factors contributed to those changes, AEMO says growing numbers of home batteries are reshaping demand by charging during the day and reducing grid imports during peak demand.
Real-World Evidence
There’s no shortage of modelling showing what home batteries are expected to do.
What’s different here is that AEMO wasn’t modelling future behaviour. It was measuring what thousands of Australian households actually did.
For anyone curious about how batteries change the way a home interacts with the grid, this comparison provides one of the clearest real-world snapshots yet.
If you’d like to see what those findings could mean for your own home, our home battery guide explains battery types, costs, rebates and the key things to consider before buying.
 About Kim Wainwright
 RSS - Posts





Which battery firmware supports this configuration?
The ability for the user to configure its operating firmware so that, subject to the energy retailer’s tariff conditions and approval, during any off-peak or free Time of Use (ToU) tariff period, the household demand is supplied entirely from the grid. During this period, the battery should also be able to charge from the grid while 100% of the available solar generation is exported to the electricity network.
Without this functionality, my financial analysis of the Ergon 12F would increase my cost of power based on my consumption profile. I do not import any power in the time interval 11:00 am to 2:00 pm, but my daily surcharge for 12E increases from $1.5763 to $1.77853 for 12F no cost benefit.
The analysis was done using the Ergon NEM12 report for my smart meter which is the revenue grade data for imports and exports.
2 things: I have a Deye inverter, & it has up to 6 TOU periods that can be easily programmed. With the latest firmware, the grid can be set to nothing, import or export (or buy & sell).
One trap is if you have the inverter clock set to update off the web time server, one needs to ensure the time is set to Eastern Standard time (for the Eastern states), not Daylight saving time.
To me this indicates that solar + Battery should be mandatory on all new builds. Even units should have Solar on Community property, & individual batteries I feel. Might as well make EV wiring included as well (just the cables)
The graph is puzzling in that the solar with battery exports, is higher than the solar only exports st around 1pm. Do battery owners generally have larger solar?
Otherwise a very handy reference for me to compare my solar only household against a real population.
Good observation Ian. One thing to keep in mind is that the graph shows average net power (kW) at each point during the day, not the total energy (kWh) exported. So the slightly higher export around 1 pm doesn’t necessarily mean the battery homes exported more energy overall. AEMO describes the two groups as having “similar-sized” solar systems rather than identical ones, and the report doesn’t explain the small midday difference, so I wouldn’t want to speculate beyond that.
Does this make sense?
The report doesn’t appear to describe a methodology for the data collection for figure 10, so I assume AEMO used NEM12 data originating from a smart meter.
A smart meter records kWh over a time interval (mine is 5 minutes), and when summed to 1 hour intervals, will give the average kW for that hour.
So even though they claim kW as the unit, it may be derived from shorter interval kWh records of smart meters.
Looking at the area ‘under’ the export curves, it does appear battery owners export more energy even though they are filling their batteries too. To me this implies they have larger systems which would seem plausible because they are more likely to be new systems, purchased when panels are cheaper. I couldn’t see in the doc where it said similar-sized – just that they are all below 20kW.
While the general conclusions are expected (that’s what batteries are for), it’s not clear to me how the two sets (net import and export curves) were constructed. I wonder if the data is a single day or averages for a period. Would a system only contribute to one curve depending on whether it is a net importer or exporter?. This would mean the Ns are very different across curves?
I’m trying to see any meaningful evidence of lunchtime free periods or evening battery exports. Is that tiny 6pm difference between dotted purple and dotted green all we see from battery arbitrage?
Wish we could see data.
oops, got the areas mixed up – export less…
AEMO is graphing average kW. Using NEM12 data, the average can be calculated by adding together the 10000 household readings for a time segment for each day of the quarter, then dividing the total by 910000 (10000 households in the sample, times the 91 days in Q2).
We won’t see the effect of Solar Saver 3 free hours until the Q3 results are available or Q4 for Victoria.
One thing that might be worth considering is that some folk already shift their power spike to the mid-morning through noon period e.g. many retirees. Obviously those who work, or go to school, can’t change\avoid early\late power spikes, but it’d be interesting to know what the ratios are. Distribution could also be a factor i.e. suburbs that are retiree heavy versus those that have very few that can shift their power consumption habits.
Obviously a battery will reduce non sunshine hours imports from the grid, but It also drops exports. So is it cost effective?
With 7.8kw roof top solar my current annual net electricity charge is around $1000 plus a whopping $840 connection fee (Country NSW). We have a pool so some daytime goes to running the pump. (6000kwh of exports are calculated into the net charge above).
Using the sunspot calculator adding a 10kw battery I save less than $200 PA. The battery would have to last 50+ years for me to break even.
That comparison is confusing to me – “under 20kw solar systems” would be 95% of installed systems wouldn’t it?
Single phase systems are generally limited to 10kw, 3 phase systems can go to 30kw, but gee you would want an awful lot of available roof space to support 40 plus panels to reach 20kw capability.
Also must be a lot of houses using bugger all power during peak period for the average use to only be 1kw for those with no battery, (who would mostly be drawing from the grid by that time of the afternoon even in summer.)
Andrew, I feel you missed the word ´average´. In my case, I have 15Kw on the roof, & 62Kw of battery (12Kw in 2018, rest in May26). We draw very little peak power: most is shoulder/offpeak. the 12Kw battery flattens by 8pm, so there is some draw on that phase. When I get around to it, I might export on the other phase to balance that draw, but it is only a few kw/day anyway. Unfortunately, I feel the higher daily charge makes a VPP for me currently not worth the effort. Hopefully, that may change in the future.
Real world experience. Since installing a battery and solar we dont pay for power or supply charges. We run the house incl ducted air (with limits) or split system easily until the next day to repeat the process. You cant do this with solar alone. The peak generating time in the day is a appalling feed in tariff of just cents v 35+ to buy power. A battery can store to allow time shifting for consumption.
In some ways its a shame the govt slashed the battery rebate scheme. It had encouraged large batteries but now encourages batteries that are too small.