
Last year saw solar power claim its highest share ever of new electricity generation capacity additions in the USA says a new report from the Solar Energy Industries Association (SEIA) and Wood Mackenzie.
Even with the impact of Trump’s “solar tax” that SEIA called “devastating” late last year, 13.3 gigawatts of PV capacity was installed throughout the country in 2019 – a 23% increase on 2018.
Across all market segments, solar PV accounted for 39.8% of all new electricity-generating capacity additions last year. The previous highest result was 39.5% in 2016.
“Even as tariffs have slowed our growth, we’ve always said that the solar industry is resilient, and this report demonstrates that,” said Abigail Ross Hopper, president and CEO of SEIA.
More than 8.4 GW of utility-scale PV capacity came online in 2019, up 37% on the previous year.
In terms of home solar, more than 2.8 GW was installed during 2019, up 15% on 2018. It’s a good result, but holding back greater uptake is residential solar remains very expensive in the USA compared to Australia.
For example, the average price for a 6kW system in the U.S. is currently around the USD $13,000 mark (after tax credits), which works out to approximately 21.7k in Australian dollars. In Australia, the cost of solar is far lower – around $5,000 – $9,000 for a good quality 6kW system depending on the components used (this price range is after the “solar rebate“).
It wasn’t all good news in the SEIA’s report, with the non-residential segment seeing another decline (2 GW installed in 2019, down 7% from 2018). This segment includes commercial, government, nonprofit and community solar installations. The report states the decline was due to a handful of state-specific regulatory issues and policy reforms during the year.
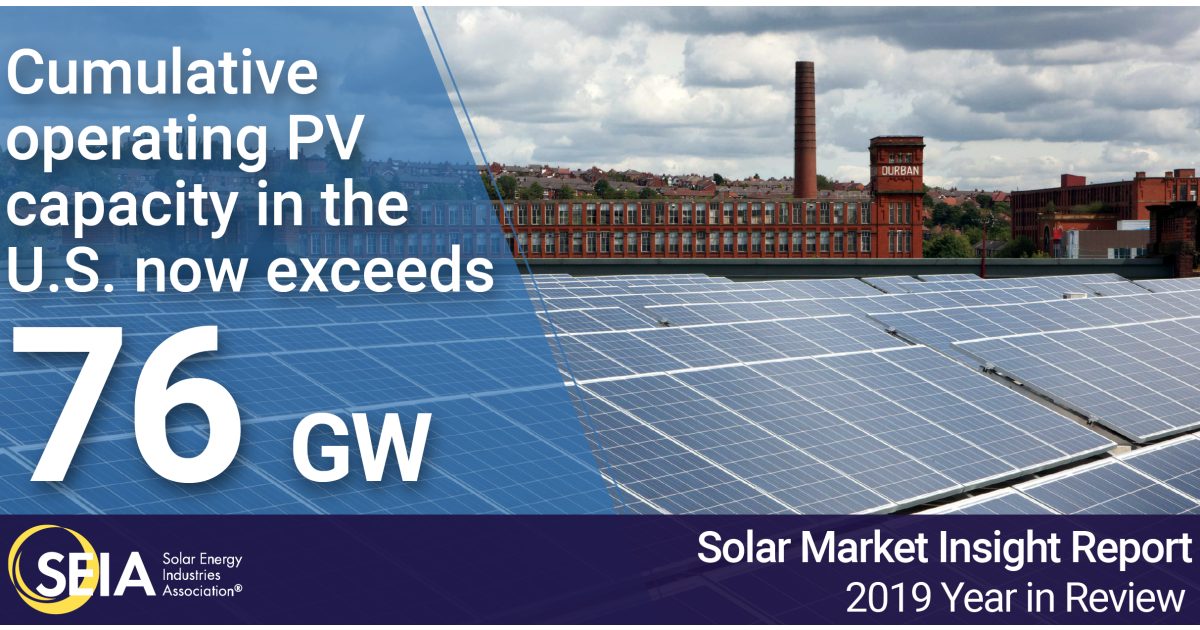
Cumulative operating PV capacity in the U.S. eclipsed 76 GW by the end of last year. It’s a huge jump from just ten years prior when its total capacity was 1 GW. As at the end of September last year, total installed solar PV capacity in Australia was 13.9 GW (source: APVI) – so we’re still punching well above our weight given the difference in population (USA ~329 million vs Australia ~25.4 million).
The Coronavirus Challenge For U.S. PV In 2020
As for this year, things are looking a little hazy in the USA due to the unfolding crisis relating to the coronavirus COVID-19.
“We know anecdotally that the COVID-19 pandemic is affecting delivery schedules and our ability to meet project completion deadlines based partly on new labor shortages,” said Ms. Hopper.
The report states total installed PV capacity in the U.S. is projected to rise by 47% this year, with nearly 20 GW of new installations expected by year’s end. However, SEIA says projections may need to be revised as the wider effects of the crisis become clearer.
The executive summary of the U.S. Solar Market Insight 2019 Year-in-Review report can be viewed here.
 RSS - Posts


“Cumulative operating PV capacity in the U.S. eclipsed 76 GW by the end of last year. It’s a huge jump from just ten years prior when its total capacity was 1 GW. As at the end of September last year, total installed solar PV capacity in Australia was 13.9 GW (source: APVI) – so we’re still punching well above our weight given the difference in population (USA ~329 million vs Australia ~25.4 million).”
These amounts would have been enhanced in their significance and comparability, by being expressed as respective quantities per capita of population.
It is like road deaths – see
https://en.wikipedia.org/wiki/Road_safety_in_Europe
– specifically, the table “European Union Road Safety Facts and Figures”, and, compare the road deaths per million inhabitants of the various countries, with Australia, and the various states of Australia (eg, the best one – the UK, which, in 2018, had 1825 road deaths, and, whilst that number is high, the number of road deaths per million inhabitants, is only 28, which is way beyond the reach of Australia and its states, where road safety is conspicuous by its absence, and, also conspicuous, is the the contempt of the legislatures, for road safety.
So, correspondingly, regarding production capacity of domestic rooftop photovoltaic systems, and, all photovoltaic systems, in a country or region within a country, what is more significant, is notsomuch the total capacity, as the capacity per capita.