
The Desert Knowledge Australia Solar Centre Puts Panels Through Their Paces: SunPower, Winaico, Q-CELLS, & Tindo Do Well
The Desert Knowledge Australia Solar Centre isn’t just a mouthful, it’s also where they test a range of solar panels and display their performance on the internet for everyone to see.
The Desert Knowledge Australia Solar Centre… Tell you what, I’m just going to call it DKASC from now on, as in Dee-Kasc, because the only mouthful I want at the moment is a fried egg sandwich.
DKASC has been in operation for over 10 years, gathering useful information on the performance of panels in the hot desert environment of Alice Springs. They are funded by the Australian Government — but whatever you do, don’t tell the current Australian government they are doing something useful. They may feel the need to compensate.
Currently 42 systems are being tested using solar panels from 22 different manufacturers. Out of these 22 there are only 7 manufacturers that still have significant numbers of their panels installed in Australia. This is because there has been a hell of a lot of attrition among solar panel manufacturers over the past 10 years. I am going to look at the performance of these survivors:
While they are no longer sold in Australia, I have also included Hanwha as there are quite a few of these panels around and I’m sure there are people interested in how they perform.
While the results need to be taken with a grain of salt (or possibly zinc oxide) because the solar panels being installed today won’t be identical to the ones installed years ago, I found the best performers out of these 8 panels were:
- Tindo
- SunPower
- Winaico, and…
- Q-CELLS
The worst performers were CSUN and Trina, but I will mention the Trina panels are older than the others – so their results aren’t directly comparable. While they didn’t do well I don’t think you need to be concerned if you have Trina solar panels on your roof.
Alice Springs Climate
Alice Springs is a hot desert environment. The average rainfall of 283 mm a year would result in a semi-arid classification, but the high rate of evapotranspiration means it’s officially classed as desert. This is something you probably won’t have any trouble believing if you head out there.
The extremes of temperature between night and day make Alice Springs a harsh place for solar panels, so those installed in the more populated areas of Australia may survive better and suffer less deterioration. But Alice has extremely low humidity, so if you live in a humid tropical or sub-tropical area the results may be less applicable as high humidity could cause problems that aren’t seen in central Australia.
A sunny climate means a solar power system in Alice Springs will produce around 27% more kilowatt-hours than an identical system in Sydney, but on a clear days the output of both systems will be roughly the same. This means performance on a clear day at DKASC is comparable to clear days in other locations in mainland Australia.
Orientation And Tilt
Regardless of your personal orientation or tilt you can still enjoy the benefits of rooftop solar. But when it comes solar panels themselves, some orientations and tilts are better than others. To generate the maximum possible output, fixed panels that aren’t on a tracker that follows the sun should:
- Face directly north.
- Be at a tilt that is roughly equal to the latitude of the location.1
All the solar panels that aren’t on trackers at DKASC face directly north and are at a tilt of 20 degrees. This is handy because it’s a nice round number between the two most common roof slopes in Australia, which are 15 degrees and 22.5 degrees. The difference in output between these two angles and 20 degrees is not worth worrying about.
Weather Conditions On Tuesday The 19th Of March
I will look at how well the solar systems performed two days ago, on the Tuesday the 19th of March 2019. Here is a graph showing what the the temperature and insolation in Alice Springs were like on that day:
The yellow line is insolation, which is a fancy word for sunlight energy. It is mostly smooth with only a few wriggles that indicate clouds, so it was an almost clear day. The red line is temperature. It got pretty hot in Alice, hitting a maximum of 36 degrees.
Temperatures during the main hours of solar output in Alice Springs average around 6.5 degrees hotter than in Sydney. This extra heat is enough to make typical solar panels provide around 2.6% less energy. However, SunPower panels are less affected by heat and this will only reduce their output by around 1.9%.
Comparison Groups
I want to compare panels from 8 different manufacturers, but it’s complicated by the fact they were installed at different times. It’s not fair to compare the output of a panel installed in 2009 with one installed last month, as the old one will have suffered 10 years of degradation while the other is almost new and will — hopefully — have taken advantage of 10 years of advances in solar panel design.
To work around this problem I will compare panels in two separate groups that were installed at around the same time. The first set of 5 was installed from 2011 to 2013 while the second set of 4 were all installed in 2016. Finally, I will show the results of Trina panels separately as they are the oldest solar panels at DKASC.
Inverters
The first group of systems were all installed with SMA inverters. The inverters were not all the same capacity and those installed later may have been improved models with higher efficiency, but the fact they were all SMA makes comparisons between the panels in the 1st group reasonable.
Unfortunately, in the second group, the Tindo panels used Enphase microinverters while the others used SMA inverters. Because the panels at DKASC don’t suffer from any significant shading, the difference in performance between these two inverters should be small, but solar panels with microinverters can still be expected to produce around 3% or so more energy. This means the Tindo panel’s good result may be due to having a different inverter.
1st Group: 5 Brands Installed From 2011-2013
The 5 panels in the first group are shown below. The brand names are first followed by the panel designation — except for REC because that information wasn’t provided, so I put the solar panel’s wattage instead. This is followed by their year of installation:
- SunPower SPR-238-WHT-D 2011
- Winaico WSP-240P6 2012
- QCELLS Q.PRO-G3 2013
- REC 250 watts 2012
- CSUN CSUN 250-60P 2013
Of these, the first four would generally be considered to be premium panels, while CSUN would not be considered that way.
When I asked the DKASC site to give me a graph of the SunPower system’s output on Tuesday it gave me this:
Holding my mouse cursor2 over the highest point on the graph gives me the maximum amount of power provided per kilowatt of panel capacity that day:
If I add the information for Winaico and QCELLS panels to the graph they do very well and appear just below SunPower’s blue line. These two are almost identical, with Winaco’s red line just above QCELLS yellow line:
If I add REC in green and CSUN in purple they appear below the first three and their performance is similar with REC doing slightly better:
 Putting the maximum power output per kilowatt of solar panel capacity for all 5 panels into a graph gives:
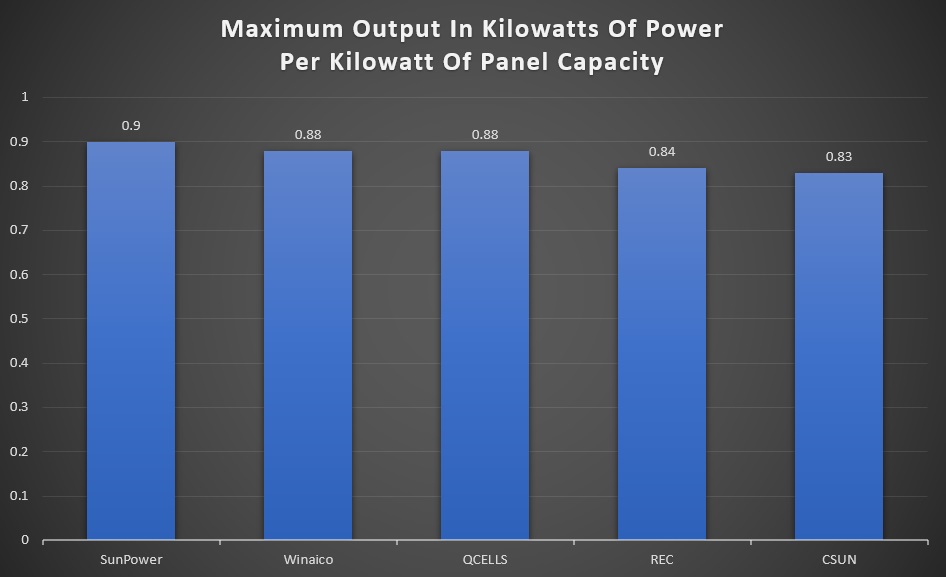
The best result, SunPower, has a maximum output that is 8.4% higher than the worse result, CSUN. This doesn’t mean SunPower panels produce 8.4% more energy per watt as the greatest difference occurs in the middle of the day. At 10:00am when solar panel output was just over half its maximum, the SunPower panels only produced 6.8% more. But because most output occurs in the middle of the day the SunPower panels still produce roughly 8% more kilowatt-hours on a clear day.
I was not surprised SunPower had the best result. It’s a premium panel and sold at a premium price. Their output is especially impressive given they were installed in 2011 and are the oldest solar panels of the group.
Winaico and QCELLS are the next best performers. While their output is almost identical, as the Winaico panels are a year older I have no problem giving them second place and QCELLS third.
The performance of REC and CSUN are a little disappointing. Their results are close, but although the CSUN panels were installed a year later they are clearly in last place. These days REC positions itself towards the premium end of the market while CSUN is considered a budget choice, but at the time these solar panels were installed the difference in perception between them may not have been so large.
2nd Group: 4 Brands Installed In 2016
Here are the brands, panel designations, and inverters of the second group. These were all installed in 2016:
- Tindo Karra 250 Enphase microinverter
- QCELLS Q.PLUS BFR-G4.1 275 SMA
- Hanwha HSL 60S SMA
- Canadian CS6K-265 SMA
I’ve put the Tuesday performance of all 4 panels on one graph and I’ve added labels so you can see which is which:
Here are their maximum outputs in a graph:
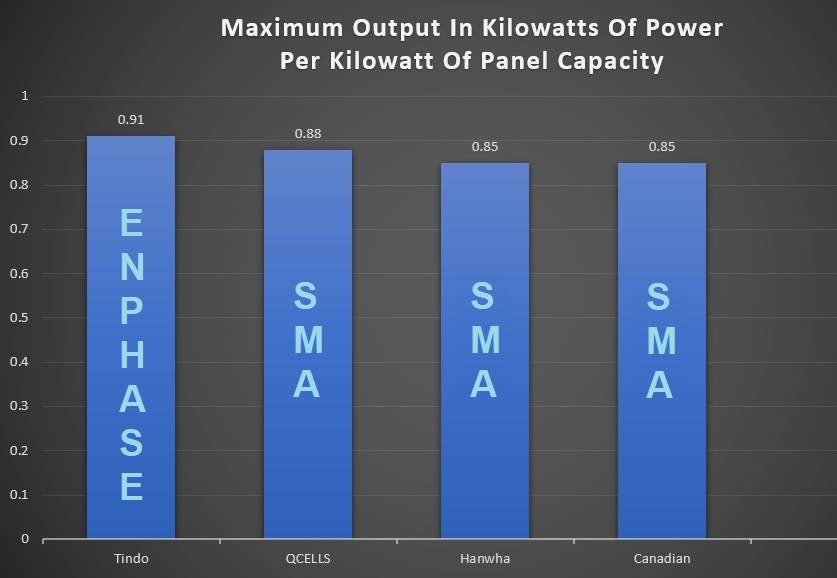
The made-in-Adelaide Tindo solar panels performed best, but we can’t be certain this wasn’t due to having Enphase microinverters. While Tindo are high quality panels, without microinverters I suspect their performance would have been around the same as the second place QCELLS. The two worst performers were Hanwha and Canadian Solar, which tied for third place.
Trina Panel Results
DKASC has three Trina installations. One is fixed, one has dual axis tracking, while the third has dual axis tracking that looks broken to me. Maybe a kangaroo hit it or is using it as a hammock. Because of this I will only look at the first two, both of which use Trina TSM-175DC01 solar panels and SMA inverters:
The maximum power output of the fixed Trina panels is only 0.8 kilowatts:
These solar panels were installed in 2009, which averages around 3 years earlier than the panels in the 1st group, so they’ve had extra time to degrade. Also, as their inverter is also older it could be less efficient.3 So while this is not a great result for Trina, I don’t expect Trina panels to perform any worse than similar priced tier one solar panels.
The maximum output for the identical panels and the dual axis tracker was only 0.71 kilowatts of power per kilowatt of panel capacity. This could mean the tracker isn’t working properly or it may indicate being installed in a tracker results in greater deterioration. Looking at the output of systems with trackers I see there is considerable variation in their maximum output, so I don’t think anything can be concluded from this.
SunPower On Top
SunPower was clearly the best performer in its group and as the Tindo panels had microinverters I think it’s likely they outperformed them, despite being 5 years older. Winaico and QCELLS did very well and I would guess the Tindo panels would have performed around the same if they had also used an SMA inverter.
Canadian and CSUN didn’t perform as well, but they are lower cost panels and with solar panels price usually indicates quality.4
To me it’s clear if you want the best results possible you need to pay for a premium panel. In a typical location you can probably expect the best solar panels to provide at least 6% more energy overall than the lowest cost tier one5 panels, so it’s definitely worth paying a premium for them. It’s just a matter of if the premium they are asking for is actually worth it to you.
For those on a budget or simply interested in cost effectiveness, the performance of the Trina, Canadian, and CSUN solar panels indicate you can buy cheaper but still reliable panels and expect to get decent performance from them after many years.
Footnotes
- It is often stated that panels should be tilted at an angle equal the the longitude of a location, which is how many degrees it is from the equator. This isn’t quite correct, but it’s close enough to make very little difference. ↩
- “Bloody cat! Goddamn felines! Christ, this cheese is stale!” ↩
- While inverters show little decline in efficiency with use, in general newer inverters have higher efficiency than older models. ↩
- Just watch out for con artists who try to convince you that el cheapo panels were pooped out of god’s arse. ↩
- Tier one panels are considered reliable enough by large financial organizations that they will loan money to solar projects that use them. It’s not a direct indicator of quality, but it is good evidence the panels are reliable. ↩
 RSS - Posts


Few things to realise here.
1. Enphase measures at the panel, more appropriate would be to measure AC output after losses at a similar location to the string inverters.
2. Panels are golden panels supplied by manufacturer and not those bought on the market, the same size is also low
3. When I visited, it was possible for obstructions or other parts of the facility to shade some panels, when panels on other arrays remained unshaded
4. Humidity is a major cause of failures and humidity is very low at DKC.
Hi Thomas yes some/most are golden panels selected by manufacturers but the Winaico ones I believe were taken from warehouse stock in Australia I’m pretty sure
The DKASC website states clearly that modules aren’t shaded between 8.30am to 4.30pm (noting also that Alice’s solar noon is around 12.30pm). I’ve been onsite several times, including recently, and would have no reason to be concerned about shading. Tree management is also part of the regular O&M/upkeep regime.
You can’t really trust these figures with no consistency of the invertors or installation you really can’t make a very good compariso. What about the total kWh generated over the day? That could show a greater difference in the performance of the panels than just peak power.
> It is often stated that panels should be tilted at an angle equal the the longitude of a location, which is how many degrees it is from the equator
I think you mean latitude? 🙂
At the last minute (the slab is going in), I’m doing a variation on the plans to modify the roof for a 3 kW west-facing array at 40 degrees to catch late sun to power the aircon on hot afternoons. (That’s as steep as the Sunlock clips are rated for.)
The remaining north-facing 4 kW array will now also be tilted at 40 degrees, instead of the currently drawn 30. The former is 2 degrees steeper than latitude. That’ll optimise winter generation, which is more important than summer, as insolation is less than half.
There’s room for more north-facing – maybe should put 6 kW there, for 3 kW in winter. (And more than nothing in mild overcast.)
Any experience on whether that’s as optimal as I figure? (The revised plans are off to the truss manufacturer for a quote on Monday. If they can build it as drawn, then off to the building surveyor for approval of the variation.)
There’s a ‘NOTE’ section (linked below) on the Desert knowledge web site that highlights any solar component and system problems that occur on site in the field over time. It names manufacturers experiencing problems in the field highlighting issues such as hot spots, EVA discolouring, right through to manufacturers replacing entire solar PV sites out for new ones…..hmmm. Unless your diving into the entire data pool you’ll miss the hidden detail. I think it worth a PHD study to analyis historic normalised kWh data of fixed arrays, since some PV sights are dated back to 2008, so over 10 years of Australian field data there.
http://dkasolarcentre.com.au/historical-data/notes-on-the-data
It seems odd that we have a facility to test solar panels and spend tax payer dollars on it and it is not being run scientifically. How the hell can you draw any conclusions from this? Even Ronald seems confused! In the article he says we can’t be sure the Trina panels are better because they are using microinverters.
It’s hard enough to compare solar panels, without changing the inverters and even the type of inverters, the way they’re mounted, how they’re sourced and when they are installed.
The scientific value of this seems nil. I guess the only thing you could draw is if the provide data over time so you can look at panel degradation and failure rates of both panels and inverters / micro-inverters. Do we have that data? Is it part of their annual report? It appears from their website their sole role is to provide data for others to evaluate. They do have notes like this is one:
Site 2: Module Replacement and Troubleshooting
The large tracking array (site 2) was disconnected between 7.30am and 4.30pm for the replacement of a broken PV module with an equivalent ECSOLAR mono-Si ECS-170D model (connected to inverter 1), as well as general cable tidying and string and inverter troubleshooting. Fuses were rewired and the strings checked with a no fault determination, but inverters 2 and 3 remain non-operational. Note this array is currently non-tracking and fixed facing upwards.
So they replaced a broken PV module. How was it broken? I’m assuming these are micro inverters as they also note 2 and 3 remain non-operational.
Can anyone tell me what the value of this study is if they don’t analyse the data themselves?
Mondo, a correction if I may: ‘spend tax payer dollars’ is inaccurate as the project was only government-funded for its first three years of operation (2008-2010). Since then, it’s been a completely self-sustaining initiative, and technology proponents are able to install new modules whose data they can use for their own testing and benchmarking, feeding back into product development. The same goes for private research labs which have used parts of the site for their own testing.
Indeed, it’s up to the data users (which range from science, academia, industry, etc.) to conduct their own studies and define any research agenda (not inherent to the DKASC itself) noting the conditions disclosed transparently on the website.
There are a good deal of reputable studies that have in some way used or been supported by DKASC data. The data is used by the local and international PV and research community.Responsibility lies with the analyst, which has always been an emphasis of the DKASC project and is very much the spirit of an open-access data portal like this.
G’day Finn, good working of the numbers, here’s some more, solar power, is 1/200th of the price it was in the 1970’s, so in 2030, if the trend continues, the Swanson graph, Tony Seba’s Clean Disruption. Then it’ll be an eighth of the current price per kWh, per hectare, if we use solar power, for 1/20th of our power. If 1/4 of our deserts can produce 1,250 times as much power in total as we currently consume, then that’s 25,000 times as much as we currently produce.
Like the Pilbara solar farm, for export to Indonesia, via high voltage direct current power cable, currently envisaged at $20 billion, 20 GW or so, why so much more power from solar than now. For starters, we have Continent sized desert, then we have a very small population, for a continent, only 25 million, whereas, India has a population of a billion, with 1/10th of the desert surface area. 400 times less desert solar potential, per capita, than the Australian figure, solar power production, has been growing at an exponential rate, always much more in the long term, than predicted.
Think of oil drilling in the 1915-25 period, high speed railways in China in the last dozen years, the expansion of unconventional hydrocarbons in the United States. Liquid natural gas production in the last 15 years, China has a million workers in solar power production already, there are millions of electric vehicles, the total vehicle population in the world, will be largely replaced, with electric vehicles and doubled, in the next decade or so. Hydrogen is only 30% more expensive than natural gas, per kWh and its major input cost, is electricity, it makes an excellent aviation fuel, as liquid hydrogen, tremendous kWh per tonne.
With China, expanding high speed railways, in the world, via Belt Road, huge capital formation, through cheap solar, cheaper transportation through electric vehicles, high speed railways, liquid hydrogen aviation. Cheaper food, from high rise agriculture, disposable income will increase, taxation revenues will also increase. Rough figures 100 trillion dollars in energy, 100 trillion dollars in transportation, 100 trillion dollars in high rise agriculture, a multiplier effect, in the rest of the economy, of 700 trillion dollars. That’s a quadrillion dollars in the next decade, enough for a lot of 3D printed buildings, LH2 aircraft, high speed railways, electric vehicles.
We’ll see ground scrapers, for high rise agriculture, like the new apple building, hundreds of thousands of them, the capital, will allow a Himalayas tunnel bridge line, Bearing Straits bridge tunnel. A progression, from the likes of the Gothard Swiss Alps tunnel and the Anglo French Chunnel, as we reach market saturation in the 2030’s, at 25 times our current consumption of energy. A Grand Depression will set in, necessitating the introduction of the basic minimum income, like the introduction of the unemployment benefit, in the 1930’s. As well as public works programs, for instance ultra high speed railways, vacuum tunnel magnetic levitation railway tunnel networks, in China and the Belt Road.
Japan has already begun construction, of a magnetic levitation railway tunnel network, with solar power capital, governments will go from $60 trillion deficits to $60 trillion surpluses, even with greatly increased spending. These effects, will accelerate the Japanese magnetic levitation railway tunnel network construction, to make it complete by 2030, goading the Chinese into a domestic and Belt Road magnetic levitation railway tunnel upgrade.
Just speculating, predicting the future, is like predicting the weather there are too many variables, but the second industrial revolution, in the developed world in the 1920’s and from the end of the Cold War, in the developing world, shows its possible.
I can understand the viewpoint, but when I read the background info on the site I get the impression that the project,s objectives might be more about culture and integration, and less about rigidly testing panels using rigorous scientific method.
It may be that they’ve chosen to test and display systems that are readily available locally.
If the ultimate plan is to promote awareness and deployment of sustainable technology, any testing program or long term performance tracking might be secondary.
(This was meant to be a reply to Mondo’s note above)
Thanks Scott. That’s an acceptable POV (promoting solar). I’m not really sure about cultural acceptance – I think that’s a stretch. They’re solar panels, not some radical new technology. They are already widely accepted in Australia. I would love to see a more rigorous scientific study because real world data on solar panels is difficult to assess because of variables like installation quality, shading etc. and here they have a perfect chance to do it.
It would be a lot easier to reduce our atmospheric pollution if we lived more sustainable and reduced our consumption. The population of many European Countries consume less than 1/2 the energy we, Australians and the other bad polluters of North-America use per capita.
Hi Ronald
How would you rate Solar Edge Smart Panel marketed by SAE?
Hi Stephen
SolarEdge don’t make their own panels and instead rebrand panels made by other companies. SolarEdge panels could be rebranded QCELLS but they could also be made by another manufacturer. If you want to know who made them the best thing would be to ask SAE. I suppose you could try to match up their physical appearance with a manufacturer, but I think it would be a lot easier just to ask.