
Those nice people at DNV-GL have done another year’s worth of panel torture testing. Here is a summary of the results.
Over the past 4 years the Norwegian company, DNV-GL, has performed annual tests on solar panels and released a report on their performance. Their latest one, the 2018 PV Module Reliability Scorecard is now available. The good news is solar panel reliability looks as though it is continuing to improve. If you buy now you are more likely than ever to get panels that will last for decades without failing and with only minimal deterioration in output.
But note DNV-GL don’t test every panel in the world. Only ones they are paid to and makers of el cheapo1 panels aren’t likely to shell out to have theirs assessed. So the improved quality may only apply to better manufacturers such as those that are tier one or otherwise have good reputations.
If you like, you can read what I wrote about last year’s report or the year before that. But keep reading this article and I’ll tell you about the 4 tests used for their latest scorecard report and which panels earned DNV-GL’s “top performer” status for each. I’ll also let you know which 3 panels suitable for rooftop solar installation passed all their tests this year2. I’ll also point out that just because a panel isn’t a top performer doesn’t mean it’s not good quality. This is because DNV-GL doesn’t tell us whose solar panels were submitted for testing or which ones failed. They only tell us about those that did well. While this a very positive and upbeat approach it does mean their scorecards aren’t as useful as they could be. I suspect you may have to be a paying customer to get all the dirt. But only knowing which panels did well is still useful information and I’m very thankful it’s freely provided.
DNV-GL Is All About Standards
DNV-GL is a standards organization. By this I don’t mean they won’t let you put your elbows on the dinner table or scratch your head with a fork. The kind of standards I’m referring to are certifications that show a company’s products meets certain standards. While they don’t certify everything, they can help you out with a wide range of items ranging from mining and oil extraction equipment to solar panels.
If you want a piece of paper that says your solar panel meets the minimum standards required to be sold in a sensible country, DNV-GL can help you out. And if you want to see if you have a quality solar panel that a home or business can confidently buy without worrying about it failing or suffering more than mild deterioration, then you can subject it to the kick-arse testing DNV-GL uses for its scorecard reports.
They Only Give The Winners — Not Losers Or No Shows
DNV-GL’s Scorecard only gives the names of what they call “top performers”. These are the solar panels that suffer no more than 2% deterioration in output after testing. And it’s “pass or fail”. They don’t tell us which of their top performers did the best.
I find this unfortunate. Maybe it doesn’t say much for human nature, but the gossip we regard as the juiciest and are most eager to hear is usually about miserable failure rather than excellent performance. So it’s a bit of a bummer we don’t get to learn about the solar panels that crash and burn. After all, it would be good to know what to avoid.
We’re also not told if a particular panel that isn’t among the top performers was tested or not. So when we look at their top performers we can only know that those panels did well in the test, but we can’t conclude anything about panels that aren’t top performers because we have no way of knowing they were actually tested.
Bills Of Materials Are Important
DNV-GL doesn’t just test one solar panel and base their conclusions on that. They test multiple panels and average the results. This is important because panels that appear identical and have the same model number can have considerable differences in durability. Some of the variation is because there is always some imprecision in manufacturing, but it mostly results from using materials of varying quality. The exact list of specific components used to make a solar panel is called its Bill Of Materials or BOM. Just one small alteration to its BOM can make a panel’s performance go from fine to awful.
The illustration below is an example DNV-GL gives that shows how a single change in the glue that holds solar panels together3 can make a huge difference in performance on their Potential Induced Degradation or PID test.:
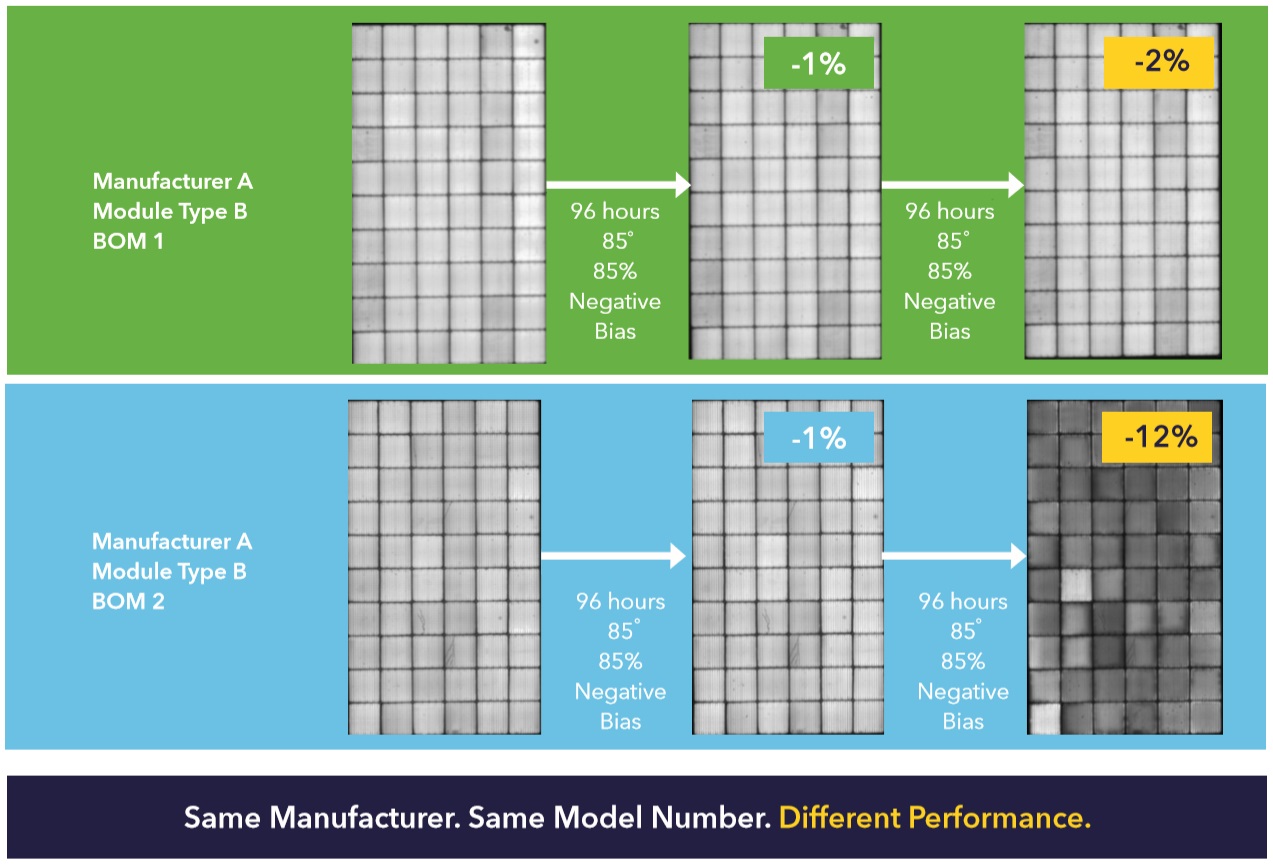
Image: DNV-GL
While both solar panels suffer very little harm after the first 96 hours of testing, the one with the high quality glue is still doing well after an additional 96 hours while the one with lower quality glue has suffered six times the deterioration.
Homeowners Can’t Do Much About BOMs
Unfortunately, if you are looking for solar panels for your home there is not much you can realistically do about Bills Of Materials. But solar installers and wholesalers can check whether they are getting the good stuff or if manufacturers are unloading their worst panels on we poor, trusting, innocent Australians.
But average Australians can protect themselves by making sure their solar panels are tier one or from a manufacturer with a good reputation for quality. While this won’t guarantee getting panels with the best BOMs it does help as these companies generally want to build up a good reputation and hopefully are aware of Australia’s consumer protection laws and don’t want to fall afoul of them.
The Four Tests
This year DNV-GL gave solar panels 4 different tough tests for their scorecard report. They are listed in the table below4:
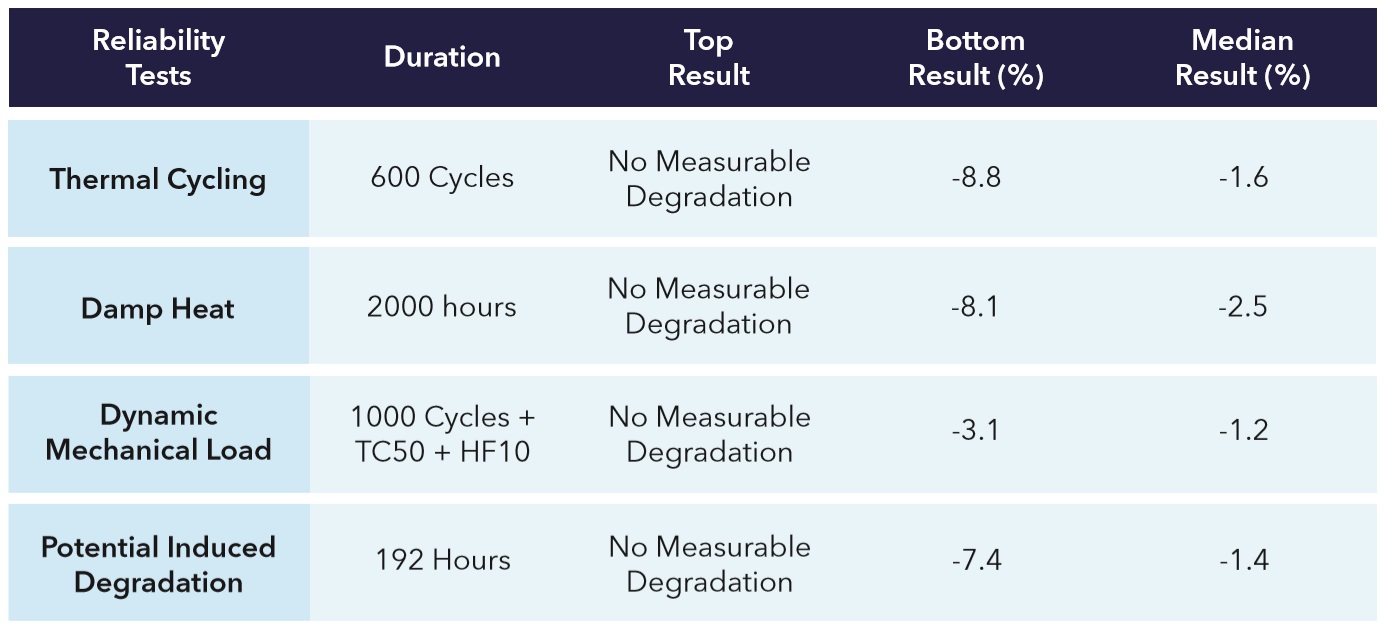
Image: DNV-GL
The very best solar panel or panels in each test suffered no detectable deterioration at all, while those declining in output by 2% or less were called a top performer by DNV-GL. For each of the tests the majority of panels submitted were rated as top performers. While this doesn’t make it seem like a very exclusive group it is still a good result as the tests are rigorous and I regard it as good evidence that solar panel quality is improving, even if it’s not possible to conclude that for certain from the report.
In general, the bottom results are less bottomy than in previous years. But while it is difficult to make a panel durable enough so it only suffers 2% or less deterioration after tough testing, it is actually very easy to simply not submit a crap panel for testing, so there is no good evidence that buying cheap panels with zero reputation is any less of a bad idea than it was a year ago.
Thermal Cycling
Stuff expands when it gets hot and contracts when it gets cold. Because different materials do this at different rates it places joins between them under stress, which can slowly degrade a panel’s performance. One effect is the weakening of solder joints between electrical connections that increases resistance5. This can result in a panel operating normally under low light conditions, but under good conditions maximum output will be reduced.
In the outback, a solar panel can hit 65 degrees on a hot day and drop down to 15 degrees at night making for 50 degree temperature change over 24 hours. Daily temperature swings aren’t so extreme near the coast, so a good result on this test is more important inland.
The test involves cooling a panel down to negative 40 degrees and then heating it to 85 degrees. While the temperature is increased it receives the maximum current it is rated for. This is done 600 times. And if you think that sounds tough, next year DNV-GL will crank it all the way up to 11, which in Norwegian means 800 times.
All the solar panels that suffered 2% or less reduction in output were classed as top performers and are displayed in the table below. The xxx in the model designations represents a panel’s wattage. Because this figure can vary a triple x is given instead of a number. Note not all the panels may be available in Australia6:
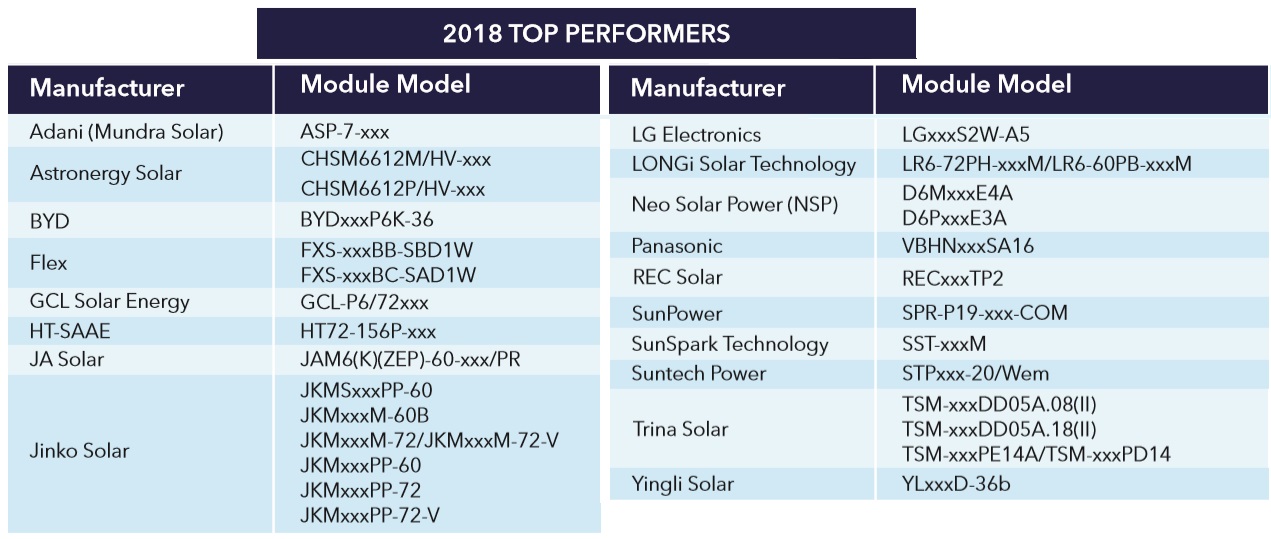
Image: DNV-GL
A total of 44 different solar panels were tested and 8 of them were awesome and suffered no measurable decline in output, while a total of 34 passed. The number of panels in the chart above seem to match up with these figures, but it’s difficult to tell, as sometimes they put more than one panel on a line.
With 77% of the panels passing and becoming top performers it’s not surprising they are planning to make the test tougher next year. They’re definitely not complacent in Oslo or sitting on their laurels in Bergen7.
The Damp Heat Test
The second test was damp heat. Passing this is important for solar panels installed in places where it’s hot and sticky. Heat and humidity can damage panels and even cause the glue that holds them together to become unstuck. This can result in poorly made panels literally falling apart.
The test is done by putting the test subjects in a chamber where they are held at 85 degrees and 85% humidity for 2,000 hours. This was done to 52 different solar panels and 27 passed and became top performers with less than 2% decline in output:
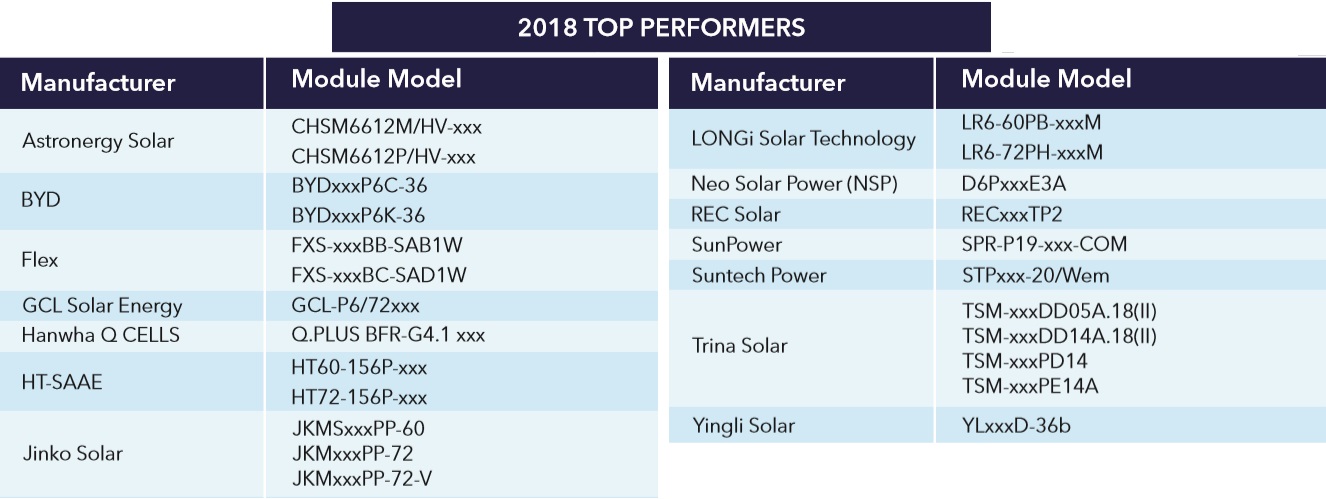
Image: DNV-GL
Only a single panel was awesome enough to suffer no measurable deterioration, but out of the 52 were tested 52% did well and passed. The worst performing panel had its output fall by a little over 8% which is not so bad considering that in previous years they had solar panels deteriorate by over 50%.
Dynamic Mechanical Load Test
Wind and — in places that mostly aren’t in Australia — snow can stress panels. A stiff wind can cause them to continuously flex and gradually deteriorate. The dynamic mechanical load test simulates this by flexing a solar panel 1,000 times and then subjecting it to 50 thermal cycles as in the thermal cycling test. After that they put it in humid air and freeze it 30 times to allow ice to form in any cracks that may have formed and further damage the panel. This is 20 freeze cycles more than in previous years.
After all this punishment, out of the 51 panels that were tested, 5 were awesome and had no noticeable deterioration while a total of 42 were top performers with less than 2% decline in output:
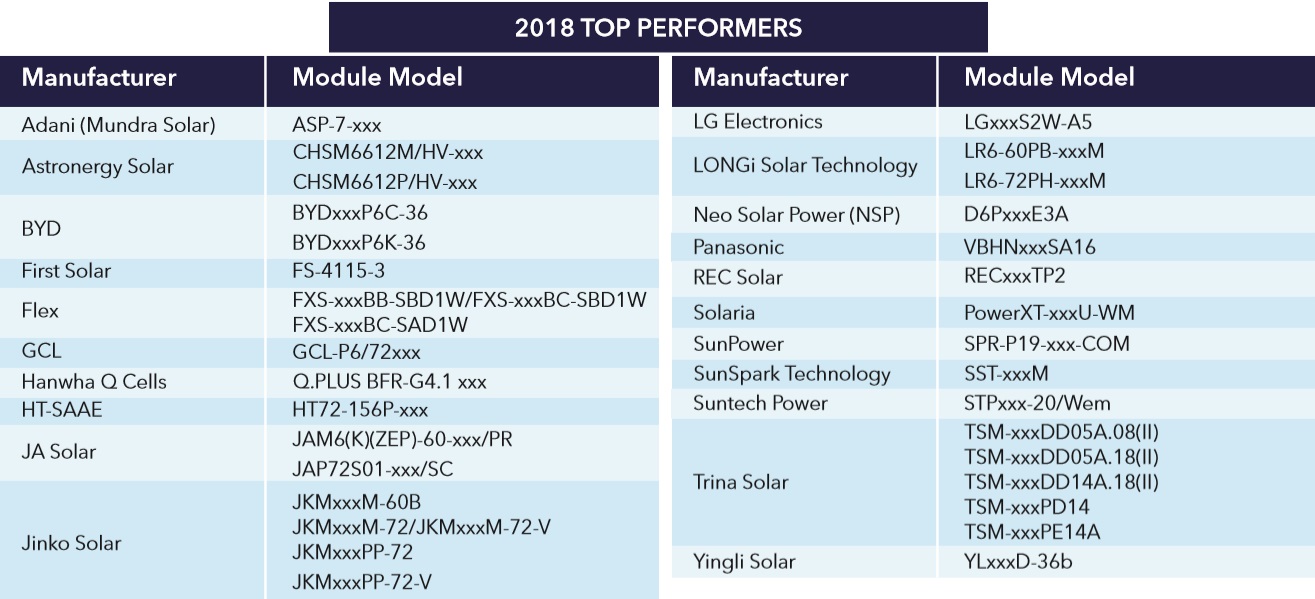
Image: DNV-GL
No Humidity Freeze Test
The humidity freeze test simulates damage caused by temperatures falling below freezing in damp conditions, but DNV-GL skipped it this year. I don’t know why. Maybe there wasn’t room in their freezer because they’d smuggled too many Swedish meatballs across the border. More likely they thought the results of the dynamic mechanical load were similar enough, particularly after increasing the freeze cycles from 10 to 30. The good news is this was the least relevant test for Australians. If frosty damp was an Olympic sport we wouldn’t even qualify.
The PID Test
Potential Induced Degradation, or PID for short, is a type of damage caused to solar panels by stray currents going where they are not supposed to, which is very naughty of them. It can result in marks on solar panels that resemble snail trails and in severe cases cause panels to completely fail. The effect is worse in warm climates with high humidity, so being resistant to this type of damage is very important in the tropics.
The solar panel is placed under conditions similar to the damp heat test for two sessions that total 192 hours, while 1,000 volts are passed through most panels or 1,500 volts for larger 72 cell panels. Out of the 46 solar panels tested, 5 were awesome with no measurable deterioration while 27 were top performers with 2% or less decrease in output:
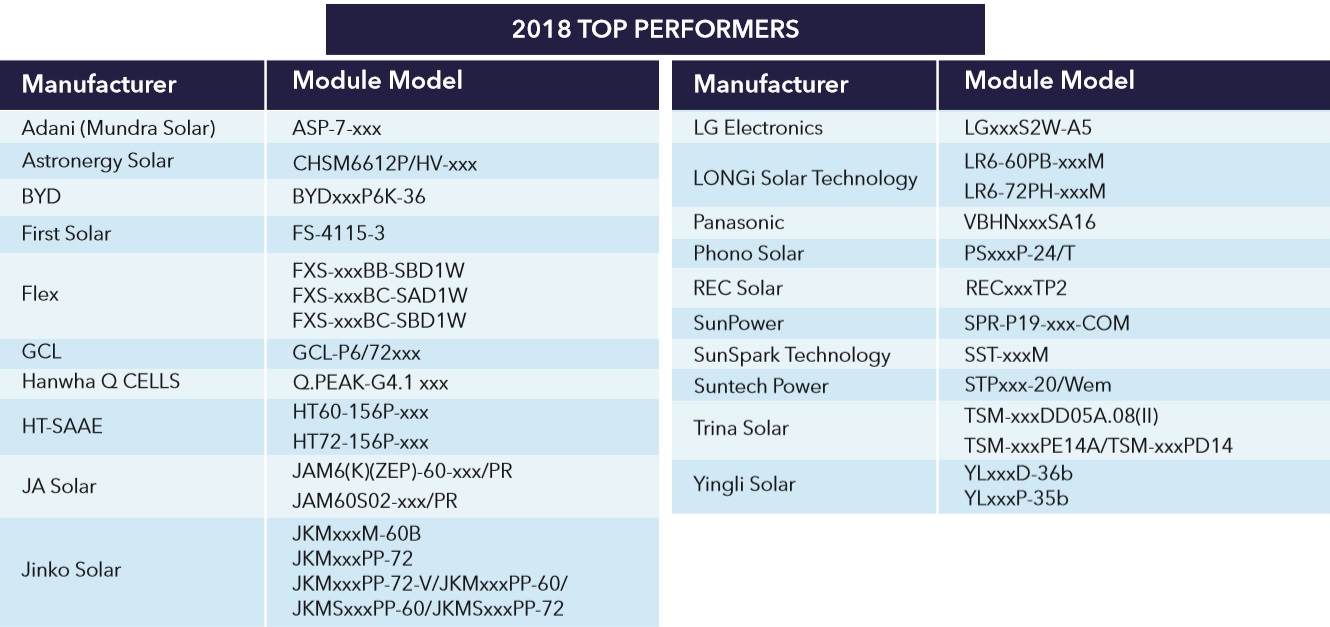
Image: DNV-GL
Only 3 Residential Panels Passed All 4 Tests
There were a total of 12 manufacturers that had one solar panel model pass all 4 tests:
But most of these panels were larger, 72 cell, higher voltage panels that are usually only suitable for large scale commercial or solar farm use. If we only look at panels suitable for normal residential installation in Australia then only 3 manufacturers have a solar panel that passed all the tests:
- Longi — LR6-60PB-xxxM
- REC — RECxxxTP2
- Suntech — STPxxx-20/Wem
So if you want a panel for your home that passed all 4 of of DNV-GL’s scorecard tests, your options are limited.
It is possible that Flex could join this small group, but I couldn’t find information on their panel to determine if it is suitable for residential use8.
Hysterical Historical Results
DNV-GL has put together a chart they call the historical scorecard. It shows every manufacturer that got a top performer status this year and gives their record in previous scorecard tests:
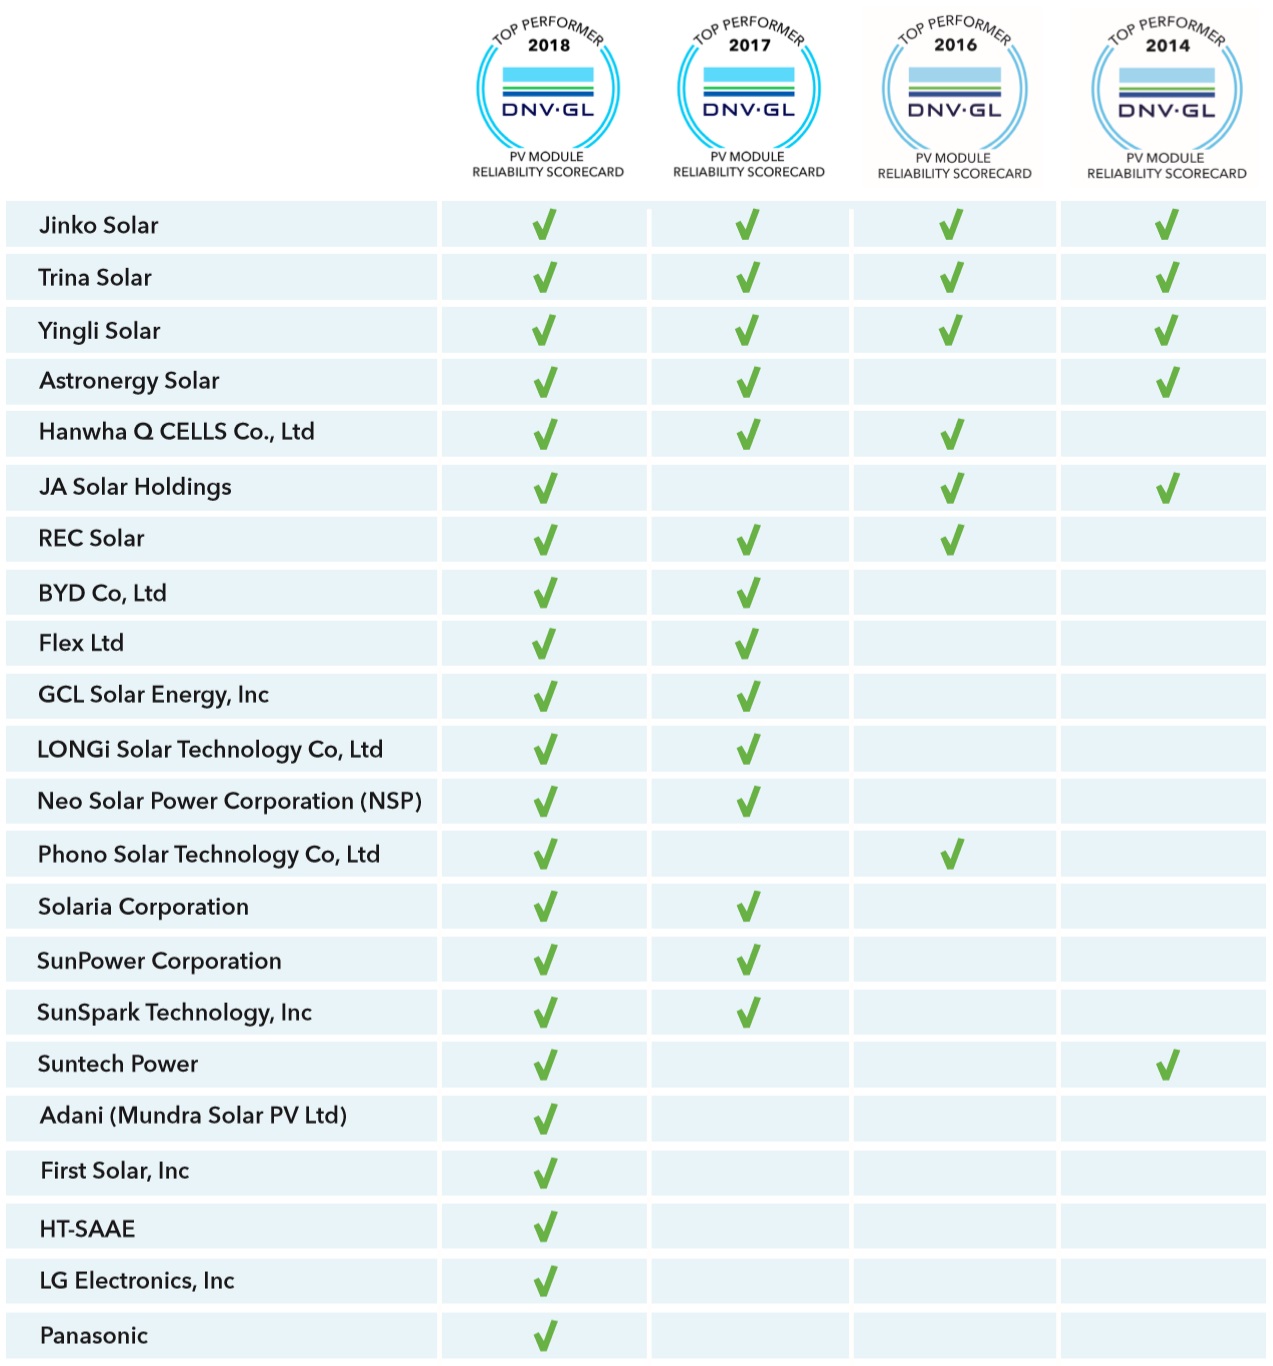
Image: DNV-GL
Unfortunately I consider this chart to be flawed:
- I am guessing that only one solar panel needed “top performer” status for a manufacturer to get a green tick, but we don’t know how many different panels a manufacturer submitted for testing or how many of the 4 tests they each received. Maybe a manufacturer that got 10 top performer results out of 10 tests gets the same green tick as a manufacturer with one top performer result out of 10 . We don’t know because we’re not told how it’s determined.
- We have no way of knowing if a manufacturer submitted any solar panels at all for testing in previous years so it’s not possible to conclude anything from the lack of a tick.
If I made this chart I’d try to make it clear that it was not possible to draw any firm conclusions if there is no green tick. Maybe I’d do something like this:
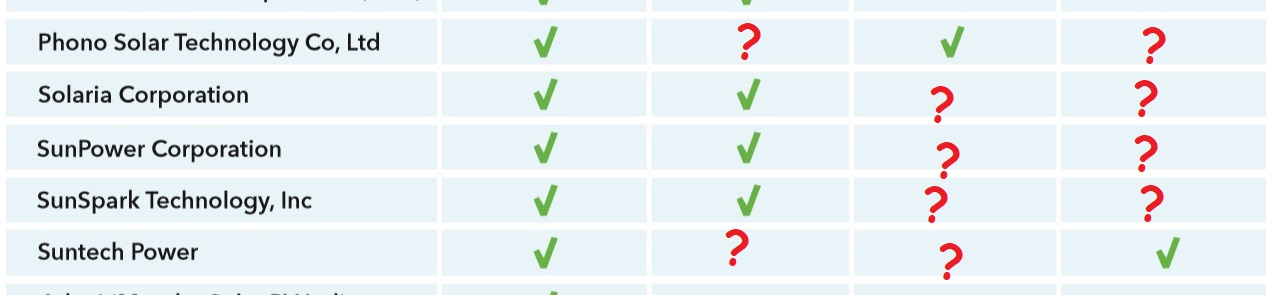
Doesn’t that look better?
Factory Location Of Top Performers
DNV-GL’s map of where the top performer solar panels were made shows it is the manufacturer that matters and not the region they’re located in:
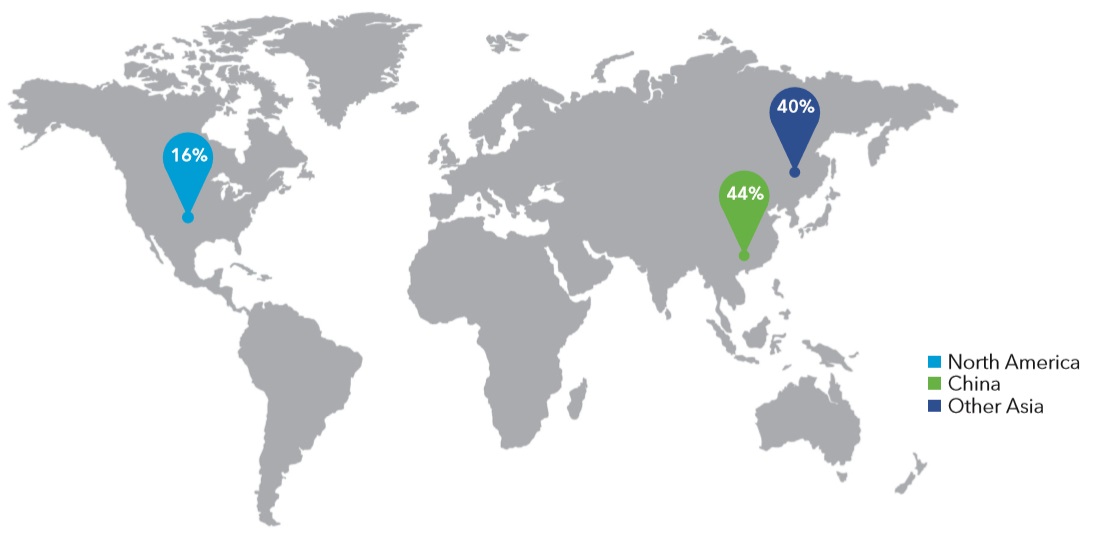
Image: DNV-GL
While China has plenty of small scale panel manufacturers whose output is of dubious quality, the majority of DNV-GL’s top performers were made there. So saying Chinese solar panels in general are no good just because some are crap makes as much sense as saying koalas aren’t cute just because Australia’s drop bears will claw your face off.
A total of 44% of this year’s top performers were made in China while 40% were made in other Asian countries. But for for some strange reason DNV-GL decided to place the percentage for other Asian countries in China. They stuck it right in Heilongjiang Province. They almost hit Siberia, but that would have been strange in of itself. Maybe those Harbin ice sculptures in Heilongjiang are just so good the other manufacturers simply couldn’t stay away?
Not Being A Top Performer Doesn’t Mean Much
If a panel is a top performer in DNV-GL’s scorecard, that’s great. The tests are rigorous so it’s a genuine indicator of quality. If you are getting rooftop solar in Darwin and are worried about Potential Induced Degradation on account of the heat and humidity, then using any of the panel models that got a top performer result in the PID test means you will be very unlikely to have any problems with it9. So knowing whether or not a solar panel is a top performer in that area is definitely useful information. But if a panel doesn’t have top performer status there’s not a lot you can conclude. Sure, maybe the panel was submitted for testing and failed miserably but maybe its manufacturer never paid to have it tested in the first place. It’s not possible to know. Not without squeezing more information out of DNV-GL and, while they are kind enough to provide their scorecard reports for free, I suspect you’ll have to pay them for such detailed information. I suppose something has to pay for all those Teslas.
Footnotes
- Is it okay to use the phrase “el cheapo” or is that languageist? ↩
- Although the headline may contain a clue ↩
- This glue is an epoxy and when used in solar panels to hold them together its called the encapsulant. ↩
- Unfortunately, there is an error on the table and for the Dynamic Mechanical Load test its duration should be “1000 Cycles + TC50 + HF30” not “HF10”. Alternatively, it could be “HF10 x 3”. (TC stands for Thermal Cycling and HF for Humidity Freeze.) ↩
- I know all about resistance. My grandfather was in it during World War 2. You could say he fought on the Ohmfront. ↩
- If you want to check out the details of commonly sold panels in Australia our panel comparison chart would have to be the best place to start. ↩
- I once shared a sauna with an attractive blonde Norwegian woman in Bergen. It turned out that what they say about Norwegians is true. They are really boring to talk to. ↩
- The lack of information made me think Flex don’t want me to know about them. I hope they realize that once they stamp their company name on them there is no need to keep quiet about who manufactured them. ↩
- Unless your BOM is nasty. ↩
 RSS - Posts


You’re right about the Teslas. We were recently in Trondheim. On a 30 minute walk we counted 22 Teslas.
It’s pretty impressive considering they are Europe’s larger oil producer. It’s almost as if Norwegians are somehow capable of planning ahead.
When I did my research regarding what PVC to have installed back in 2009 I chose SunTech and they still pump out very close to their original wattage.
Can’t complain shame the company went a big shakey later on.
Interesting – I had SunTech panels installed in 2011 and I have seen a gradual year-on-year decline. My 2017 output was 89% of my 2012 output. I can’t be 100% certain that the panels are the problem, but surely they are the main components known to degrade over time.
I had a double whammy, though, in that the installer went bust and so did SunTech. I don’t know if new SunTech still honours the performance warranty set in place by old SunTech.
I guess it’s possible that there were some changes in manufacturing specs between 2009 and 2011, that would fit with some of the points in the article above?