
Most solar owners judge their system by a simple measure: how much energy it produces over the day. If the total looks good, it was a good day. If it’s down, something must be wrong — but that’s not always the full story.
To understand why, it helps to look at how solar output actually behaves in real time — something solar forecasters track closely.
Why Does Solar Output Fluctuate So Much?
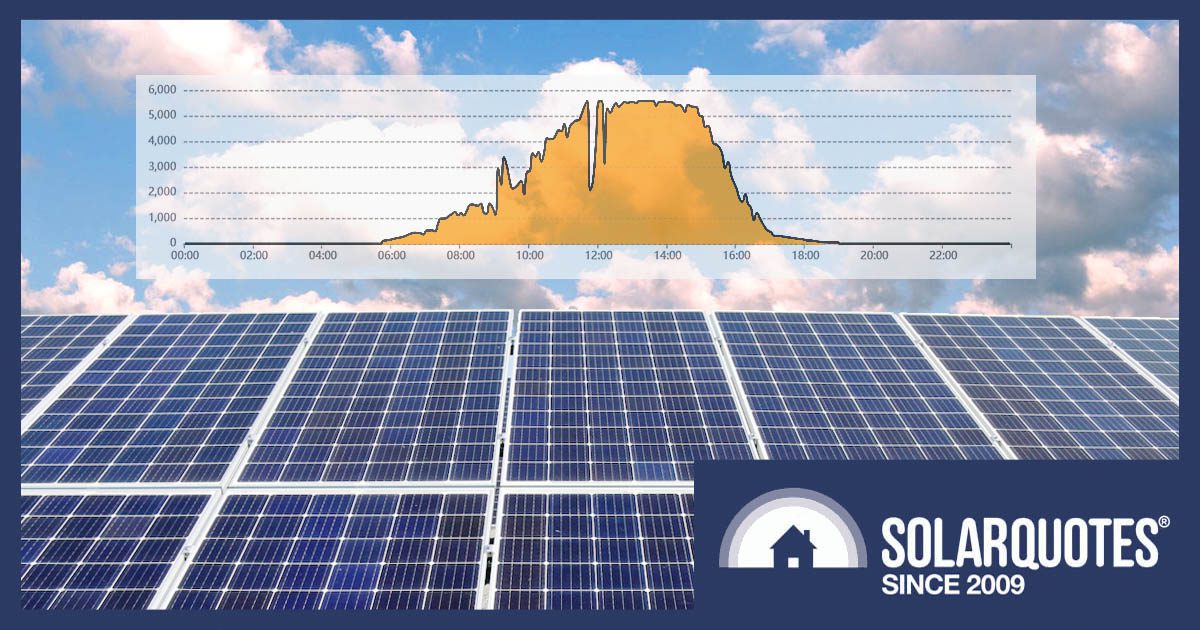
If you’ve ever checked your monitoring app and wondered why your solar output jumps up and down on an otherwise decent day, you’re seeing something quite normal — output can rise and fall sharply along the way, with dips and recoveries that don’t always follow a smooth pattern.
Solar output rarely moves in a smooth line, even on stable days. Those fluctuations are easy to see in the output graph, just not in the way most people interpret performance.
Solar output on a typical “good” day can still include short, sharp dips — even when overall generation remains strong.
Daily Totals Vs Real-Time Solar Behaviour
Time of day and season are the predictable part of solar irradiance. What changes in real time is how that signal is shaped by the atmosphere, particularly cloud cover.
That variability is what solar forecasting systems are designed to model. Companies like Solstice AI and Solcast use that modelling to track how output changes minute by minute, rather than just what the total looks like at the end of the day.
This is why forecasting systems focus on questions like what happens at 10:17am when a cloud passes, how quickly output drops and recovers, and how accurate a five-minute-ahead forecast really is.
Forecasters use this information for real-time grid and market decisions. At household level, the same output fluctuations show up in smaller but still meaningful ways — especially around when energy is used, stored, or drawn from the grid.
The Cloud Problem Behind Solar Variability
“Forecasting the output of rooftop solar PV systems is inherently complex, as it depends on both atmospheric conditions and site-specific factors,” Dr Julian de Hoog of Solstice AI says.
The challenge starts with estimating how much solar irradiance reaches a given location. While time of day and season are predictable, cloud behaviour drives most of the uncertainty in short-term forecasting.
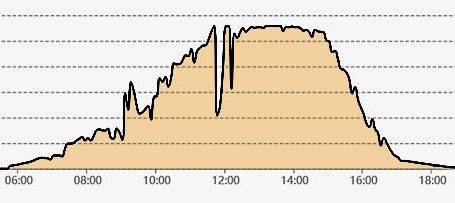
Days with uniform conditions — either clear sky or full cloud cover — are easier to predict. Intermittent cloud, especially small, fast-moving “spot clouds”, is much harder. These can be too small to be resolved in satellite imagery, yet still cause sharp fluctuations in solar generation.
Passing cloud cover can cause short, sharp changes in solar output, even when conditions appear stable.
At this time of year, additional factors can make forecasting more difficult. In northern Australia, convective cloud formation can remain active into autumn, with clouds developing rapidly and with little warning. In southern regions, morning fog becomes more common and can reduce predictability in the early part of the day.
From a forecasting perspective, this makes short-term output difficult to predict, while at household level it can still look like a fairly normal solar day.
When Timing Starts To Matter At Home
Until recently, short-term changes in solar output haven’t mattered much for most households. If the daily total was strong, brief dips during the day weren’t especially important.
But that is starting to change as more homes use solar in real time rather than just as a bill offset. Falling feed-in tariffs, along with the rise of electric vehicles, batteries, and time-of-use pricing, are shifting attention from exporting energy to using it as it’s generated.
Charging EVs during the day, running appliances directly from solar, storing excess in batteries, and avoiding grid imports during peak pricing all make timing more important than it used to be.
In some cases, such as demand-based tariffs, a short spike in grid usage during a dip in solar output can have a much bigger impact on costs than you might expect, because charges are based on peak demand rather than total energy.
A passing cloud might barely change the daily total, but it can still cause output to drop at exactly the wrong moment — triggering grid imports when they weren’t expected.
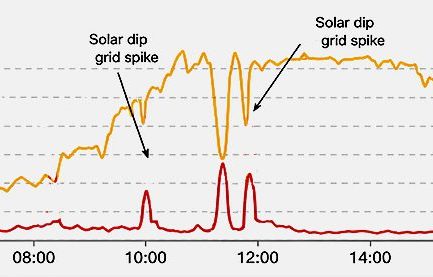
A brief drop in solar output can trigger an immediate rise in grid usage.
Should Solar Owners Think Like Forecasters?
Not really — but understanding the difference between real-time changes and daily totals helps.
Forecasters focus on accuracy over time because their outputs feed into grid operations and market decisions at scale. Solar owners focus on outcomes across a day, where small fluctuations usually don’t have much financial impact.
But as more households rely on solar in real time, that gap is narrowing. Because once you start using solar as it happens rather than just what it produces by sunset, short-term changes start to matter more.
Timing Matters
The point isn’t choosing between daily totals and real-time behaviour — it’s understanding both. For most households, the daily total will still be the headline number. That hasn’t changed.
As appliances, batteries, and electric vehicles become more closely tied to when solar energy is available, short-term fluctuations start to matter in practical ways they didn’t before.
That doesn’t mean tracking every dip or watching every cloud. It just means having a rough sense of when your solar is performing well — and aligning major energy use with those periods where you can. Adding a home battery storage system can also help to ensure you can ride out those short-term dips without drawing from the grid.
For a deeper breakdown of how solar output, power, and energy fit together, our guide on energy vs power (kW vs kWh) is a good place to start.
 RSS - Posts


This topic introduces an interesting question on the number of cycles a battery system is warranted for/ expected to to be capable of.
What constitutes a cycle?
My battery goes up and down more than once a day in response to load and sunlight supply.
As I am with Amber, I am also able to import and export more than the total battery capability in response to variable wholesale pricing.
While the total up and down is currently less than a full charge/discharge, how is this read by the battery. Does it count as more than 1 cycle per day?
An article on this topic would be enlightening.
Don,
My 46 kWh DIY LFP battery comprises three banks, each with its own BMS. In two years, i.e. at least a thousand partial cycles, the individual BMSs today report 117, 61, and 98 cycles respectively. That demonstrates three things: The battery is a little bit oversized for one occupant, the discharge characteristics of the banks are not ideally matched (internal goop variation, or wiring resistance variation? Lengths are matched.), and the BMSs just “Coulomb count”, dividing Amp-hours drawn by battery capacity, to determine cycles. The merit of that is reflected in battery warranties commonly talking of total lifecycle MWh (for 85% SoH) in the fine print.
My battery spends its entire life above 70% SoC, much of it above 90%. It’s a good thing that LFP is more immune to the stress of continuously high SoC.
Being amply sized, even at nominal end of life, the residual 85% capacity will be more than I need, so just keep trucking, I figure. And more BEVs = more panels, not batteries
My AC connected solar battery mostly looks after any dips in solar or a spike in my power use. Low solar through much of the day means the battery sometimes only gets part charged.
One of the issues with a battery is that solar production surplus to consumption now charges the battery, which simply means the cost of the daily fixed fee is no longer offset by the value of kWh that would have been exported without a battery.
My battery is fully charged at about 11:00 am, with the surplus to household load being exported. From 11:00 am to 2:00 pm, my household consumption is about 3 kWh [no discharge from the battery fully supported by solar production].
So if I can arrange household consumption to be the no-tariff time slot [11:00 am to 2:00 pm], then my export would increase by 3 kWh during that period, with a value of $0.21 per day or $76.65 per annum.
Now without solar and a battery my annual cost of energy would be $3,600. So is chasing $100 worth the effort or complexity to make it work?
Then the question becomes: does your system’s functionality support a hybrid Time-of-Use (ToU) Tariff?
Anthony
If I used ToU my electricity bill would be less. I choose a flat rate tariff, for simplicity.
I have a small leaky house and run a couple of split phase air conditioning units near 24 hours per day for the year.
I have no control over the solar and battery set up, it is a case of set and forget. If the solar does not fill up the battery, when the battery gets flat the system starts importing power. Mostly the battery is powering the house at what would be the peak rate electricity tariff. For some 182 days a year, the most I would import would be less than 0.5kwh per day.
I have two energy monitors in the meter box, and the energy monitors are similar to Efergy E-Max energy monitors. One on the solar conductor and the other on house power conductor. I have the monitor displays in the kitchen, so I have a bit of an idea, how things are going.
I do have system monitoring, that gives recorded figures for the system
Fred,
I salute your pragmatic approach, which is unfortunately not supported by our bureaucratic building standards. When I built here around 5 years ago, NatHers required expensive double glazing and a pile of insulation. That off-grid solar could climate regulate the habitable areas with zero emissions or grid draw, using aircons as you do, did not count toward the 6 stars (now 7) required for approval of plans.
The lower (entirely solar) energy consumption does leave more for HWS, BEV, and currently 4 hrs of electric excavator work almost every day. But the high window cost competed with solar system size – all concentrated capital expenditure. Your way is cheaper up front, and savings can then be directed to making the house envelope less (thermally) leaky and/or solar upsizing for a BEV when the the fossil burner goes extinct. That suddenly brings more savings – sooner on your lower cost path.
Retrofit 2nd glass to old windows later, funds permitting?
Well, actually, domestic Solar isn’t set-and-forget.
As the owner, you become the operations manager for the system, and one of the requirements is to verify that the system continues to perform to specification.
I check the solar production and export data for an interval of choice produced by Enphase, FranklinWH and Ergon.
There are variances based on the data capture time interval [Ergon 15 mins, FranklinWH Battery 5 mins, Ergon Smart Meter is a bit of a mystery], rounding and other factors.
Another timing Elephant in the room is Daylight saving: Metering is performed on the East Coast in Eastern Standard Time: It is easy to get out of sync during Daylight Saving time. Do the Energy retailers use Eastern Standard? or adjusted time for Daylight saving?
Hi Doug,
I’m sure we have a recent article on that if you search the blog..?
Yah, and that’s why “solar surplus only” BEV charging is suboptimal when you have a house battery. It fails to charge the BEV at full whack during clouds. Setting BEV charging to max instead, so the battery fills the cloud shadows, tops up BEV faster, so you can hit the road with more range.
With a kWh into the BEV paying over $1 in fossil fuel savings, and battery wear being about 5.8c/kWH here, it’s nuts to fuss about a bit of energy shuffling.
In short:
“Fill the roof!” (Finn’s sound array sizing advice) Winter yield is ~ 1/3 of summer.
Tilt north & west panels up 40° (here at 38° S latitude) for extra winter & evening yield.
Go for at least a 30 kWh battery, if feasible, as the world goes electric, especially motoring. A free BEV top-up in overcast or at night is nifty.
Then switch off the HWS in more than one day of deep murky overcast. (Off-grid here, so the wood heater heat exchanger is the fallback.)
If on-grid, no worries – the grid is a cheap battery. (For now.)
Yep.
Started with PV-only and HPHW running 10am-1pm most days – self utilisation about 35-40% with PV producing about 60% of total consumption.
Added EV with smart charger to soak up exports. Lifted consumption 2MWhp.a. and self utilisation to 70% so solar now producing more like 50% of total consumption and reducing grid imports by 35%. Eliminating the oil-tax was the bigger benefit. (And the driving experience).
Finally, the economically justifiable home battery I’d been waiting for. Yay – 98% self consumption and the occasional profiteering like a gas-peaker.
Now I’m looking at the captive AEMC regulator about to wave through network charges designed to hit low consumption users much more for grid access while compensating heavy users. Not equitable. Network use has changed massively with redistribution and storage of energy on local networks a major factor totally ignored in AEMC & the networks’ “thinking”. AEMC needs to think about how this can be more equitably encouraged.
I don’t look at energy produced during the day, as my system is curtailed for at least 5 hours a day (maximum 5kW to the grid). Instead I look at the power imported from the grid number, and as long as it is under 0.5kWh for the day, that makes my day happy and tells me my system is doing it’s job!
The beauty of a decent sized battery is is nicely smooths out all those peaks and troughs from various appliances kicking in and out, cloud cover passing over, with no need for fancy timers or switches or monitoring systems – so you dont need to worry about watching your system like you are the neighbourhood curtain twitcher who lives across the road from a house of ill repute.
With the large systems most have today, I would imagine most systems will never get to see those graph shapes due to production being limited so the system only exports 5kWhr.
Limiting make daily total product less useful than it was when we all had 5kW systems.
For a typical single-phase home in Queensland (served by Ergon Energy or Energex):
You can generate more than 5 kW from your solar panels (e.g. a 6.6 kW system is common).
But you can only export up to 5 kW to the grid at any moment.
Anything above that is curtailed (limited) by your inverter.
So if:
Solar is producing 6.5 kW
Your house is using 1.0 kW
👉 Export = 5.5 kW → inverter trims it to 5.0 kW max
The extra 0.5 kW is effectively “lost” unless you use it in the home (or store it in a battery).
Seeing my post above makes me want an edit button available on these even more!
Yes exactly re the limiting, there is a large amount of potential production just lost. While this production is lost the neighbours are paying full regional pricing for their power and grid line voltages suggest it really would be ok for more to be fed into the grid. There are only a couple of systems on houses in the street.
We have always had a problem where generation does no co-incide with consumption. This is not new or generator-specific. Time-of-Use Pricing is a business model that seeks to change consumer behaviour. Off-peak tariffs are a classic example.
What household utilities [heaters, dish and cloths washing, dryers, heaters, hot water] are run in what time frames? I am not sure whether this discipline is well understood by consumers or actually acted upon.
I am a pensioner, which means I am in residence during normal business hours, so my consumption profile may be different to anyone else’s.
During the day, an employer would be paying for climate control [heating and cooling]. In my case, Centrelink provides an Energy Supplement Payment as part of my pension entitlement.
I feel what is not mentioned here is that Solar Panels more often produce less than Peak Output. They really only crank in summer. Systems as mentioned above are better optimised for winter. However, I feel the optimum panel orientation is a N-S Ridge, with most of the panels on the West, where they pick up the afternoon sun. If one has heaps of panels, the slightly lower output spread over more of the day matches consumption better.
Grid Export really from the consumer perspective is wasted energy: like a compost bin: Useful as it recycles waste! The real idea is to put that energy to work: The EV, HWS, Appliances, AC heating & cooling & anything left over in the battery. Also, usually now the Battery inverter is bigger capacity than the PV inverter, so one can export more during the evening peak if a reasonable recompense can be found (eg 3 hours @ 8Kw is over 20Kw after losses).
Mathew,
Thinking remains stuck in a bottle only if the cork is hammered in tight.
Prosumer grid export has always been limited, so self consumption is *the* way to uncork solar utilisation.
BEV sales are through the roof because of ICEV mobility unreliability and high cost. But fast learners are not just eliminating fuel cost while also ensuring mobility security, but winning themselves a $1/kWh vehicle FiT, in open-road export. The more they drive their several BEVs per household, the more they save. Driving an ICEV is a carbon tax, higher in the years to come.
The savings could be spent on a bigger solar system, installed in an off-grid garage if that simplifies paperwork. My 27 kW of array has powered up to 57 kWh/day, a fair bunch of that in BEVs.
My annual self-consumption is only 6 MWh, though. You could doubtless do better, with a bigger household. All it takes is more panels/inverters and a few BEVs asap. (A swimming pool might do it, but *much* less profitably.)
Nice one
Why do you think that more households rely on solar in real time?
I agree this has happened over the past three or four years. FiT has dropped to “why bother” levels and simultaneously import rates have gone up significantly making offsetting imports the only financial ROI for most.
But with almost all new installs including a battery and many large battery installs alongside existing solar, it would seem to me that total KWh across the day is much more important than whether the minute of cloud passed over at 3:52 or 3:57. The incentive to perfectly match consumption to production every minute I would therefore argue is lowering
Yes, two things are real concerns:
Maximise generation, as that trumps storage, always. A few kW from a 3x oversized array, during all-day total overcast, can leave the battery at 100% at day’s end, if consumption adapts to conditions. (Off-grid here, I turn off the HWS if the murk is stygian.)
Amply size the battery: 30 kWh is a good start, filling a lot of generation holes. It can even top up some km on the BEV in a tight spot, and amply fill cloud gaps without blinking.
Then monitoring is largely irrelevant – eye candy for technophiles. My daily monitoring is a glance at cloud cover, then at battery SoC, then decide whether today is the day for topping up the BEV or boosting the HWS, or both.
On a sunny day here, consumption has been 57 kWh, in deep murk only 5.7 kWh for the day, 6 stars insulation helping there. (But the wood heater is lower capital cost and still zero net emissions.)
The wiggly graphs help remind whether yesterday was cloudy or not, but what else?
Actually, the issue for all classes of generators, both domestic, commercial, small business and utilities, is the mismatch between generation and demand.
And the solution has always been time shifting consumption to production or production to consumption.
This business strategy applies to all consumers. Commercially, it is supported by Time-of-U and Off-Peak Tariffs. For consumers, it is when utilities are set to run [Hot Water, Pool Pumps, Dish and Clothes washers, BEV charging, etc.] that coincide with day [off peak] or battery storage.
You also have to accept that batteries are consumers of power [overhead] and can absorb curtailment events and time-shift production to consumption.
I have a 10.03 kW Solar System and 13.6 kWh battery located in FNQ, and based on data available in 5-minute intervals on 25 April 2026 [Clear Weather], I did not experience any measurable curtailment [over 5kW]
ToU consumption was Day [off peak] 0.03, Night [shoulder] 0.01 and peak 0.02 per kWh
Firstly, Solar and Battery is a home improvement, not a business opportunity. It is about reducing cash flow, which you can then calculate the tax-free financial performance as a return on capital expensed.
Secondly, FIT to date mostly represents the wholesale spot price for power paid in the market. And the value of this cash flow should have very little influence on any buying decision as it is trending to $0.00 value.
No two households will have exactly the same consumption profile.
The absolute best data for analysing a consumption profile is 24 hours of data in five-minute intervals over 365 days. This data will allow you to identify power consumption under a ToU Tariff, including kWh for Day, Shoulder, and Peak.
What is the pricing vulnerability for domestic and small business Solar, for which there is currently no obvious answer? And that is any new distribution pricing model to recover the cost of distribution other than generation in the retail price of imported power.
With how our Power Company is detecting our peak use, that small cloud may end up costing more than you expect.
A power company generally cannot directly see the detailed “behind-the-meter” flows inside your home unless you have special monitoring equipment connected to them.
What they normally see is only the net flow at the meter connection point.